paulbrodersen / Netgraph
Programming Languages
Projects that are alternatives of or similar to Netgraph
netgraph
Python module to make publication quality plots of weighted, directed graphs of medium size (10-100 nodes). Unweighted, undirected graphs will look perfectly fine, too. The node positions can be tweaked using the mouse (after an initial draw). It only depends on numpy and matplotlib.

Raison d'être:
Existing draw routines for networks/graphs in python (networkx, igraph) use fundamentally different length units for different plot elements. This makes it hard to
- provide a consistent layout for different axis / figure dimensions, and
- judge the relative sizes of elements a priori.
This module amends these issues.
Furthermore, algorithmically finding a visually pleasing layout of
node positions is, in general, difficult. This is demonstrated by the
plethora of different algorithms in use (if graph layout was a solved
problem, there would only be one algorithm). To ameliorate this
problem, this module contains an InteractiveGraph class, which allows
node positions to be tweaked with the mouse (after an initial draw).
import numpy as np
import matplotlib.pyplot as plt; plt.ion()
import netgraph

# Construct sparse, directed, weighted graph
# with positive and negative edges:
total_nodes = 20
weights = np.random.randn(total_nodes, total_nodes)
connection_probability = 0.2
is_connected = np.random.rand(total_nodes, total_nodes) <= connection_probability
graph = np.zeros((total_nodes, total_nodes))
graph[is_connected] = weights[is_connected]

# Make a standard plot:
netgraph.draw(graph)

# Create an interactive plot.
# NOTE: you must retain a reference to the object instance!
# Otherwise the whole thing will be garbage collected after the initial draw
# and you won't be able to move the plot elements around.
plot_instance = netgraph.InteractiveGraph(graph)

# The position of the nodes can be adjusted with the mouse.
# To access the new node positions:
node_positions = plot_instance.node_positions
Finally, it is sometimes convenient to change the graph itself "on the fly" (not just the layout).
To that end, the class InteractivelyConstructDestroyGraph supports addition and deletion of nodes and edges.
However, so far, only unweighted graphs are properly supported.
import netgraph
import matplotlib.pyplot as plt; plt.ion()

# Initialise figure and set size of axis to draw on.
fig, ax = plt.subplots(1, 1)
ax.set(xlim=[-2, 2], ylim=[-2, 2])

# Define a graph. Here we start with a single edge:
graph = [(0, 1)]

# Initialise plot:
plot_instance = netgraph.InteractivelyConstructDestroyGraph(graph, draw_arrows=True, ax=ax)

# As before, the node layout can be changed by selecting the nodes and moving them around
# using the mouse. The graph itself can be manipulated using the following hotkeys:
#   Pressing 'A' will add a node to the graph at the current cursor position.
#   Pressing 'D' will remove a selected node.
#   Pressing 'a' will add edges between all selected nodes.
#   Pressing 'd' will remove edges between all selected nodes.
#   Pressing 'r' will reverse the direction of edges between all selected nodes.

# To access the new node positions:
node_positions = plot_instance.node_positions

# The new graph can be accessed via the edge list:
edge_list = plot_instance.edge_list
Integration with other network analysis libraries
To facilitate interoperability, netgraph.draw supports various input formats for the graph argument.
In order of precedence:
-
Edge list:
Iterable of (source, target) or (source, target, weight) tuples, or equivalent (m, 2) or (m, 3) ndarray.
-
Adjacency matrix:
Full-rank (n,n) ndarray, where n corresponds to the number of nodes. The absence of a connection is indicated by a zero.
-
igraph.Graph or networkx.Graph object
import networkx
g = networkx.from_numpy_array(graph, networkx.DiGraph)
netgraph.draw(g)
Conversely, networkx.Graph and igraph.Graph objects can be easily instantiated from a netgraph.InteractiveGraph object (and derived classes):
# Instantiate an interactive graph from some other graph object:
interactive_graph = netgraph.InteractivelyCreateDestroyGraph(graph)

# Do stuff such as moving nodes around, or adding and deleting nodes or edges.
...

# Access current graph:
edge_list = interactive_graph.edge_list

# Access current node_positions (and nodes):
node_positions = interactive_graph.node_positions
nodes = node_positions.keys()
positions = node_positions.values()

# Create igraph.Graph or networkx.Graph objects:
igraph_graph = igraph.Graph(edge_list)
networkx_graph = networkx.from_edgelist(edge_list)
Customizability
Similar to networkx, netgraph provides a convenience function draw that "tries to do the right thing".
What constitutes the "right thing", however, is a matter of taste, and hence netgraph also provides direct access to the four core plotting routines wrapped by draw:
draw_nodesdraw_edgesdraw_node_labelsdraw_edge_labels
Please refer to the documentation of these functions for a list of all available arguments to customize the layout of your graph.
Furthermore, all of these functions return containers of standard matplotlib objects, which can thus also be manipulated directly. In general, these containers are dictionaries, mapping the graph elements (node / edge) to their respective matplotlib artists (or text objects in the case of labels). Accessing and manipulating a specific plot element after the initial draw is hence straightforward.
import netgraph
import matplotlib.pyplot as plt; plt.ion()

# define graph and initial layout
edge_list = [(0, 1), (1, 2)]
node_positions = {0 : (0, 0), 1 : (1, 1), 2 : (1, 2)}

# plot graph
fig, ax = plt.subplots(1,1)
ax.set(xlim=[-1, 3], ylim=[-1, 3])
node_to_artist = netgraph.draw_nodes(node_positions, ax=ax)
edge_to_artist = netgraph.draw_edges(edge_list, node_positions, ax=ax)

# make some changes after the draw by setting matplotlib artist properties
special_edge = (0, 1)
special_artist = edge_to_artist[special_edge]
special_artist.set_facecolor('red')
fig.canvas.draw_idle()

# the same effect could have achieved by passing in the edge color argument:
edge_color = {(0, 1): 'k', (1, 2) : 'r'}
edge_to_artist = netgraph.draw_edges(edge_list, node_positions, edge_color=edge_color, ax=ax)
Installation
Easiest via pip:
pip install netgraph
For the newest and brightest (and probably buggiest) version:
pip install git+https://github.com/paulbrodersen/netgraph.git
Gallery
The following images show the netgraph output when using the default
settings, i.e. the output of draw in the absence of any arguments
other than graph.
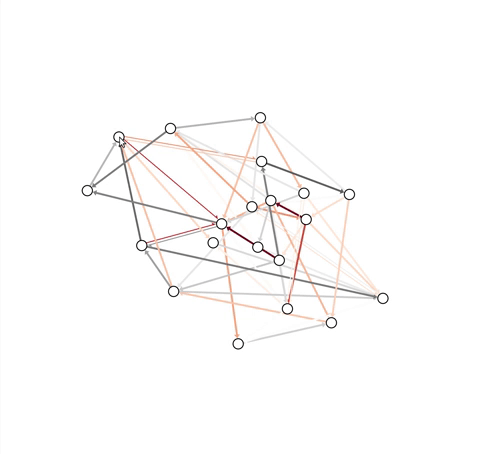
Default plot for a directed, weighted network:

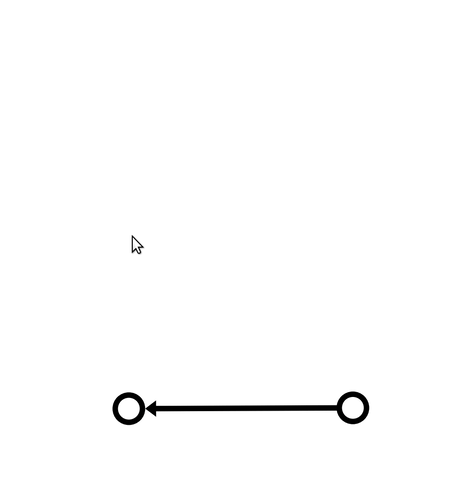
No arrows are drawn if the network appears undirected:

Edge weights are mapped to edge colors using a diverging colormap, by default 'RdGy'.
Negative weights are shown in red, positve weights are shown in gray.
A directed network with purely positive weights hence looks like this:

Unweighted networks are drawn with uniformly black edges:

Labels can be drawn on top of nodes.

Labels can be drawn on top of edges:
