anvaka / Ngraph.path.demo
Programming Languages
ngraph.path demo
This repository is a demo for the ngraph.path library. While its main purpose is to show the capabilities of the library, below you can find some design decisions for the demo itself.
Table of contents
- Data preparation
- Storing a graph
- Mobile first
- Async everything
- Rendering
- Hit testing
- The path finding
Data preparation
Data generated and stored in this repository comes from www.openstreetmap.org (it is made available under ODbL).
NB: The NYC graph was downloaded from http://www.dis.uniroma1.it/challenge9/download.shtml
Before this project, I didn't realize how powerful is the Open Street Map API (OSM API). Tools like http://overpass-turbo.eu/ allows you to quickly build a query and fetch any information about anything on the map. Including roads and their intersections.
For example, this query will return all cycle tracks in Seattle:
[out:json];
// Fetch the area id into variable `a`
(area["name"="Seattle"]["place"="city"])->.a;

// Fetch all ways with a highway tag equal to `cycleway`
// inside area `a`
way["highway"="cycleway"](area.a);

// And join those highways with lat/lon points:
node(w);

// print everything to the output.
out meta;
You can read more about overpass API here: http://wiki.openstreetmap.org/wiki/Overpass_API
At the end, I created different scripts to convert roads into a graph format. In this graph, each road is an edge, and each intersection is a node. The scripts are not documented and are not intended for reuse, but let me know if you need something like this in a separate package.
Storing a graph
Once data is fetched from OSM, I save the graph into a binary format. My main goal here was to compress the data as much as possible, but don't spend too much time on the algorithm.
So, I decided to save graphs into two binary files. One file for coordinates, and the other one for the edges.
The coordinates file is just a flat sequence of x, y pairs (int32, 4 bytes per coordinate).
The index where a pair appears, corresponds to a node's identifier.
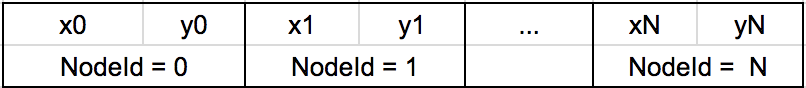
The edges file then becomes a flat sequence of fromNodeId, toNodeId pairs.

This means that node 1 has a link to 2, and 2 has a link to 3, and so on.
The required storage size for any graph with V nodes and E edges can be calculated as:
 storage_size = V * 4 * 2 +  # 4 bytes per two coordinates per node
                E * 4 * 2 =  # 4 bytes per two node ids per edge
                (V + E) * 8  # in bytes
This is not the most efficient compression algorithm, but it was very easy to implement
Note: Originally I wanted to include edge weights to the format (one more int32 record), but that made loading of the graph over mobile connection very slow.
Mobile first
I believe long gone the times, when mobile was a "nice to have" addition. I imagined, when I publish this project, majority of my visitors will read about it on a mobile device. And if they will not be able to see the demo fast - I'll lose them as much fast.
So, everything what I did was tested on mobile. I have a very fast telephone from "some kind of a fruit company", but I also wanted to be sure that it will work on Android. For these purposes, I bought one of the cheapest phones. This phone helped me discover a lot of usability and performance problems.
Async everything
The slowest part was initial loading of the website. The code to load graph looked something like this:
for (let i = 0; i < points.length; i += 2) {
    let nodeId = Math.floor(i / 2);

    let x = points[i + 0];
    let y = points[i + 1];

    // graph is an instance of https://github.com/anvaka/ngraph.graph
    graph.addNode(nodeId, { x, y })
}
This may not seem like a problem at the first glance, but when you run this code on a large graph and a not very powerful mobile device, the page becomes unresponsive, and the website appears dead.
How can we solve this? I saw some people transfer CPU intensive tasks to WebWorkers. That is a very decent approach in many cases. Unfortunately, using WebWorkers implies more coding complexity, than I wanted to allow for this demo project. We would have to think about data transfer, battery lifetime, threads synchronization, fallback alternatives etc.
So, what can we do instead? I decided to break the loop. I'd run it for a few iterations,
check how much time it took us, and then schedule next chunk of work with setTimeout().
This is implemented in rafor.
Using asynchronous for loop, allowed me to constantly inform the outer world
about what is going on inside:

Rendering
Now that we have a graph, it's time to show it on the screen. Obviously, we cannot use SVG to show millions of elements - that would be impossibly slow. One way to go about it would be to generate tiles, and use something like Leaflet or OpenSeadragon to render a map.
I wanted to have more control over the code (as well as learn more about WebGL), so I built a WebGL renderer from scratch. It employs a "scene graph" paradigm, where scene is constructed from primitive elements. During frame rendering, the scene graph is traversed, and nodes are given opportunity to refresh their presentation.
NOTE: The renderer is available here, but it is intentionally under-documented. I'm not planning to "release" it yet, as I'm not 100% sure I like everything about it.
Battery
Initial implementation was re-rendering scene on every frame from scratch. Very quickly
I realized that this makes mobile device very hot very soon, and the battery goes from
100% to 0% in a quick fashion.
This was especially painful during programming. I was working on this demo in my spare time from coffee shops, with limited access to power. So I had to either think faster or find a way to conserve energy :).
I still haven't figured out how to think faster, so I tried the latter approach. Turns out solution was simple:
Don't render scene on every single frame. Render it only when explicitly asked, or when we know for sure that the scene was changed.
This may sound too obvious now, but it wasn't before. Most WebGL tutorials suggest a simple loop:
function frame() {
    requestAnimationFrame(frame); // schedule next frame;

    renderScene(); // render current frame.
    // nothing wrong with this, but this may drain battery quickly
}
With "conservative" approach, I had to move requestAnimationFrame outside from the frame() method:
let frameToken = 0;

function renderFrame() {
    if (!frameToken) frameToken = requestAnimationFrame(frame);
}

function frame() {
    frameToken = 0;
    renderScene();
}
This approach allows anybody to schedule next frame in response to actions. For example,
when user drags scene and changes transformation matrix, we can call renderFrame() to update the scene.
The frameToken de-dupes multiple calls to renderFrame().
Yes, conservative approach required a little bit more work, but at the end, battery life was amazing.
Text and lines
WebGL is not the most intuitive framework. It is notoriously hard to deal with text and "wide lines" (i.e. lines with width greater than 1px) in WebGL.
As I'm still learning WebGL, I realize that it would take me long time to build a decent wide lines rendering or add text support.
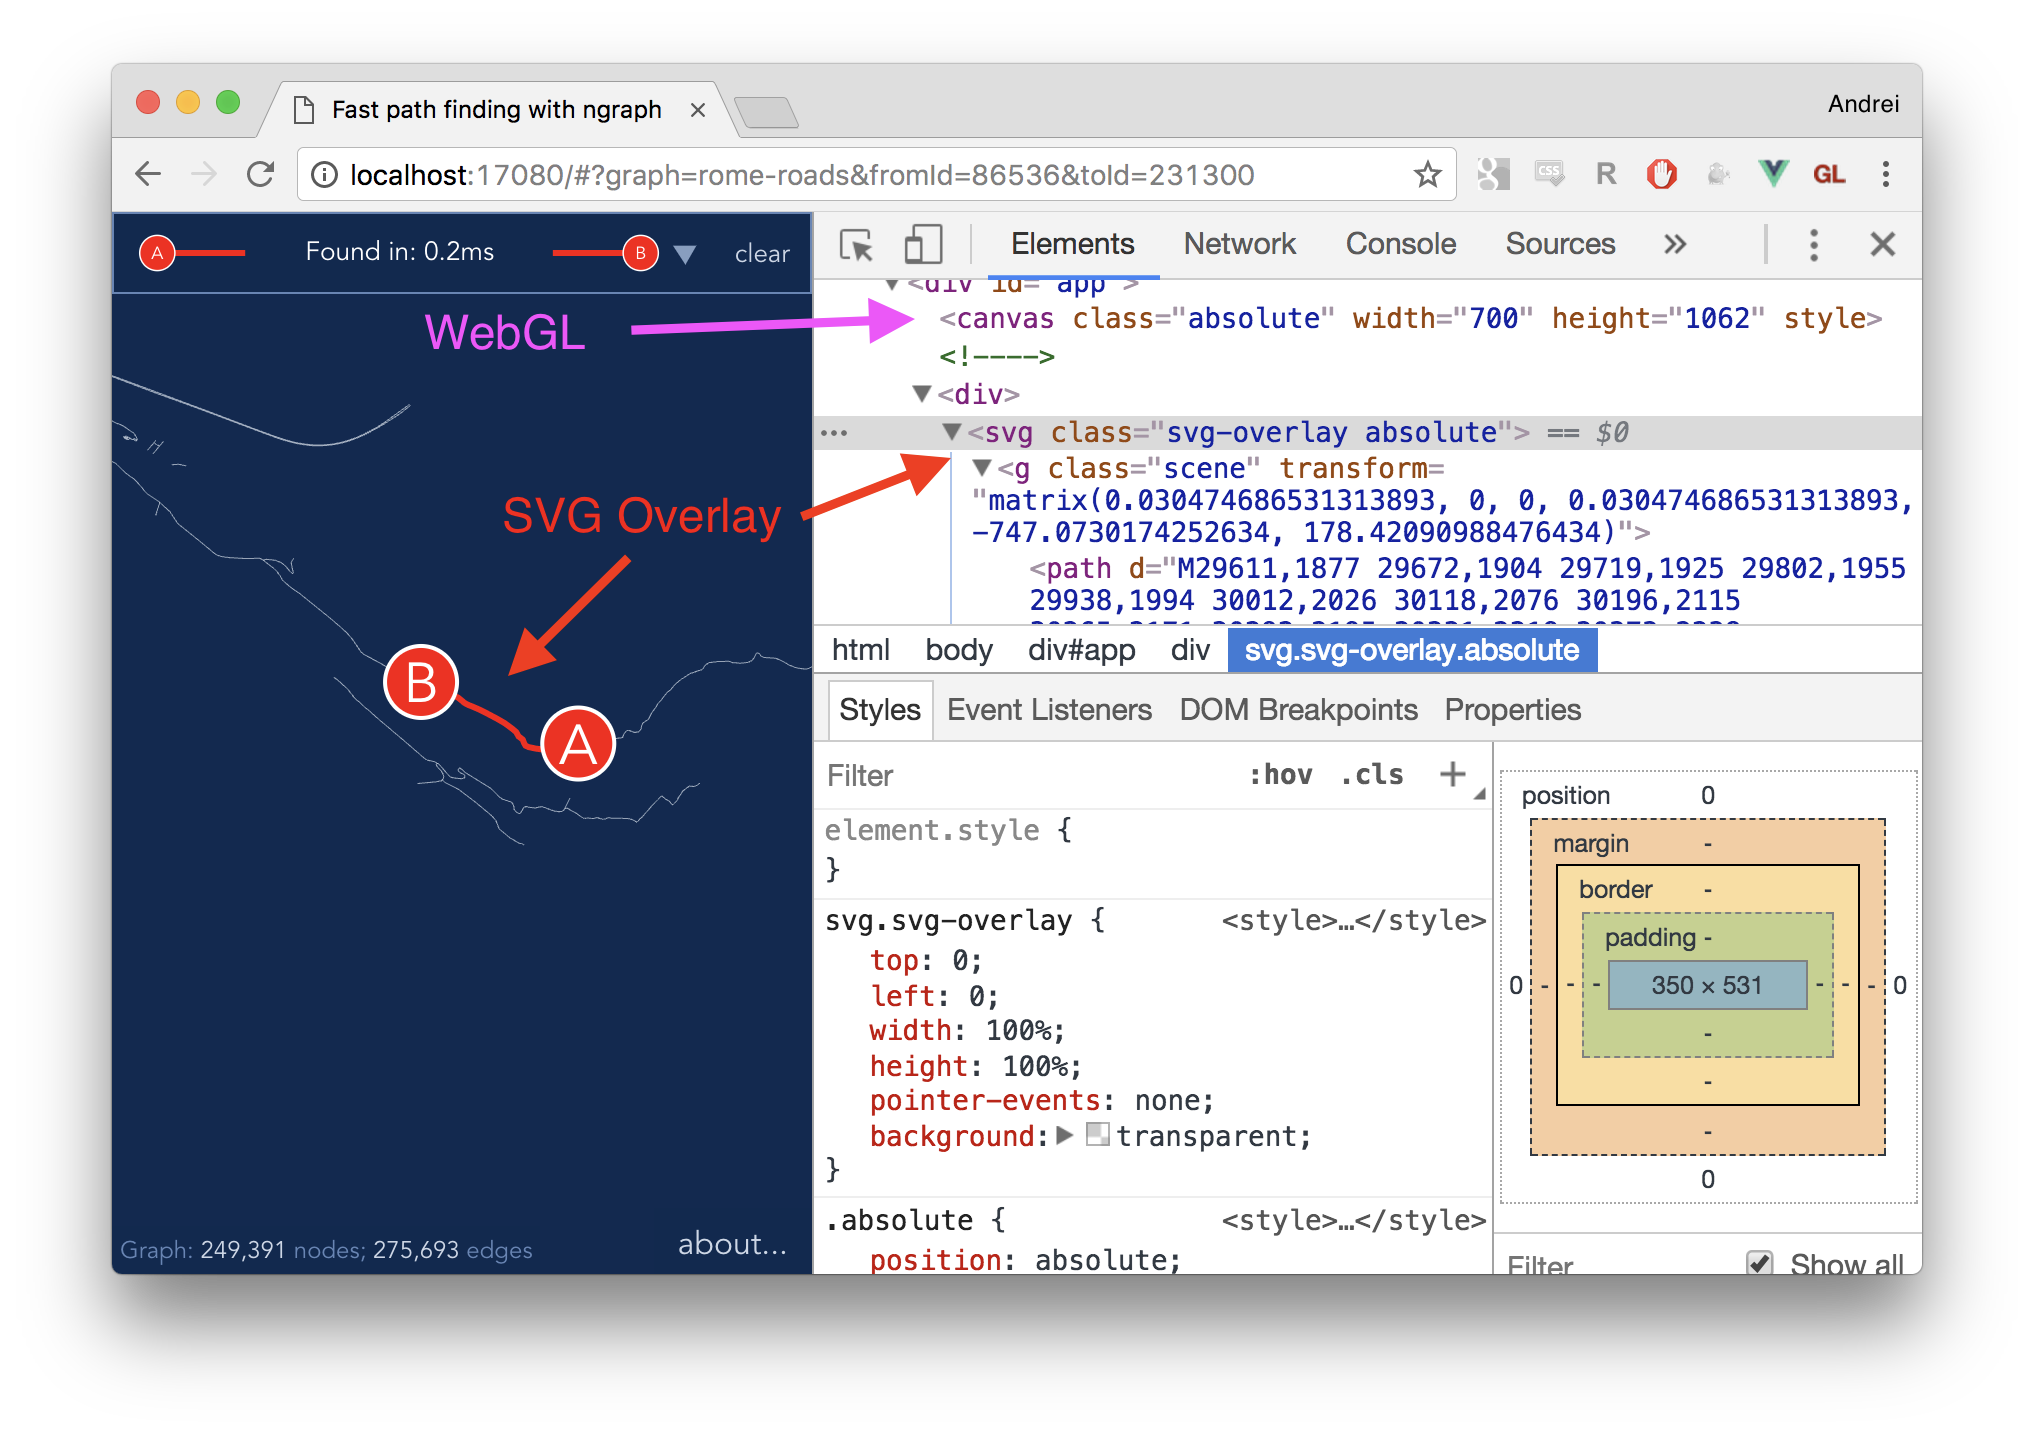
On the other hand, I want wide lines and text only to show a path. A few DOM nodes should be enough...
Turns out, it was straightforward to add a new element
to the scene graph, which applies transforms to SVG element. The SVG element is
given transparent background and pointer-events: none; so it's completely invisible
from interaction standpoint:
Pan and zoom
I wanted to make pan and zoom interaction similar to what you would normally expect from a website like Google Maps.
I've already implemented a pan/zoom library for SVG: anvaka/panzoom. With few changes to the code, I decoupled transform computation from transform application.
So, panzoom listens to input events (mousedown, touchstart, etc.), performs smooth transition on
a transformation matrix, and forwards this matrix to a "controller". It is responsibility of the
controller to apply transforms.
This is not yet documented in the panzoom library, but this is all it takes to enable pan/zoom in WebGL:
Hit testing
At this point we discussed how the data is loaded, how it is rendered, and how we can move around the graph.
But how do we know which point is being clicked? Where are the start and the end points of the path?
When we click on the scene, we could naively iterate over all points and find the nearest point to our click. In fact, this is a decent solution if you have a thousand points or less. In our case, with several hundred thousands points, that would be very slow.
I used a QuadTree to build an index of points. After QuadTree is created,
you can query it in logarithmic time for the nearest neighbors around any coordinate.
While QuadTree may sound scarry, it's not very much different from a regular binary tree.
It is easy to learn, easy to build and use.
In particular, I used my own yaqt library, because it had minimal memory overhead for my data layout. There are better alternatives that you might want to try as well (for example, d3-quadtree).
The path finding
We have all pieces in place: we have the graph, we know how to render it, and we know what was clicked. Now it's time to find the shortest path:
let start = window.performance.now();

// pathfinder is an instance of https://github.com/anvaka/ngraph.path
let path = pathFinder.find(fromId, toId);

let end = window.performance.now() - start;
I was contemplating about adding asynchronous path finding, but decided to put that work off, until it is really necessary (let me know).
Developing locally
If you'd like to try this website locally:
# install dependencies
npm install

# serve with hot reload at localhost.
npm start

# build for production with minification
npm run build

# build for production and view the bundle analyzer report
npm run build --report
Thank you
Thanks for reading this! I hope you enjoyed it as much as I enjoyed creating the ngraph.path library.
Have fun!