openXu / Oxchart
Licence: apache-2.0
各种自定义图表库,使用简单,支持扩展
Stars: ✭ 715
Programming Languages
java
68154 projects - #9 most used programming language
Projects that are alternatives of or similar to Oxchart
Financialcustomerview
各种金融类的自定义View,基金走势图、分时图、蜡烛图、各种指标等,一步一步构建庞大的基金自定View...
Stars: ✭ 642 (-10.21%)
Mutual labels: view, chart
Android Ratingreviews
Simple star rating system bars, a view similar to the ones seen on Google Playstore. ⭐🌟✨
Stars: ✭ 110 (-84.62%)
Mutual labels: view, chart
Aachartkit Swift
📈📊📱💻🖥️An elegant modern declarative data visualization chart framework for iOS, iPadOS and macOS. Extremely powerful, supports line, spline, area, areaspline, column, bar, pie, scatter, angular gauges, arearange, areasplinerange, columnrange, bubble, box plot, error bars, funnel, waterfall and polar chart types. 极其精美而又强大的跨平台数据可视化图表框架,支持柱状图、条形图、…
Stars: ✭ 1,962 (+174.41%)
Mutual labels: view, chart
Easysignseekbar
本库主要提供一个漂亮而强大的自定义SeekBar,进度变化由提示牌 (sign)展示,具有强大的属性设置,支持设置section(节点)、mark(标记)、track(轨迹)、thumb(拖动块)、progress(进度)、sign(提示框)等功能
Stars: ✭ 629 (-12.03%)
Mutual labels: view
Chartify
📊 📈 📉 React.js plugin for building charts using CSS
Stars: ✭ 671 (-6.15%)
Mutual labels: chart
Xychart
XYChart is designed for line & bar of charts which can compare mutiple datas in form styles, and limited the range of values to show, and so on.
Stars: ✭ 707 (-1.12%)
Mutual labels: chart
Windowimageview
An ImageView display in RecyclerView, looks like window.
Stars: ✭ 699 (-2.24%)
Mutual labels: view
Bizcharts
Powerful data visualization library based on G2 and React.
Stars: ✭ 5,771 (+707.13%)
Mutual labels: chart
Physicslayout
Android layout that simulates physics using JBox2D
Stars: ✭ 658 (-7.97%)
Mutual labels: view
Chartkick.py
Create beautiful Javascript charts with minimal code
Stars: ✭ 695 (-2.8%)
Mutual labels: chart
Vis Timeline
📈 Create a fully customizable, interactive timelines and 2d-graphs with items and ranges.
Stars: ✭ 654 (-8.53%)
Mutual labels: chart
Discretescrollview
A scrollable list of items that centers the current element and provides easy-to-use APIs for cool item animations.
Stars: ✭ 5,533 (+673.85%)
Mutual labels: view
Hsstockchart
Stock Chart include CandleStickChart,TimeLineChart. 股票走势图,包括 K 线图,分时图,手势缩放,拖动
Stars: ✭ 602 (-15.8%)
Mutual labels: chart
Quickshot
Capture images of any View, SurfaceView or Bitmap from your Android app in: .jpg .png or .nomedia with simple oneliner codes.
Stars: ✭ 663 (-7.27%)
Mutual labels: view
OXChart
自定义图标库,使用方便,扩展性强,后续会添加更多开发中使用到的图表
类库接入
build.gradle中添加依赖:
implementation 'com.openxu.viewlib:OXViewLib:<new version>'
指定java版本,否则会报错: android { ... compileOptions { sourceCompatibility JavaVersion.VERSION_1_8 targetCompatibility JavaVersion.VERSION_1_8 } ... }
图表使用
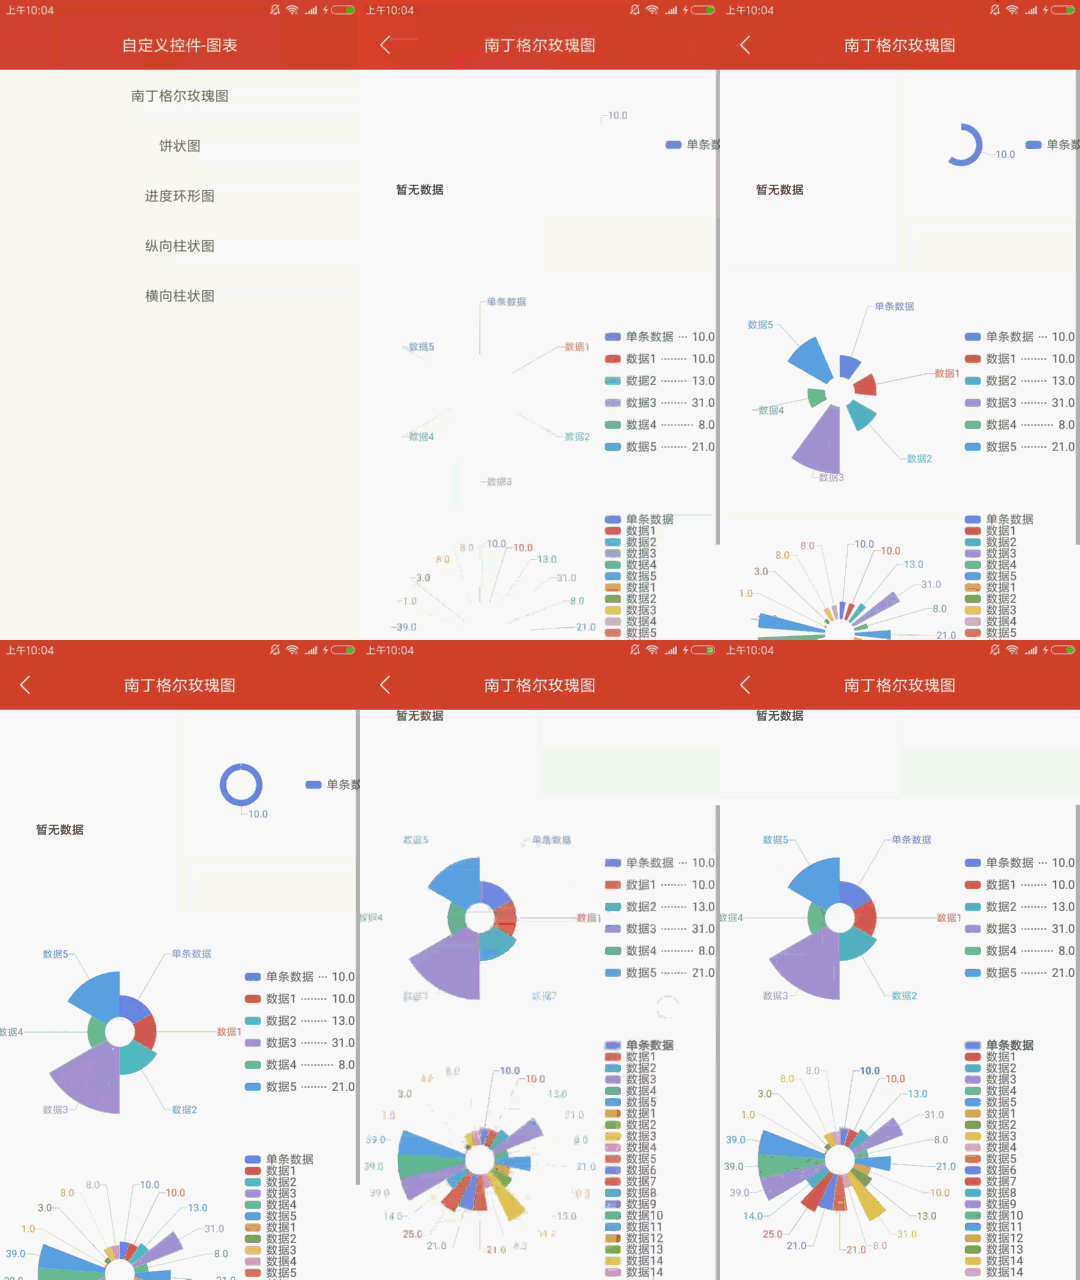
1、南丁格尔玫瑰图 NightingaleRoseChart
<com.openxu.cview.chart.rosechart.NightingaleRoseChart
    android:id="@+id/roseChartSmall"
    android:layout_width="match_parent"
    android:layout_height="wrap_content"/>
NightingaleRoseChart roseChartSmall = (NightingaleRoseChart)findViewById(R.id.roseChartSmall);
roseChartSmall.setShowChartLable(true);    //是否在图表上显示指示lable
roseChartSmall.setShowChartNum(false);     //是否在图表上显示指示num
roseChartSmall.setShowNumTouched(false);   //点击显示数量
roseChartSmall.setShowRightNum(true);      //右侧显示数量
roseList.add(new RoseBean(10, "数据1"));
roseList.add(new RoseBean(13, "数据2"));
roseList.add(new RoseBean(31, "数据3"));
roseList.add(new RoseBean(8, "数据4"));
roseList.add(new RoseBean(21, "数据5"));
//参数1:数据对象class, 参数2:数量属性字段名称, 参数3:名称属性字段名称, 参数4:数据集合
roseChartSmall.setData(RoseBean.class, "count", "ClassName", roseList);
roseChartSmall.setLoading(false);//是否正在加载,数据加载完毕后置为false
2、占比饼状图表 PieChartLayout
<com.openxu.cview.chart.piechart.PieChartLayout
   android:id="@+id/pieChart1"
   android:layout_width="match_parent"
   android:layout_height="180dp"
   android:layout_centerVertical="true"
   android:paddingRight="10dp"
   android:background="#ffffff"
   android:orientation="horizontal">
   <com.openxu.cview.chart.piechart.PieChart
       android:layout_width="match_parent"
       android:layout_height="match_parent"
       android:layout_weight="1" />
   <com.openxu.cview.chart.piechart.PieChartLableView
       android:layout_width="match_parent"
       android:layout_height="match_parent"
       android:layout_weight="2" />
</com.openxu.cview.chart.piechart.PieChartLayout>
 PieChartLayout pieChart1 = (PieChartLayout)findViewById(R.id.pieChart1);
/*
 * 圆环宽度
 * ringWidth > 0 :空心圆环,内环为白色,可以在内环中绘制字
 * ringWidth <=0 :实心
 */
pieChart1.setRingWidth(DensityUtil.dip2px(this, 15));
pieChart1.setLineLenth(DensityUtil.dip2px(this, 8)); // //指示线长度
pieChart1.setTagModul(PieChartLayout.TAG_MODUL.MODUL_CHART);       //在扇形图上显示tag
pieChart1.setDebug(false);
pieChart1.setLoading(true);
//请求数据
List<PieChartBean> datalist = new ArrayList<>();
datalist.add(new PieChartBean(20, "理发屋"));
datalist.add(new PieChartBean(20, "KTV"));
//显示在中间的lable
List<ChartLable> tableList = new ArrayList<>();
tableList.add(new ChartLable("建筑", DensityUtil.sp2px(this, 12), getResources().getColor(R.color.text_color_light_gray)));
tableList.add(new ChartLable("性质", DensityUtil.sp2px(this, 12), getResources().getColor(R.color.text_color_light_gray)));
pieChart1.setLoading(false);
//参数1:数据类型   参数2:数量字段名称   参数3:名称字段   参数4:数据集合   参数5:lable集合
pieChart1.setChartData(PieChartBean.class, "Numner", "Name",datalist ,tableList);
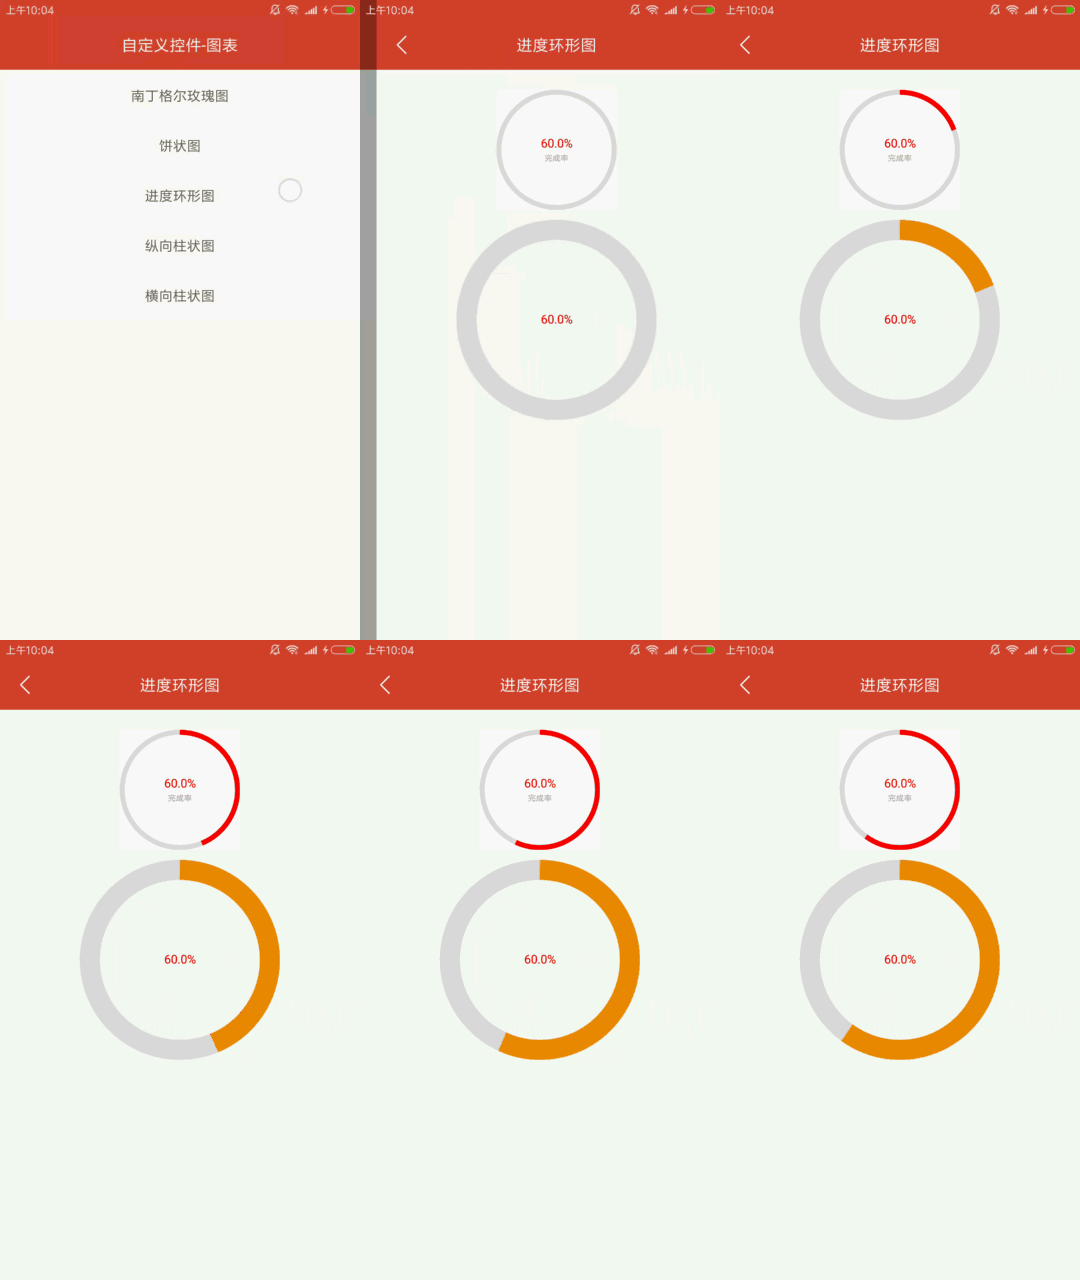
3、进度环形图 ProgressPieChart
<com.openxu.cview.chart.ProgressPieChart
    android:id="@+id/chart1"
    android:layout_width="120dp"
    android:layout_height="120dp"
    android:background="#ffffff"/>
ProgressPieChart chart1 = (ProgressPieChart)findViewById(R.id.chart1);
chart1.setProSize(DensityUtil.dip2px(this, 5));  //圆环宽度
chart1.setDebug(false);
chart1.setLoading(false);
chart1.setProColor(Color.parseColor("#ff0000"));  //进度颜色
//环形中间显示的lable
List<ChartLable> lables = new ArrayList<>();
lables.add(new ChartLable("60.0%",
        DensityUtil.sp2px(this, 12), Color.parseColor("#ff0000")));
lables.add(new ChartLable("完成率",
        DensityUtil.sp2px(this, 8), getResources().getColor(R.color.text_color_light_gray)));
chart1.setData(100, 60, lables);
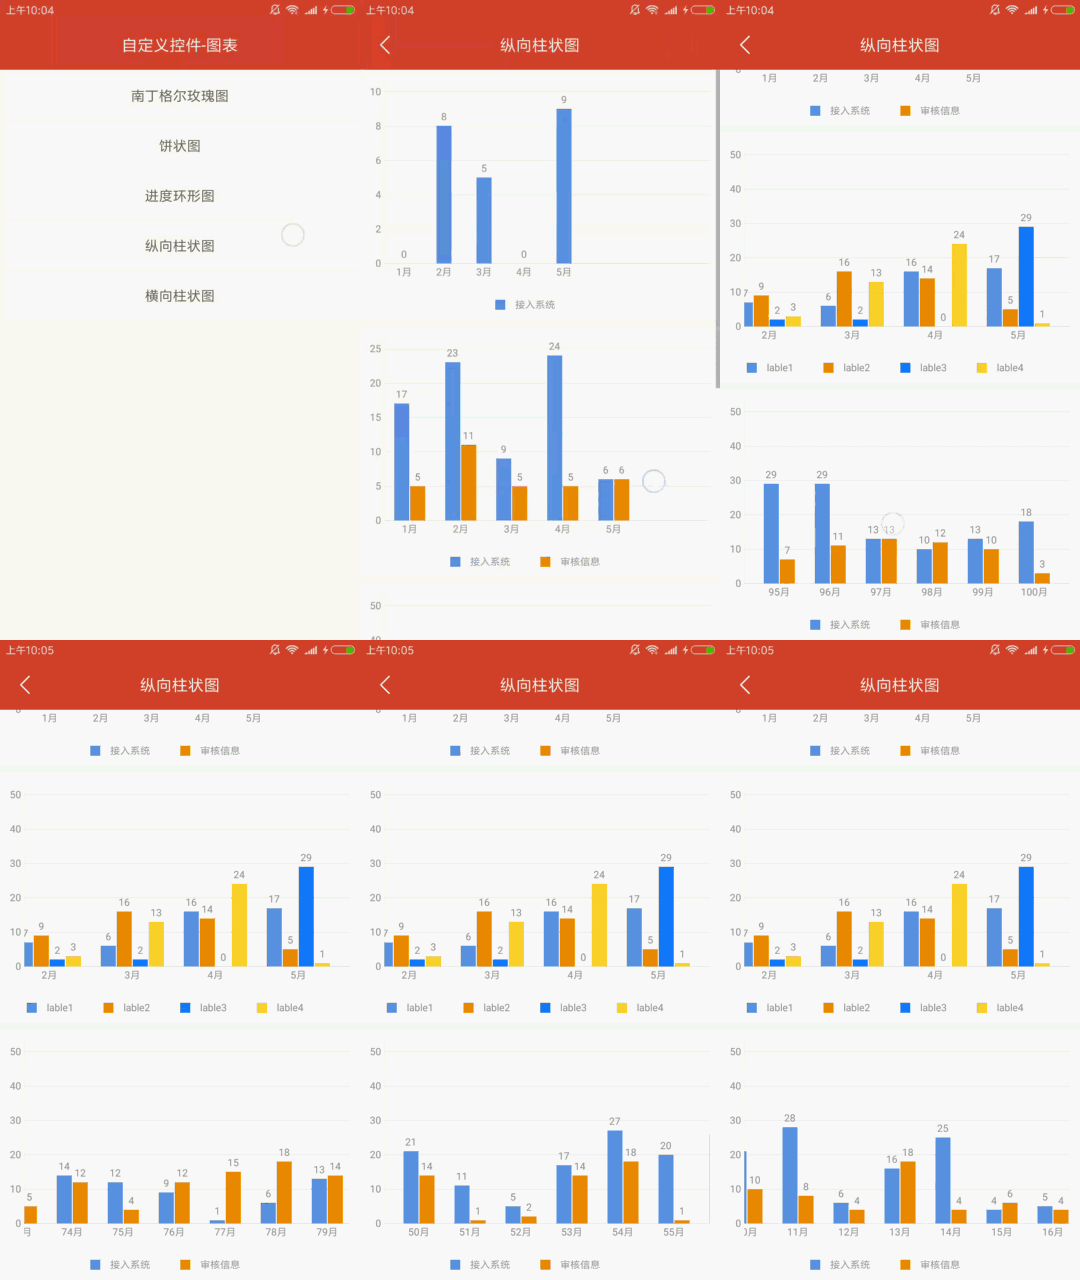
4、纵向柱状图 BarVerticalChart
<com.openxu.cview.chart.barchart.BarVerticalChart
    android:id="@+id/chart1"
    android:layout_width="match_parent"
    android:layout_height="250dip"
    android:background="#ffffff"
    android:padding="10dp"/>
BarVerticalChart chart1 = (BarVerticalChart)findViewById(R.id.chart1);
chart1.setBarSpace(DensityUtil.dip2px(this, 1));  //双柱间距
chart1.setBarItemSpace(DensityUtil.dip2px(this, 20));  //柱间距
chart1.setDebug(false);
chart1.setBarNum(2);   //一组柱子数量
chart1.setBarColor(new int[]{Color.parseColor("#5F93E7"),Color.parseColor("#F28D02")});
//X轴
List<String> strXList = new ArrayList<>();
//柱状图数据
List<List<BarBean>> dataList = new ArrayList<>();
for(int i = 0; i<5; i++){
    //此集合为柱状图上一条数据,集合中包含几个实体就是几个柱子
    List<BarBean> list = new ArrayList<>();
    list.add(new BarBean(random.nextInt(30), "接入系统"));
    list.add(new BarBean(random.nextInt(20), "审核信息"));
    dataList.add(list);
    strXList.add((i+1)+"月");
}
chart1.setLoading(false);
chart1.setData(dataList, strXList);
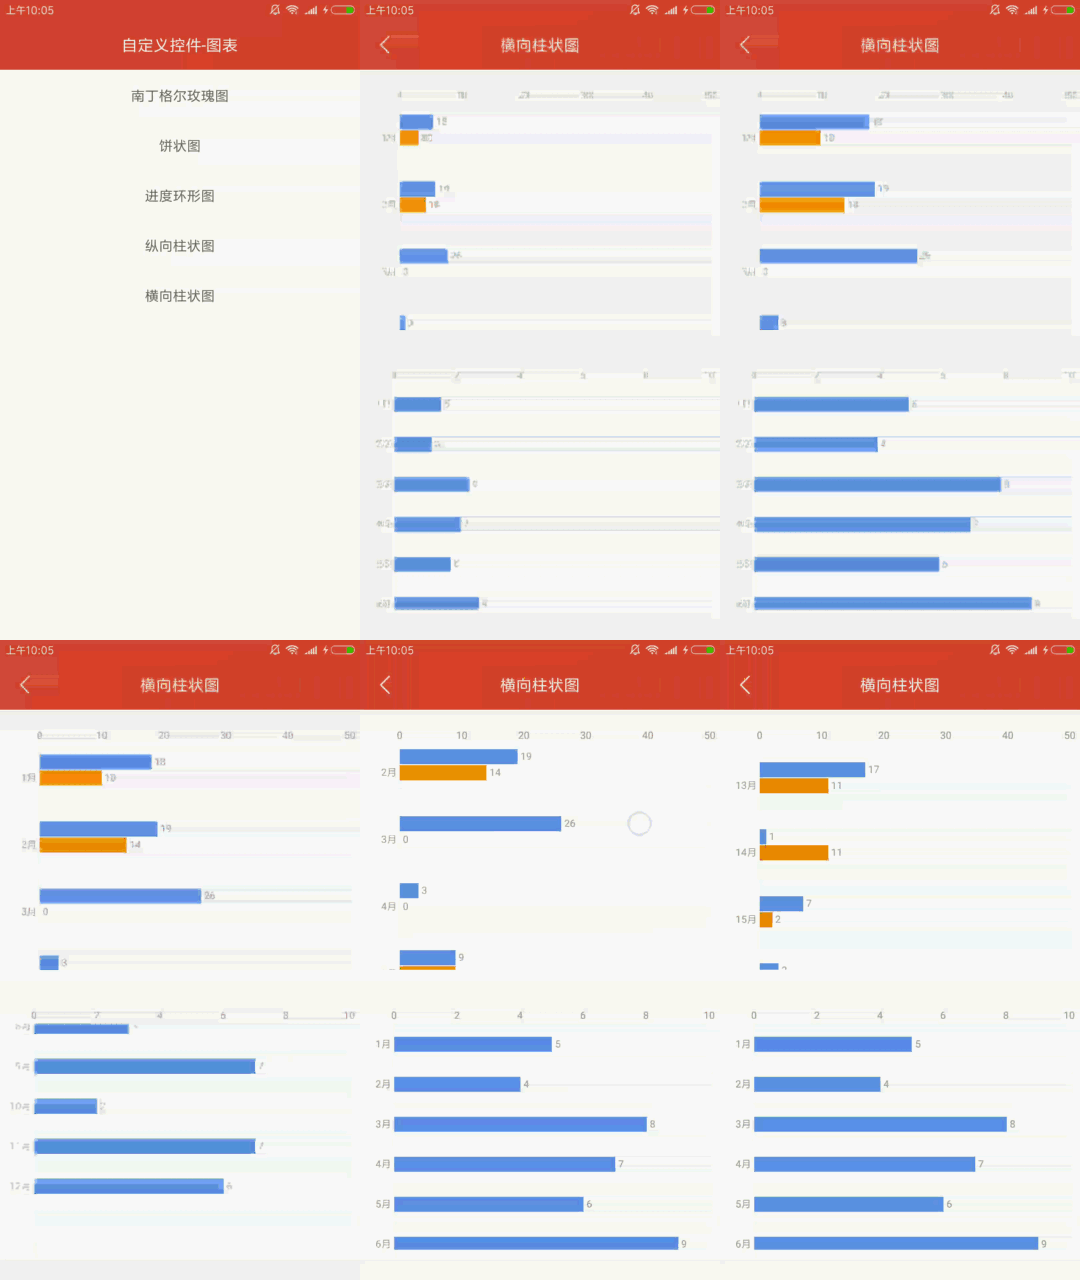
5、横向柱状图 BarHorizontalChart
<com.openxu.cview.chart.barchart.BarHorizontalChart
    android:id="@+id/chart1"
    android:layout_width="match_parent"
    android:layout_height="250dp"
    android:layout_marginTop="20dp"
    android:background="#ffffff"
    android:padding="10dip"/>
 BarHorizontalChart chart1 = (BarHorizontalChart)findViewById(R.id.chart1);
chart1.setBarSpace(DensityUtil.dip2px(this, 1));  //双柱间距
chart1.setBarItemSpace(DensityUtil.dip2px(this, 20));  //柱间距
chart1.setDebug(false);
chart1.setBarNum(3);
chart1.setBarColor(new int[]{Color.parseColor("#5F93E7"),Color.parseColor("#F28D02")});
//X轴
List<String> strXList = new ArrayList<>();
//柱状图数据
List<List<BarBean>> dataList = new ArrayList<>();
for(int i = 0; i<100; i++){
    //此集合为柱状图上一条数据,集合中包含几个实体就是几个柱子
    List<BarBean> list = new ArrayList<>();
    list.add(new BarBean(random.nextInt(30), "lable1"));
    list.add(new BarBean(random.nextInt(20), "lable2"));
    dataList.add(list);
    strXList.add((i+1)+"月");
}
chart1.setLoading(false);
chart1.setData(dataList, strXList);
Note that the project description data, including the texts, logos, images, and/or trademarks,
for each open source project belongs to its rightful owner.
If you wish to add or remove any projects, please contact us at [email protected].


