YingfanWang / Pacmap
Labels
Projects that are alternatives of or similar to Pacmap
PaCMAP
PaCMAP (Pairwise Controlled Manifold Approximation) is a dimensionality reduction method that can be used for visualization, preserving both local and global structure of the data in original space. PaCMAP optimizes the low dimensional embedding using three kinds of pairs of points: neighbor pairs (pair_neighbors), mid-near pair (pair_MN), and further pairs (pair_FP).
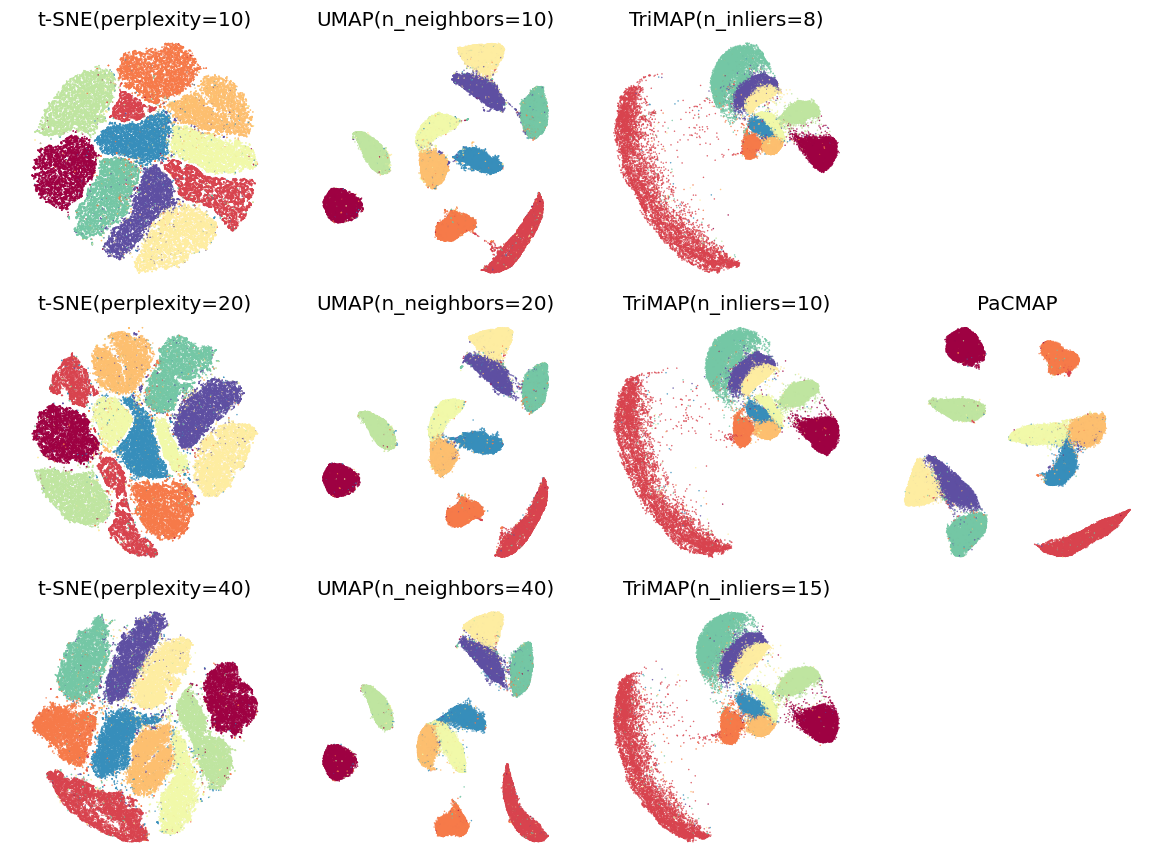
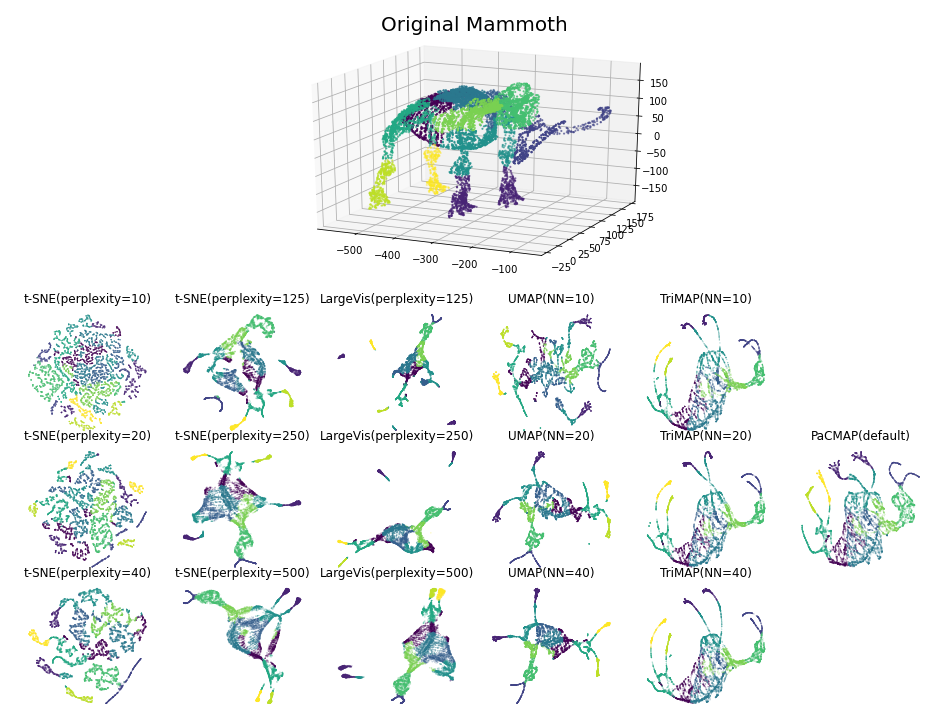
Previous dimensionality reduction techniques focus on either local structure (e.g. t-SNE, LargeVis and UMAP) or global structure (e.g. TriMAP), but not both, although with carefully tuning the parameter in their algorithms that controls the balance between global and local structure, which mainly adjusts the number of considered neighbors. Instead of considering more neighbors to attract for preserving glocal structure, PaCMAP dynamically uses a special group of pairs -- mid-near pairs, to first capture global structure and then refine local structure, which both preserve global and local structure. For a thorough background and discussion on this work, please read the paper.
Installation
You would require the following packages to fully use pacmap on your machine:
- numpy
- sklearn
- annoy
- numba
You can use pip to install pacmap from PyPI. It will automatically install the dependencies for you:
pip install pacmap
Alternatively, you can use the following command to install these dependencies:
pip install numpy
pip install scikit-learn
pip install annoy
pip install numba
Usage
The pacmap package is designed to be compatible with scikit-learn, meaning that it has a similar interface with functions in the sklearn.manifold module. To run pacmap on your own dataset, you should install the package following the instructions in this paragraph, and then import the module. The following code clip includes a use case about how to use pacmap on the COIL-20 dataset:
import pacmap
import numpy as np
import matplotlib.pyplot as plt

# loading preprocessed coil_20 dataset
# you can change it with any dataset that is in the ndarray format, with the shape (N, D)
# where N is the number of samples and D is the dimension of each sample
X = np.load("./data/coil_20.npy", allow_pickle=True)
X = X.reshape(X.shape[0], -1)
y = np.load("./data/coil_20_labels.npy", allow_pickle=True)

# initializing the pacmap instance
# Setting n_neighbors to "None" leads to a default choice shown below in "parameter" section
embedding = pacmap.PaCMAP(n_dims=2, n_neighbors=None, MN_ratio=0.5, FP_ratio=2.0)

# fit the data (The index of transformed data corresponds to the index of the original data)
X_transformed = embedding.fit_transform(X, init="pca")

# visualize the embedding
fig, ax = plt.subplots(1, 1, figsize=(6, 6))
ax.scatter(X_transformed[:, 0], X_transformed[:, 1], cmap="Spectral", c=y, s=0.6)
Benchmarks
The following images are visualizations of two datasets: MNIST (n=70,000, d=784) and Mammoth (n=10,000, d=3), generated by PaCMAP. The two visualizations demonstrate the local and global structure's preservation ability of PaCMAP respectively.
Parameters
The list of the most important parameters is given below. Changing these values will affect the result of dimension reduction significantly, as specified in section 8.3 in our paper.
-
n_dims: the number of dimension of the output. Default to 2. -
n_neighbors: the number of neighbors considered in the k-Nearest Neighbor graph. Default to 10 for dataset whose sample size is smaller than 10000. For large dataset whose sample size (n) is larger than 10000, the default value is: 10 + 15 * (log10(n) - 4). -
MN_ratio: the ratio of the number of mid-near pairs to the number of neighbors,n_MN=n_neighbors * MN_ratio. Default to 0.5.
-
FP_ratio: the ratio of the number of further pairs to the number of neighbors,n_FP=n_neighbors * FP_ratioDefault to 2.
The initialization is also important to the result, but it's a parameter of the fit and fit_transform function.
-
init: the initialization of the lower dimensional embedding. One of"pca"or"random". Default to"pca".
Other parameters include:
-
num_iters: number of iterations. Default to 450. 450 iterations is enough for most dataset to converge. -
pair_neighbors,pair_MNandpair_FP: pre-specified neighbor pairs, mid-near points, and further pairs. Allows user to use their own graphs. Default toNone. -
verbose: print the progress of pacmap. Default toFalse -
lr: learning rate of the AdaGrad optimizer. Default to 1. -
apply_pca: whether pacmap should apply PCA to the data before constructing the k-Nearest Neighbor graph. Using PCA to preprocess the data can largely accelerate the DR process without losing too much accuracy. Notice that this option does not affect the initialization of the optimization process. -
intermediate: whether pacmap should also output the intermediate stages of the optimization process of the lower dimension embedding. IfTrue, then the output will be a numpy array of the size (n,n_dims, 13), where each slice is a "screenshot" of the output embedding at a particular number of steps, from [0, 10, 30, 60, 100, 120, 140, 170, 200, 250, 300, 350, 450].
Reproducing the experiments
We have provided the code we use to run experiment for better reproducibility. The code are separated into three parts, in three folders, respectively:
-
data, which includes all the datasets we used, preprocessed into the file format each DR method use. Notice that since the Mouse single cell RNA sequence dataset is too big (~4GB), you may need to download from the link here. MNIST and FMNIST dataset is compressed, and you need to unzip them before using. COIL-100 dataset is still too large after compressed, please preprocess it using the file Preprocessing.ipynb on your own. -
experiments, which includes all the scripts we use to produce DR results. -
evaluation, which includes all the scripts we use to evaluate DR results, stated in Section 8 in our paper.
After downloading the code, you may need to specify some of the paths in the script to make them fully functional.
Citation
If you use PaCMAP in your publication, or you used the implementation in this repository, please cite our preprint here:
@misc{wang2020understanding,
      title={Understanding How Dimension Reduction Tools Work: An Empirical Approach to Deciphering t-SNE, UMAP, TriMAP, and PaCMAP for Data Visualization},
      author={Yingfan Wang and Haiyang Huang and Cynthia Rudin and Yaron Shaposhnik},
      year={2020},
      eprint={2012.04456},
      archivePrefix={arXiv},
      primaryClass={cs.LG}
}
License
Please see the license file.


