anvaka / Peak Map
Licence: mit
Make a ridge line chart from any region on Earth
Stars: ✭ 511
Programming Languages
javascript
184084 projects - #8 most used programming language
Peak map
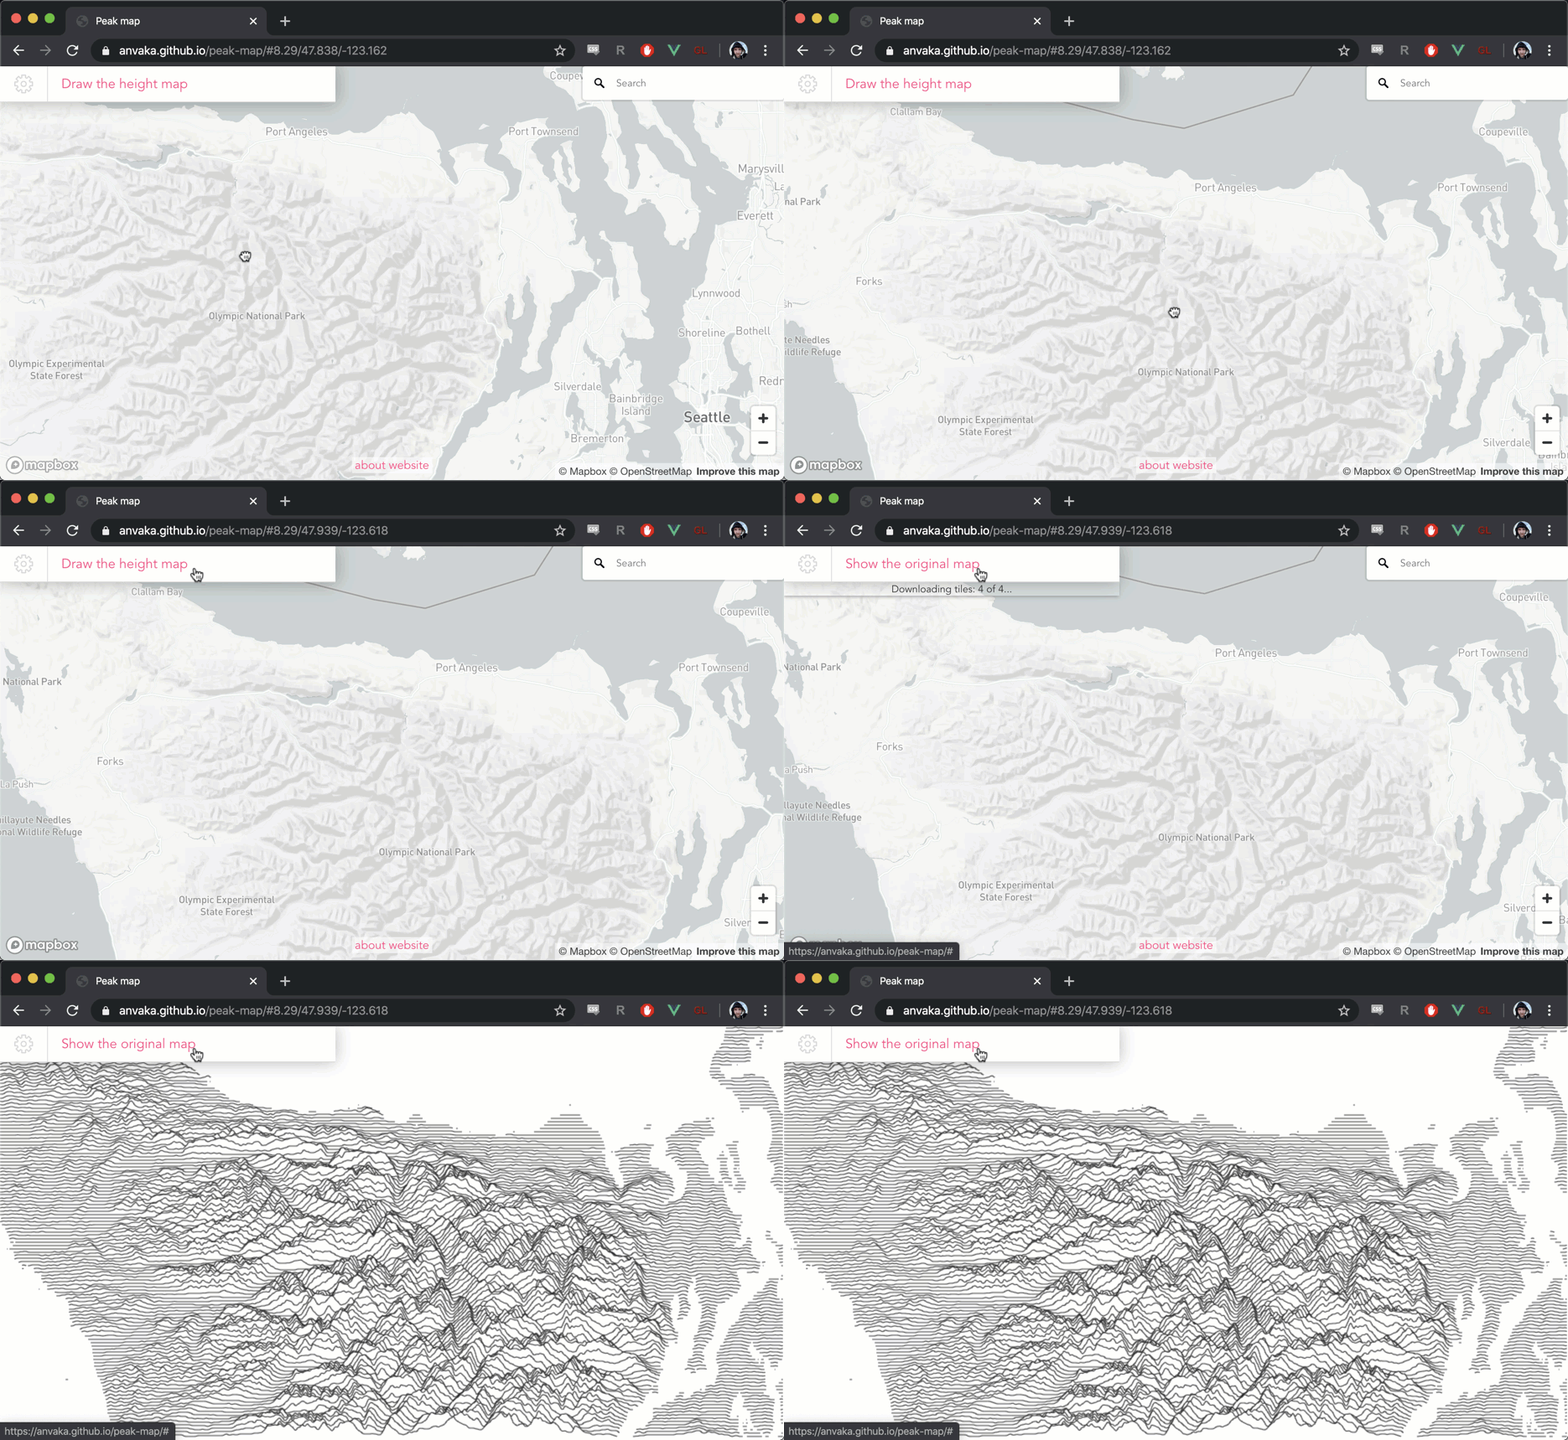
This website allows you to visualize elevation of any area on the map with
filled area charts (also known as a ridgeline):
How?
I'm using MapBox GL to draw the map. Once the area is selected, I'm using elevation data API from the MapBox.
The rendering of the lines is done on canvas overlay, using regular 2D canvas context.
Bonus
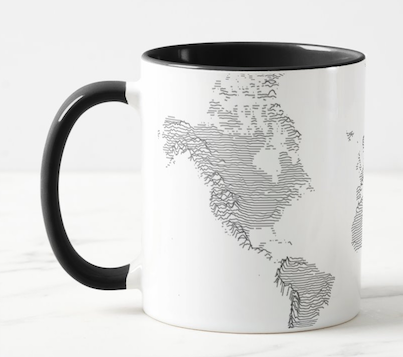
You can print the final map onto a mug if you like the result:
To do this, draw the heightmap, close the settings window, and click on the small fly-out menu.
See the video demo here: https://twitter.com/anvaka/status/1207352229885181952
Note that the project description data, including the texts, logos, images, and/or trademarks,
for each open source project belongs to its rightful owner.
If you wish to add or remove any projects, please contact us at [email protected].


