suifengqjn / Performancemonitor
iOS 性能检测
iOS开发中,如果是由于占用内存或者cpu过高导致性能下降,使用Instruments比较容易那些造成性能低下的”罪魁祸首”,在开发测试阶段它可以帮助我们分析软件运行的性能消耗,但是这可定是远远不够的,我们需要一个工具,可以在正式环境中由大量用户在使用过程中监控、分析到的数据更能解决一些隐藏的问题.
Time Profiler
可以查看多个线程中每个方法的耗时。
对Xcode进行设置
1. 不设置该选项,只能看到一堆栈
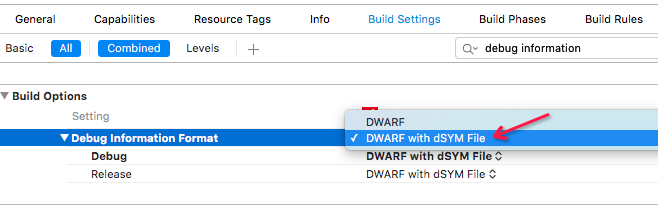
如果想要在TimeProfile中直观的查看方法耗时,需要对Xcode进行设置
在Xcode->Build Setting->Debug Information Format中设置选项为:DWARF with DSYM File
对TimeProfile进行设置
1.
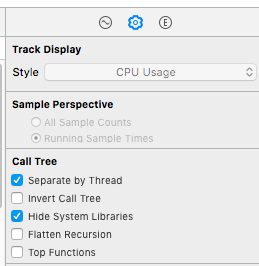
在TimeProfile的Call Tree中,右侧面板有三个检查器:record setting(记录设置)、display setting(展示设置)、还有extends detail(扩展详情)
2.
我们选择display setting,并在该选择器中勾选Separate by Thread和Hide System Libraries(两个最基本的选项)
3.
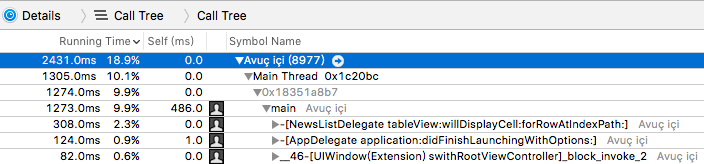
这样就可以逐级查看每个方法的耗时了
Allocations
这里可以对每个动作的前后进行Generations,对比内存的增加,查看使内存增加的具体的方法和代码所在位置。具体操作是在右侧Generation Analysis里点击Mark Generation,这样会产生一个Generation,切换到其他页面或一段时间产生了另外一个事件时再点Mark Generation来产生一个新的Generation,这样反复,生成多个Generation,查看这几个Generation会看到Growth的大小,如果太大可以点进去查看相应占用较大的线程里右侧Heaviest Stack Trace里查看对应的代码块,然后进行相应的处理。
Leak
可以在上面区域的Leaks部分看到对应的时间点产生的溢出,选择后在下面区域的Statistics>Allocation Summary能够看到泄漏的对象,同样可以通过Stack Trace查看到具体对应的代码区域。
UIImage
这里要主要是会影响内存的开销,需要权衡下imagedNamed和imageWithContentsOfFile,了解两者特性后,在只需要显示一次的图片用后者,这样会减少内存的消耗,但是页面显示会增加Image IO的消耗,这个需要注意下。由于imageWithContentsOfFile不缓存,所以需要在每次页面显示前加载一次,这个IO的操作也是需要考虑权衡的一个点。如果是从本地的NSData转换成UIImage, 最好使用dataWithContentsOfURL,并且采用NSDataReadingMappedIfSafe模式,这种模式系统会帮我们按需要加载数据,不会一次性加载全部。
优化首次加载时间
通过Time Profier可以查看到启动所占用的时间,如果太长可以通过Heaviest Stack Trace找到费时的方法进行改造。
寻找卡顿的切入点
监控卡顿,最直接就是找到主线程都在干些啥玩意儿.我们知道一个线程的消息事件处理都是依赖于NSRunLoop来驱动,所以要知道线程正在调用什么方法,就需要从NSRunLoop来入手.CFRunLoop的代码是开源,可以在此处查阅到源代码http://opensource.apple.com/source/CF/CF-1151.16/CFRunLoop.c,其中核心方法CFRunLoopRun简化后的主要逻辑大概是这样的:
int32_t __CFRunLoopRun()
{
    //通知即将进入runloop
    __CFRunLoopDoObservers(KCFRunLoopEntry);

    do
    {
        // 通知将要处理timer和source
        __CFRunLoopDoObservers(kCFRunLoopBeforeTimers);
        __CFRunLoopDoObservers(kCFRunLoopBeforeSources);

        __CFRunLoopDoBlocks();  //处理非延迟的主线程调用
        __CFRunLoopDoSource0(); //处理UIEvent事件

        //GCD dispatch main queue
        CheckIfExistMessagesInMainDispatchQueue();

        // 即将进入休眠
        __CFRunLoopDoObservers(kCFRunLoopBeforeWaiting);

        // 等待内核mach_msg事件
        mach_port_t wakeUpPort = SleepAndWaitForWakingUpPorts();

        // Zzz...

        // 从等待中醒来
        __CFRunLoopDoObservers(kCFRunLoopAfterWaiting);

        // 处理因timer的唤醒
        if (wakeUpPort == timerPort)
            __CFRunLoopDoTimers();

        // 处理异步方法唤醒,如dispatch_async
        else if (wakeUpPort == mainDispatchQueuePort)
            __CFRUNLOOP_IS_SERVICING_THE_MAIN_DISPATCH_QUEUE__()

        // UI刷新,动画显示
        else
            __CFRunLoopDoSource1();

        // 再次确保是否有同步的方法需要调用
        __CFRunLoopDoBlocks();

    } while (!stop && !timeout);

    //通知即将退出runloop
    __CFRunLoopDoObservers(CFRunLoopExit);
}
不难发现NSRunLoop调用方法主要就是在kCFRunLoopBeforeSources和kCFRunLoopBeforeWaiting之间,还有kCFRunLoopAfterWaiting之后,也就是如果我们发现这两个时间内耗时太长,那么就可以判定出此时主线程卡顿.
###量化卡顿的程度
要监控NSRunLoop的状态,我们需要使用到CFRunLoopObserverRef,通过它可以实时获得这些状态值的变化,具体的使用如下:
static void runLoopObserverCallBack(CFRunLoopObserverRef observer, CFRunLoopActivity activity, void *info)
{
    MyClass *object = (__bridge MyClass*)info;
    object->activity = activity;
}

- (void)registerObserver
{
    CFRunLoopObserverContext context = {0,(__bridge void*)self,NULL,NULL};
    CFRunLoopObserverRef observer = CFRunLoopObserverCreate(kCFAllocatorDefault,
                                                            kCFRunLoopAllActivities,
                                                            YES,
                                                            0,
                                                            &runLoopObserverCallBack,
                                                            &context);
    CFRunLoopAddObserver(CFRunLoopGetMain(), observer, kCFRunLoopCommonModes);
}
只需要另外再开启一个线程,实时计算这两个状态区域之间的耗时是否到达某个阀值,便能揪出这些性能杀手. 为了让计算更精确,需要让子线程更及时的获知主线程NSRunLoop状态变化,所以dispatch_semaphore_t是个不错的选择,另外卡顿需要覆盖到多次连续小卡顿和单次长时间卡顿两种情景,所以判定条件也需要做适当优化.将上面两个方法添加计算的逻辑如下:
static void runLoopObserverCallBack(CFRunLoopObserverRef observer, CFRunLoopActivity activity, void *info)
{
    PerformanceMonitor *moniotr = (__bridge PerformanceMonitor*)info;

    moniotr->activity = activity;

    dispatch_semaphore_t semaphore = moniotr->semaphore;
    dispatch_semaphore_signal(semaphore);
}
- (void)startMonitor
{
    if (observer)
        return;

    // 信号,Dispatch Semaphore保证同步
    semaphore = dispatch_semaphore_create(0);

    // 注册RunLoop状态观察
    CFRunLoopObserverContext context = {0,(__bridge void*)self,NULL,NULL};
    observer = CFRunLoopObserverCreate(kCFAllocatorDefault,
                                       kCFRunLoopAllActivities,
                                       YES,
                                       0,
                                       &runLoopObserverCallBack,
                                       &context);
    //将观察者添加到主线程runloop的common模式下的观察中
    CFRunLoopAddObserver(CFRunLoopGetMain(), observer, kCFRunLoopCommonModes);

    // 在子线程监控时长 开启一个持续的loop用来进行监控
    dispatch_async(dispatch_get_global_queue(0, 0), ^{
        while (YES)
        {
            //假定连续5次超时50ms认为卡顿(当然也包含了单次超时250ms)
            long st = dispatch_semaphore_wait(semaphore, dispatch_time(DISPATCH_TIME_NOW, 50*NSEC_PER_MSEC));
            if (st != 0)
            {
                if (!observer)
                {
                    timeoutCount = 0;
                    semaphore = 0;
                    activity = 0;
                    return;
                }
                //两个runloop的状态,BeforeSources和AfterWaiting这两个状态区间时间能够检测到是否卡顿
                if (activity==kCFRunLoopBeforeSources || activity==kCFRunLoopAfterWaiting)
                {
                    if (++timeoutCount < 5)
                        continue;
                    PLCrashReporterConfig *config = [[PLCrashReporterConfig alloc] initWithSignalHandlerType:PLCrashReporterSignalHandlerTypeBSD
                                                                                       symbolicationStrategy:PLCrashReporterSymbolicationStrategyAll];
                    PLCrashReporter *crashReporter = [[PLCrashReporter alloc] initWithConfiguration:config];
                    NSData *data = [crashReporter generateLiveReport];
                    PLCrashReport *reporter = [[PLCrashReport alloc] initWithData:data error:NULL];
                    NSString *report = [PLCrashReportTextFormatter stringValueForCrashReport:reporter
                                                                              withTextFormat:PLCrashReportTextFormatiOS];
                    //上传服务器
                    NSLog(@"此处发生卡顿:---%@", report);
                }//end activity
            }// end semaphore wait
            timeoutCount = 0;
        }// end while
    });
}
记录卡顿的函数调用
监控到了卡顿现场,当然下一步便是记录此时的函数调用信息,此处可以使用一个第三方Crash收集组件PLCrashReporter,它不仅可以收集Crash信息也可用于实时获取各线程的调用堆栈,使用示例如下:
PLCrashReporterConfig *config = [[PLCrashReporterConfig alloc] initWithSignalHandlerType:PLCrashReporterSignalHandlerTypeBSD
                                                                   symbolicationStrategy:PLCrashReporterSymbolicationStrategyAll];
PLCrashReporter *crashReporter = [[PLCrashReporter alloc] initWithConfiguration:config];

NSData *data = [crashReporter generateLiveReport];
PLCrashReport *reporter = [[PLCrashReport alloc] initWithData:data error:NULL];
NSString *report = [PLCrashReportTextFormatter stringValueForCrashReport:reporter
                                                          withTextFormat:PLCrashReportTextFormatiOS];
当检测到卡顿时,抓取堆栈信息,然后在客户端做一些过滤处理,便可以上报到服务器,通过收集一定量的卡顿数据后经过分析便能准确定位需要优化的逻辑.