pi-eco-indicator
Display upcoming Octopus Agile prices, or carbon intensity from National Grid on the Pimoroni Blinkt! display or the Pimoroni Inky pHAT display for Raspberry Pi, with no external dependencies - data is fetched directly from public APIs and stored locally. Designed to be simple to set up and use for people with no coding knowledge. Other displays may be supported in the future.
Should you wish to purchase a preconfigured device, I have an Etsy shop here.
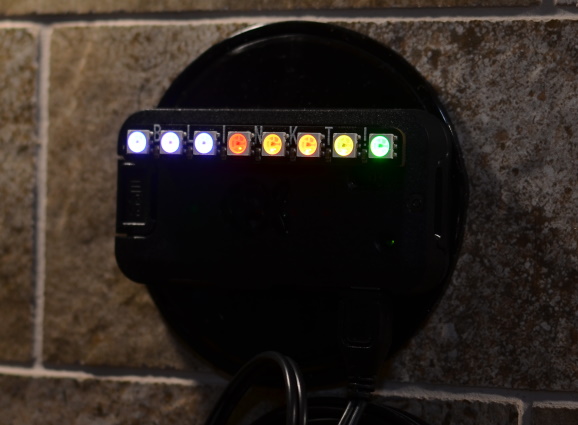
Here's the Blinkt! display (in Agile mode for this example, but it reads the same both ways.). Read it from left to right. Each pixel represents between 1 and 12 half-hour slots (configurable), so you get from 4 to 48 hours of data depending on how you configure it! The leftmost pixel represents the current value. On the half hour, every half hour, the data is updated - the best way to think of this is that it all shifts half an hour to the left!
Magenta is the most expensive or most carbon intensive, then red, orange, yellow, green, cyan, and blue. You can change the thresholds and colours easily by editing a configuration file (config.yaml).
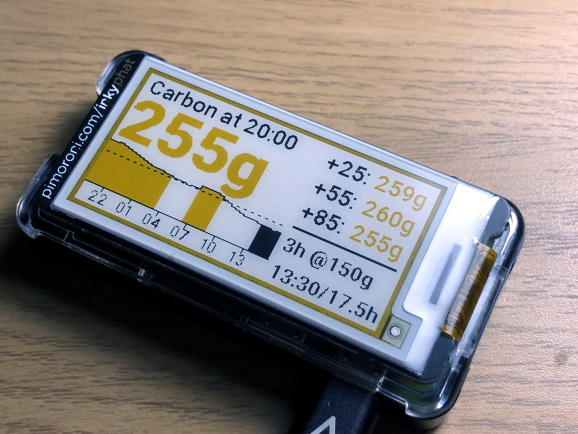
The Inky display looks like this in carbon mode, and very similar in Agile mode. On the right hand side are the values for the next three slots. Then, the bottom right corner shows the time at which the 3 hours (the duration of this is configurable) with the lowest price or carbon intensity occur, and the length of time until those slots begin. The graph is yellow/red when the value is above the configured "High Value" - the current value and border also change colour at or above this value. The black parts of the graph correspond to the low value slots shown in the bottom right. The dashed line is the average for the data being displayed, and the x-axis labels are the hour portion of the 24 hour time.
Hardware needed
- Pimoroni Blinkt!, or a Pimoroni Inky pHAT.
- A Raspberry Pi of any flavour, as long as you can connect the display to it, and it can connect to the internet. This software has been tested on a Pi Zero W and a Pi 3B+.
Software needed
- This has been tested on Raspberry Pi OS Buster and Bullseye, 32-bit only.
- Establish network access and enable SSH on the device.
- You will need the Pimoroni Blinkt! Python library, or the Pimoroni Inky Python library.
- Install the appropriate library like so, making sure you answer YES to the questions.
curl https://get.pimoroni.com/blinkt | bash
or
curl https://get.pimoroni.com/inky | bash
You can do both if desired! You will also need to install some other dependencies:
sudo apt install -y python3-yaml
sudo apt install -y python3-tzlocal
pip3 install font-roboto
How to get this code
Once you have installed the Pimoroni software as above, the easiest way to download this software is to copy and paste the following command, which will make a copy of all the files in a folder called pi-eco-indicator in your home directory. This won't work unless you've installed the Blinkt! library above (or installed git yourself).
cd ~ && git -c advice.detachedHead=false clone --depth 1 -b v2.2.0 https://github.com/jerbzz/pi-eco-indicator.git
How to use this code
This code runs unprivileged - no sudo required. It will drop a SQLite database file in its own directory when it runs.
The settings for the software are stored in config.yaml. This is provided as config.yaml.default so you will first need to make a copy:
cp config.yaml.default config.yaml
Open config.yaml:
cd ~\pi-eco-indicator
nano config.yaml
and look for DNORegion: Z at the very top. Replace this with your correct DNO region code from the list, or leave it as Z if you are looking for national carbon intensity values. (Note: I'm not a big fan of the regional carbon intensity data, I don't think it makes much sense, so I would encourage using national carbon data.) Exit nano by typing Ctrl-W then Ctrl-X.
You should initially run manually to check everything works
./store_data.py
The code will tell you what it's doing and whether it worked. You can run this as many times as you like without causing too many problems.
Then, a separate command to update the display:
./update_display.py
This will also tell you what it's doing. If you want to show a display of dummy data you can run:
./update_display.py --demo
If it's all a bit much, you can blank the display:
./clear_display.py
Running automatically
I really can't be bothered to make a systemd timer/service for this. cron is so much easier!
I've included a script to install the cron jobs listed below. Run it like this:
./install_crontab.sh
You can check it's worked by running crontab -l, you should see something like this (for carbon mode, Agile mode is a little different):
@reboot /bin/sleep 30; /usr/bin/python3 /home/pi/pi-eco-indicator/store_data.py > /home/pi/pi-eco-indicator/eco_indicator.log 2>&1
@reboot /bin/sleep 40; /usr/bin/python3 /home/pi/pi-eco-indicator/update_display.py > /home/pi/pi-eco-indicator/eco_indicator.log 2>&1
*/30 * * * * /bin/sleep 26; /usr/bin/python3 /home/pi/pi-eco-indicator/store_data.py > /home/pi/pi-eco-indicator/eco_indicator.log 2>&1
*/30 * * * * /bin/sleep 36; /usr/bin/python3 /home/pi/pi-eco-indicator/update_display.py > /home/pi/pi-eco-indicator/eco_indicator.log 2>&1
- line 1: wait 30 seconds at startup, get new data
- line 2: wait a further 10 seconds at startup and update the display
- line 3: wait till a random number of seconds past every half hour and get latest carbon data
- line 4: wait a further 10 seconds and update the display
Troubleshooting
If something isn't working, run
less ~/pi-eco-indicator/eco_indicator.log
This will show you the most recent message from any of the scripts (that were run automatically by cron). If this doesn't shed any light, run ./store_data.py and ./update_display.py and see what they moan about!
Modification
If you want to change price/carbon intensity thresholds, change mode, or fine-tune the colours, they are located in config.yaml. Open it using nano config.yaml or your favourite editor.
It's really important that you don't change the layout of the file otherwise you will encounter errors when trying to run the software. Each option has comments describing its effects - read, and change to your heart's content.
You can also create multiple config files, or store the config file in a different location, use the -c or --conf flag on the command line.
To Do:
See GitHub issues
Thanks to:
Garry Hayne on the Octopus Agile forums (https://forum.octopus.energy) for the original idea
pufferfish-tech's octopus-agile-pi-prices for inspiration (https://github.com/pufferfish-tech/octopus-agile-pi-prices)