keen / Pingpong
Labels


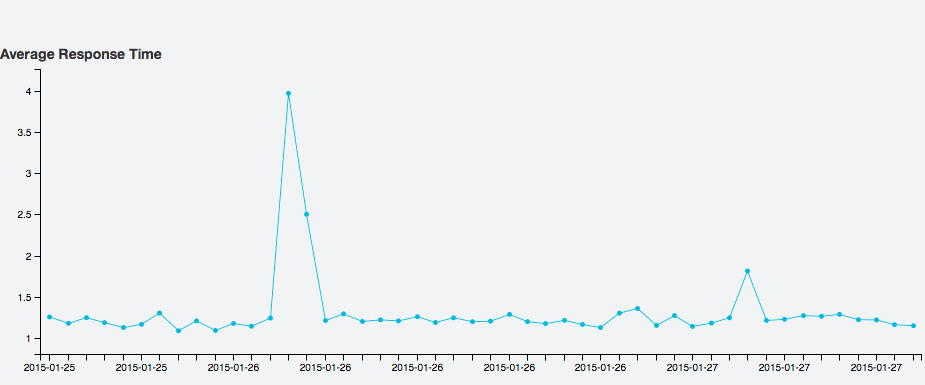
Get deeper HTTP request response analytics every second.
Track real-time performance and availability across multiple API servers to see the what, when, and how behind your system performance. So you can understand why.
How does it work?
- Pingpong sends HTTP requests to URLs you configure as frequently as once per second. It turns data about each request and response into JSON, then logs it to a custom destination.
- Your default data store is Keen IO’s analytics API to capture events, run queries, and create visualizations. But it’s simple to set up another backend.
- Pingpong ships with Dashboards, an HTML visualization kit that lets you see and arrange your most critical response data. Built on the Keen IO analytics API, Dashboards is super-flexible and ready to be skinned, tweaked, and embedded anywhere.
- Pingpong captures most of the data you'd want about HTTP requests and responses. To beef up or slim down your data stream, adding custom properties specific to your infrastructure is simple.
Choose your own install adventure.
Deploy straight to Heroku: Pingpong is easy to install and ready for deployment to one or more Heroku regions. You can even deploy the app with a single click with this handy button:
A note on event limits: If you're using the Keen IO backend to store events, you can send 50,000 events for free per month. As a reference, one check running every minute will create about 43,000 events in a month. Check out more plans to get more events. We'd also love to give you a discount if you're using Pingpong, just [email us](mailto:[email protected]?subject=Pingpong Events) your project ID and we'll get you hooked up.
Setup and deploy your own Pingpong app: Don't run Heroku? That's cool. You can run Pingpong on any host with Ruby, even your local machine. Either way, it's up and running in less than five minutes. Just see the next section.
Setup & Deployment
Pingpong is open source and easy to install. Pingpong is written in Ruby and streamlined for deployment to one or more Heroku regions. That said, you can run it on any host with Ruby, including your local machine.
Step 1: Clone or fork this repository:
$ git clone [email protected]:keen/pingpong.git
$ cd pingpong
Step 2: Install dependencies
$ bundle install
If you don't have the bundle command, first gem install bundler.
Step 3: Set up database tables
$ bundle exec rake db:create
$ bundle exec rake db:migrate
The project uses Postgres as the default database, but you can modify that in the database.yml file.
Step 4: Set up the environment variables
Keen IO Setup
You'll need to sign up for a free Keen IO account. Once your account is set up, create a new project.
You'll need to grab the project id, read key, and write key. Add these to a root level file called .env. There's a .env.sample setup with all the variables, so just run:
$ cp .env.sample .env
And edit your Keen IO variables:
KEEN_PROJECT_ID=xxxxxxxxxxxxxxx
KEEN_READ_KEY=yyyyyyyyyyyyyyyyy
KEEN_WRITE_KEY=zzzzzzzzzzzzzzzz
SendGrid Setup
If you want to send emails, you'll have to sign up for a free SendGrid account.
Once you've done that, edit the following in your .env file:
[email protected]
[email protected]
SKIP_EMAIL=false
SENDGRID_USERNAME=asdfasdfasdf
SENDGRID_PASSWORD=12345
Slack Setup
To get notifications in Slack, you'll have to provide us with your Incoming Webhook URL. You can create an Incoming Webhook here.
Once you've got the Webhook URL, update your .env file:
SLACK_WEBHOOK_URL=https://hooks.slack.com/services/XXXXXXXXXXXXXXX/YYYYYYYYYYY
There are also some optional configurations you can edit for Slack notifications:
SLACK_CHANNEL='#alerts' # The channel to send notifications to
SLACK_USERNAME='Robot' # The username the notification will come from - defaults to Pingpong
SLACK_ICON=':rotating_light' # The icon of the user "sending" the notification. Can be a URL or an Emoji
WARN_COLOR='#CCCCCC' # Hex color value used for the warning messages - defaults to #E2E541
BAD_COLOR='#000000' # Hex color value used for the failure messages - defaults to #F25656
Run the Server
Now you're ready to start the web server locally using foreman, which will pick up the variables in the .env file. foreman comes with the Heroku toolbelt.
$ foreman start
The Pingpong web interface should now be running on localhost:5000. Click on the button to create a new check, and then within a few minutes, you'll see the check data populating the charts.
Check Properties
Every check requires the following properties:
- name: for display in charts and reports
- url: the fully qualified resource to check
- frequency: how often to sent the request, in minutes
Additionally, checks have some optional properties:
- method: GET, POST, or DELETE (defaults to GET)
- http_username: Username for HTTP authentication
- http_password: Password for HTTP authentication
Checks can also have any number of custom properties, which is very useful for grouping & drill-down analysis later. Place any custom properties in the custom field.
HTTP Request & Response as an Event
Each time a check is run, a JSON object describing the check, request, and response is logged via a CheckLogger component, defaulting to KeenCheckLogger. Here's an example event payload:
{
  "check": {
    "name": "Keen IO Web",
    "url": "https://keen.io",
    "frequency": 5,
    "custom": {
      "server_role": "https",
      "is_https": true
    }
  },
  "environment": {
    "rack_env": "production",
    "region": "heroku_us_east",
    "location": "Virginia, US"
  },
  "request": {
    "sent_at": "2013-10-12T00:00:00.000Z",
    "duration": 0.432
  },
  "response": {
    "successful": true,
    "timed_out": false,
    "status": 200,
    "server": "TornadoServer/3.1",
    "http_status": 200,
    "http_reason": "OK",
    "http_version": "1.1",
    "content_type": "text/html",
    "content_length": 175,
    "date": "Wed, 16 Apr 2014 17:39:01 GMT"
  }
}
Here's a breakdown of the major sections:
- check: properties describing the check, including any custom properties
- environment: properties describing where the check was made from (useful when you are running Pingpong instances across multiple datacenters)
- request: information about the HTTP request that was sent
- response: information about the HTTP response that was recorded
response.timed_out and response.successful are helper properties. response.successful is true if the request did not timeout and the response
status is between 100 and 399.
It's easy to add more fields to the environment section in config.yml, or implement a CheckMarshaller component that translates HTTP response fields to properties in a different way.
Capturing all of these fields makes it possible to perform powerful grouping and filtering during analysis.
Reporting and Alerting
Pingpong uses Pushpop to provide basic alerting and reporting functionality. This functionality can easily be extended to create your own custom alerts and reports.
Additional Options & Recipes
Configuration
See config.yml for an idea of what can be configured with settings. Examples include timeouts, pluggable components, and environment properties.
Save a URL's JSON Response Body
If a configured check returns JSON, you can save that JSON into the request body. This allows you to monitor and analyze not only the success or failure of web calls, but also the values they can return.
To save the body, select true when creating a new check.
This example grabs the weather from the Forecast.io API as JSON. The weather data will be merged into the response body under the key response.body. Here's an example check response event (some fields omitted for clarity):
{
  "response": {
    "body": {
      "latitude": 37.8267,
      "longitude": -122.423,
      "timezone": "America/Los_Angeles",
      "currently": {
        "temperature": 56.78,
        "summary": "Overcast",
        "icon": "cloudy"
      }
    }
  }
}
Now you can visualize temperature over time by using response.body.currently.temperature as the target property for analysis!
Note: The Content-Type header of the check's response must contain application/json for it to be saved. Otherwise a warning will be logged.
Note #2: To avoid hitting Keen IO limits on the number of properties per event and per collection across all events, JSON response bodies should ideally be small and/or consistent.
Pluggability
Each major component of Pingpong is pluggable:
- Checks get run by a pushpop job in
jobs/run_checks_job.rb -
CheckMarshaller: transforms a check and its result into the JSON payload to be logged. The efault implementation isEnvironmentAwareCheckMarshaller. -
CheckLogger: logs the JSON payload from theCheckMarshaller. The default implementation isKeenCheckLogger.
Once you've written an implementation for any of these components, simply replace the previous implementation's class name in config.yml with name of your component.
HTTP Authentication
Set the HTTP_USERNAME and HTTP_PASSWORD environment variables to enable HTTP authentication for the dashboard. Off by default.
Custom Headers
Set the headers property of a check to a hash of headers you'd like included with the request. For example:
{
  "checks": [
    {
      "name": "JSON API Check",
      "url": "http://example.com/api",
      "frequency": 5,
      "headers": { "Accept": "application/json" },
      "method": "GET"
    }
  ]
}
Inspiration
Pingpong was developed in-house at Keen IO to answer a few simple, but important, questions about our web and API infrastructure:
- Are any API servers or server processes slower than others?
- Are any web pages or API calls slow? Are any experiencing errors?
- Have any processes failed, or become unresponsive? Today? This month?
- What's the latency to each DC from a client in the US? In Europe?
- How much latency does using SSL add?
Pingpong runs all day, every day from multiple data centers around the world, helping our team understand current performance and study long-term trends. To date, Pingpong has run more than 20 million checks in production.
Helpful Links
Contributing
Contributions are very welcome. Here are some ideas for new features:
Wish List
- More tabs and queries and visualizations on the dashboard
- More default alerts
- Deploy instructions for multiple platforms
- Ability to merge multiple data centers into one set of graphs
- Support for more back-ends and front-ends
Support for HTTP POST
Pingpong has a full set of specs. Before submitting your pull request, make sure to run them:
$ bundle exec rake spec
Contributors
- Josh Dzielak - @dzello
- Justin Johnson - @elof
- Micah Wolfe - @micahwolfe
- Cory Watson - @gphat
- Loren Siebert - @lorensiebert
- Alex Kleissner - @hex337
- Mariano Vallés - @zucaritask
If you contribute, add your name to this list!