promcr
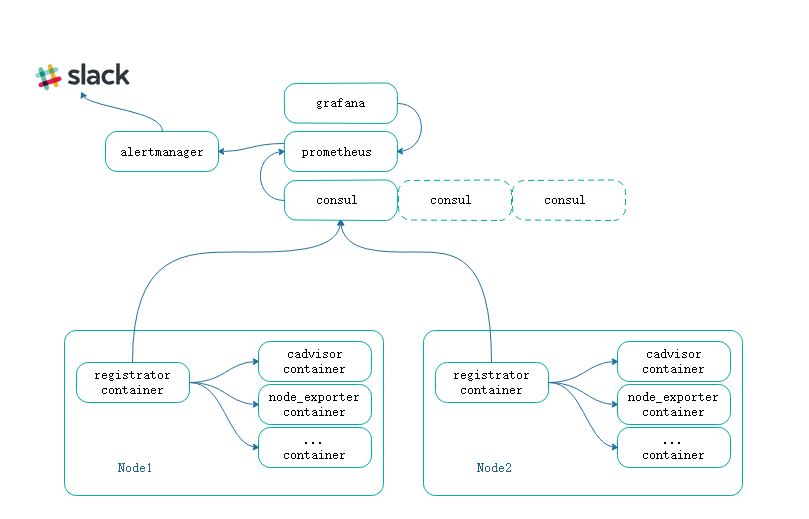
promcr组合了prometheus consul registrator,为了使用起来可以快速部署,使用compose将他们编排在一起使用
registrator作为node主机上的容器,用于发现容器,而后注入到consul中
prometheus利用consul插件发现registrator注入的容器,这其中可以根据不同的标签进行分组等,大致如下图:
版本说明
| Version | type | User ID | port |
|---|---|---|---|
| 5.4.1 | grafana | 472 | 3000 |
| v0.15.3 | alertmanager | 9093/9094 | |
| v2.5.0 | prometheus | 665534 | 9090 |
| v0.16.0 | node_exporter | 9100 | |
| v0.32.0 | cadvisor | 18880 | |
| 1.4.0 | consul | 8500 | |
| marksugar/registrator:v7.1 | registrator | ||
| 2.0.1-luminous | ceph_exporter | 9128 | |
| 3.3.10 | etcd | 2379 | |
| 0.3.1 | Telegram-alarm | 8080 | |
| none | slack-alarm | none |
使用说明
git clone https://github.com/marksugar/pcr.git && cd pcr
即将启动前你需要创建目录并且授权,这么做是为了避免容器内的属主权限问题。
分别是prometheus是数据目录和grafana的使用目录
mkdir -p $(pwd)/{data,grafana_data,grafana}
chown 65534:65534 $(pwd)/data
chown 472.472 $(pwd)/grafana_data/
docker-compose -f ./docker-compose.yaml up -d
node节点部署
我们将模板下载到本地
crul -LK https://raw.githubusercontent.com/marksugar/pcr/master/node_template/docker-compose.yaml -o /opt/docker-compose.yaml
在每个容器中添加标签便于区分,如果是compose,可以使用如下方式:
    labels:
      SERVICE_TAGS: ddt-linuxea.com
而后远程推送,如ansible
ansible pt-api -m copy -a "src=/opt/docker-compose-NAME.yaml dest=/opt/docker-compose.yaml"
可以在本地编写脚本start.sh,在远程节点执行
#!/bin/bash
iptables -I INPUT 5 -s IPADDR -p tcp -m tcp -m state --state NEW -m multiport --dports 18880,9100,9128 -j ACCEPT
sed -i '/-A INPUT -j REJECT/i\\-A INPUT -p tcp -m tcp -m state --state NEW -m multiport --dports 18880,9100,9128 -m comment --comment "prometheus" -j ACCEPT' /etc/sysconfig/iptables
docker-compose -f /opt/docker-compose.yaml up -d
ansible HOST_GROUP -m script -a "/opt/start.sh"
registrator须知
在registrator镜像中,marksugar/registrator:v7.1是我自己基于gliderlabs/registrator:v7封装
FROM gliderlabs/registrator:v7
LABEL master="www.linuxea.com"
COPY entrypoint.sh /bin/entrypoint.sh
ENTRYPOINT ["entrypoint.sh"]
附加了一个脚本来获取ip地址,以及传递一些参数
#!/bin/sh
# maintainer="linuxea.com"
NDIP=`ip a s ${NETWORK_DEVIDE:-eth0}|awk '/inet/{print $2}'|sed -r 's/\/[0-9]{1,}//')`
/bin/registrator -ip="${NDIP}" ${ND_CMD:--internal=false} consul://${NDIPSERVER_IP:-consul}:8500
exec "$@"
所以,要运行至少需要三个变量
    - NETWORK_DEVIDE=eth0 :网卡名称
    - NDIPSERVER_IP=CONSUL_SERVER :CONSUL服务ip
    - ND_CMD=-internal=false -retry-interval=30 -resync=180 #其他参数
-retry-interval=30会在三分钟后自动重新联系CONSUL_SERVER
prometheus须知
镜像是prom/prometheus:v2.5.0,数据存储45天,配置文件映射到/etc/prometheus/prometheus.yml
      - '--config.file=/etc/prometheus/prometheus.yml'
      - '--storage.tsdb.path=/prometheus'
      - '--storage.tsdb.retention=45d'
      - '--web.console.libraries=/etc/prometheus/console_libraries'
      - '--web.console.templates=/etc/prometheus/consoles'
      - '--web.enable-lifecycle'
so , 如果你想顺利的使用,你必须将此处修改和labels一样 你需要修改配置文件,如下:
        - source_labels: ['__meta_consul_tags']
          regex:         ',(prometheus|app),'
          target_label:  'group'
          replacement:   '$1'
假如我们使用上面填写的是 ddt-linuxea.com,这里也要添加归为一个组 ,如下
regex: ',(prometheus|NAME|ddt-linuxea.com),'
意思是说,如果匹配到携带有ddt-linuxea.com标签的容器将会归为一个group。此后我们对每个group做区分,划分
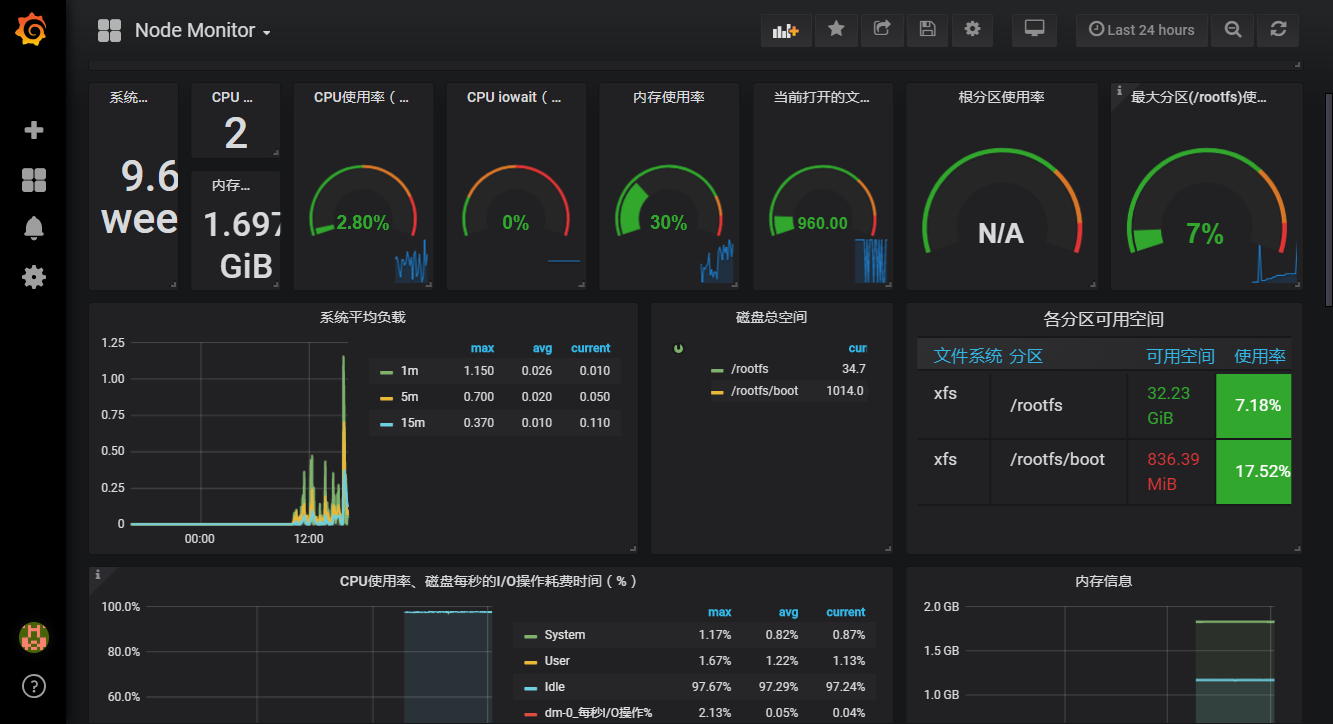
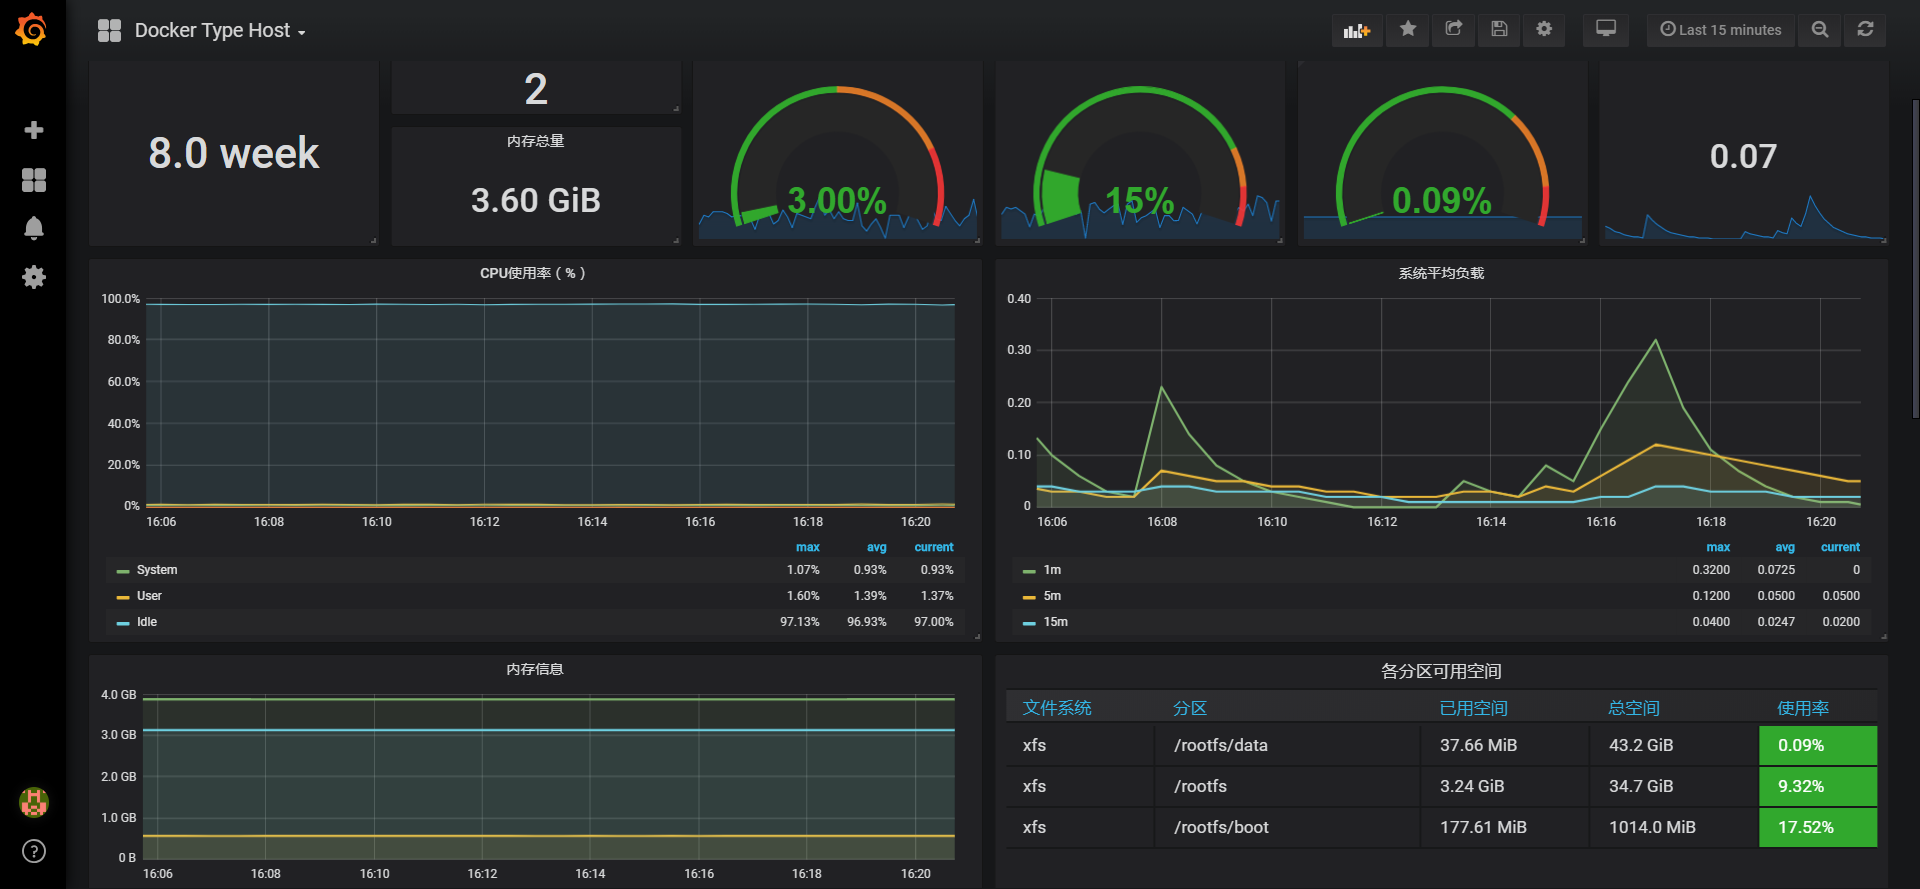
grafana须知
      - GF_SECURITY_ADMIN_USER=${ADMIN_USER:-admin}
      - GF_SECURITY_ADMIN_PASSWORD=${ADMIN_PASSWORD:-admin}
      - GF_USERS_ALLOW_SIGN_UP=false
最终展示如下:
alert_rules
主机存活阈值
groups:
- name: targets
rules:
- alert: monitor_service_down
expr: up == 0
for: 30s
labels:
severity: critical
annotations:
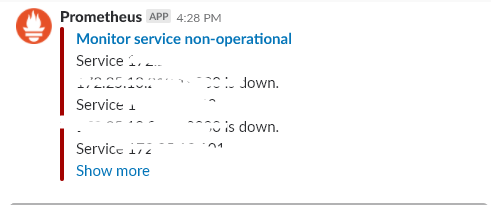
summary: "Monitor service non-operational"
description: "Service {{ $labels.instance }} is down."
CPU阈值
- name: host
  rules:
  - alert: high_cpu_load
    expr: node_load1 > 1.5
    for: 30s
    labels:
      severity: warning
    annotations:
      summary: "Server under high load"
      description: "Docker host is under high load, the avg load 1m is at {{ $value}}. Reported by instance {{ $labels.instance }} of job {{ $labels.job }}."
内存阈值
  - alert: high_memory_load
    expr: (sum(node_memory_MemTotal_bytes) - sum(node_memory_MemFree_bytes + node_memory_Buffers_bytes + node_memory_Cached_bytes) ) / sum(node_memory_MemTotal_bytes) * 100 > 85
    for: 30s
    labels:
      severity: warning
    annotations:
      summary: "Server memory is almost full"
      description: "Docker host memory usage is {{ humanize $value}}%. Reported by instance {{ $labels.instance }} of job {{ $labels.job }}."
磁盘阈值
  - alert: high_storage_load
    expr: (node_filesystem_size_bytes{fstype="aufs"} - node_filesystem_free_bytes{fstype="aufs"}) / node_filesystem_size_bytes{fstype="aufs"}  * 100 > 85
    for: 30s
    labels:
      severity: warning
    annotations:
      summary: "Server storage is almost full"
      description: "Docker host storage usage is {{ humanize $value}}%. Reported by instance {{ $labels.instance }} of job {{ $labels.job }}."
alertmanager
slack
这里有两个模板可以用,差别并不大
- tepl
{{ define "slack.my.title" -}}
    {{- if .CommonAnnotations.summary -}}
        {{- .CommonAnnotations.summary -}}
    {{- else -}}
        {{- with index .Alerts 0 -}}
            {{- .Annotations.summary -}}
        {{- end -}}
    {{- end -}}
{{- end }}
{{ define "slack.my.text" -}}
    {{- if .CommonAnnotations.description -}}
        {{- .CommonAnnotations.description -}}
    {{- else -}}
        {{- range $i, $alert := .Alerts }}
            {{- "\n" -}} {{- .Annotations.description -}}
        {{- end -}}
    {{- end -}}
{{- end }}
{{- range $i, $alert := .Alerts -}}
    {{- if lt $i 10 -}}
        {{- "\n" -}} {{- index $alert.Annotations "description" -}}
    {{- end -}}
{{- end -}}
config.yml
global:
  slack_api_url: 'https://hooks.slack.com/services/<ID>'
route:
    receiver: 'slack'
#    group_by: [alertname,]
receivers:
- name: 'slack'
  slack_configs:
  - send_resolved: true
    username: 'Prometheus'
    channel: '# < SLACK >'
    icon_url: https://avatars3.githubusercontent.com/u/3380462
    title: '{{ template "slack.my.title" . }}'
    text: '{{ template "slack.my.text" . }}'
templates:
- 'my.tepl'
Telegram
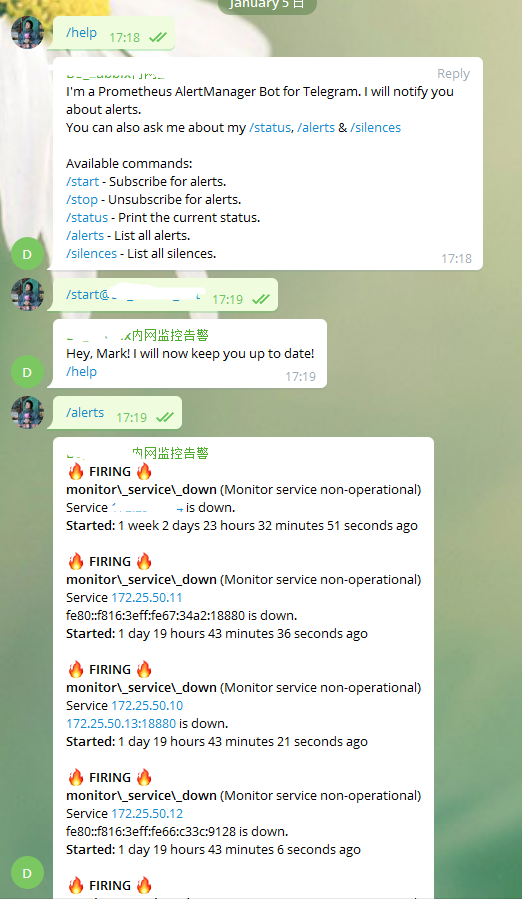
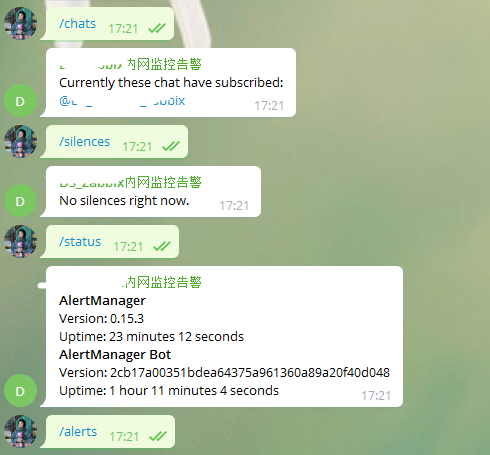
Telegram使用的是alertmanager-bot,经过测试,非常好用,可以通过输入指令查看告警,并且可以手动关闭
- compose如下:
version: '2.2'
services:
  alertmanager-bot:
    container_name: alertmanager-bot
    image: metalmatze/alertmanager-bot:0.3.1
    network_mode: host
    environment:
      ALERTMANAGER_URL: http://0.0.0.0:9093
      BOLT_PATH: /data/bot.db
      STORE: bolt
      TELEGRAM_ADMIN: 'telegram id号码'  # @userinfobot 获取
      TELEGRAM_TOKEN: # @BotFather 获取
      TEMPLATE_PATHS: /templates/default.tmpl
      LISTEN_ADDR: 0.0.0.0:8080
    volumes:
    - /srv/monitoring/alertmanager-bot:/data
配置文件也要修改
route:
    receiver: 'telegram'
receivers:
- name: 'telegram'
  webhook_configs:
  - send_resolved: true
    url: 'http://0.0.0.0:8080'
资源限制
如果你使用的是swarm集群,你可以使用粒度更小跟详细的限制,如下:
    deploy:
      resources:
        limits:
          cpus: '0.15'
          memory: 50M
        reservations:
          cpus: '0.15'
          memory: 20M
如果你不是集群,而是单独的compose,你可以使用两条配置参数,如下:
    cpus: '0.15'
    mem_limit: 50M
每个容器的日志也做了限制,这个限制仅仅是对容器输出有效
    logging:
      driver: "json-file"
      options:
        max-size: "200M"
并且在compose的主配置中修改了资源限制cpu_shares比例
    cpu_shares: 14
    mem_limit: 50m
application
etcd
如果你和我一样,使用的etcd是k8s集群之外的,你可以使用promcr\grafana_dashboarb\etcd\etcd-external-cn.json
- 你必须设置一个标签来完成etcd仪表盘里面的群组,这样的方式在多etcd集群中是有用的。如下:
      labels:
        group: 'etcd'
如果你是集群内的,并且你的标签并不是group,你或许需要修改环境变量来获取值。不过,我准备了俩个仪表盘,没有包含labels group,位于promcr\grafana_dashboarb\etcd\Etcd-for-k8s-cn.json
如果你是tls的,记得将证书携带到prometheus中,这里的示例仅仅是k8s集群外的prometheus示例(我并不建议使用自动发现来做):
  - job_name: 'etcd'
    metrics_path: /metrics
    scheme: https
    tls_config:
      cert_file: 'ssl/server.pem'
      key_file: 'ssl/server-key.pem'
      insecure_skip_verify: true
    static_configs:
    - targets:
      - '172.25.50.16:2379'
      - '172.25.50.17:2379'
      - '172.25.50.18:2379'
      labels:
        group: 'etcd'
如何得知你的证书是有效的?使用如下命令尝试:
curl -Lk --cert ./server.pem --key ./server-key.pem https://IPADDR:2379/metrics
如果一些正常,你会看到如下,我为你做了一些备注(当然是翻译了^_^)!
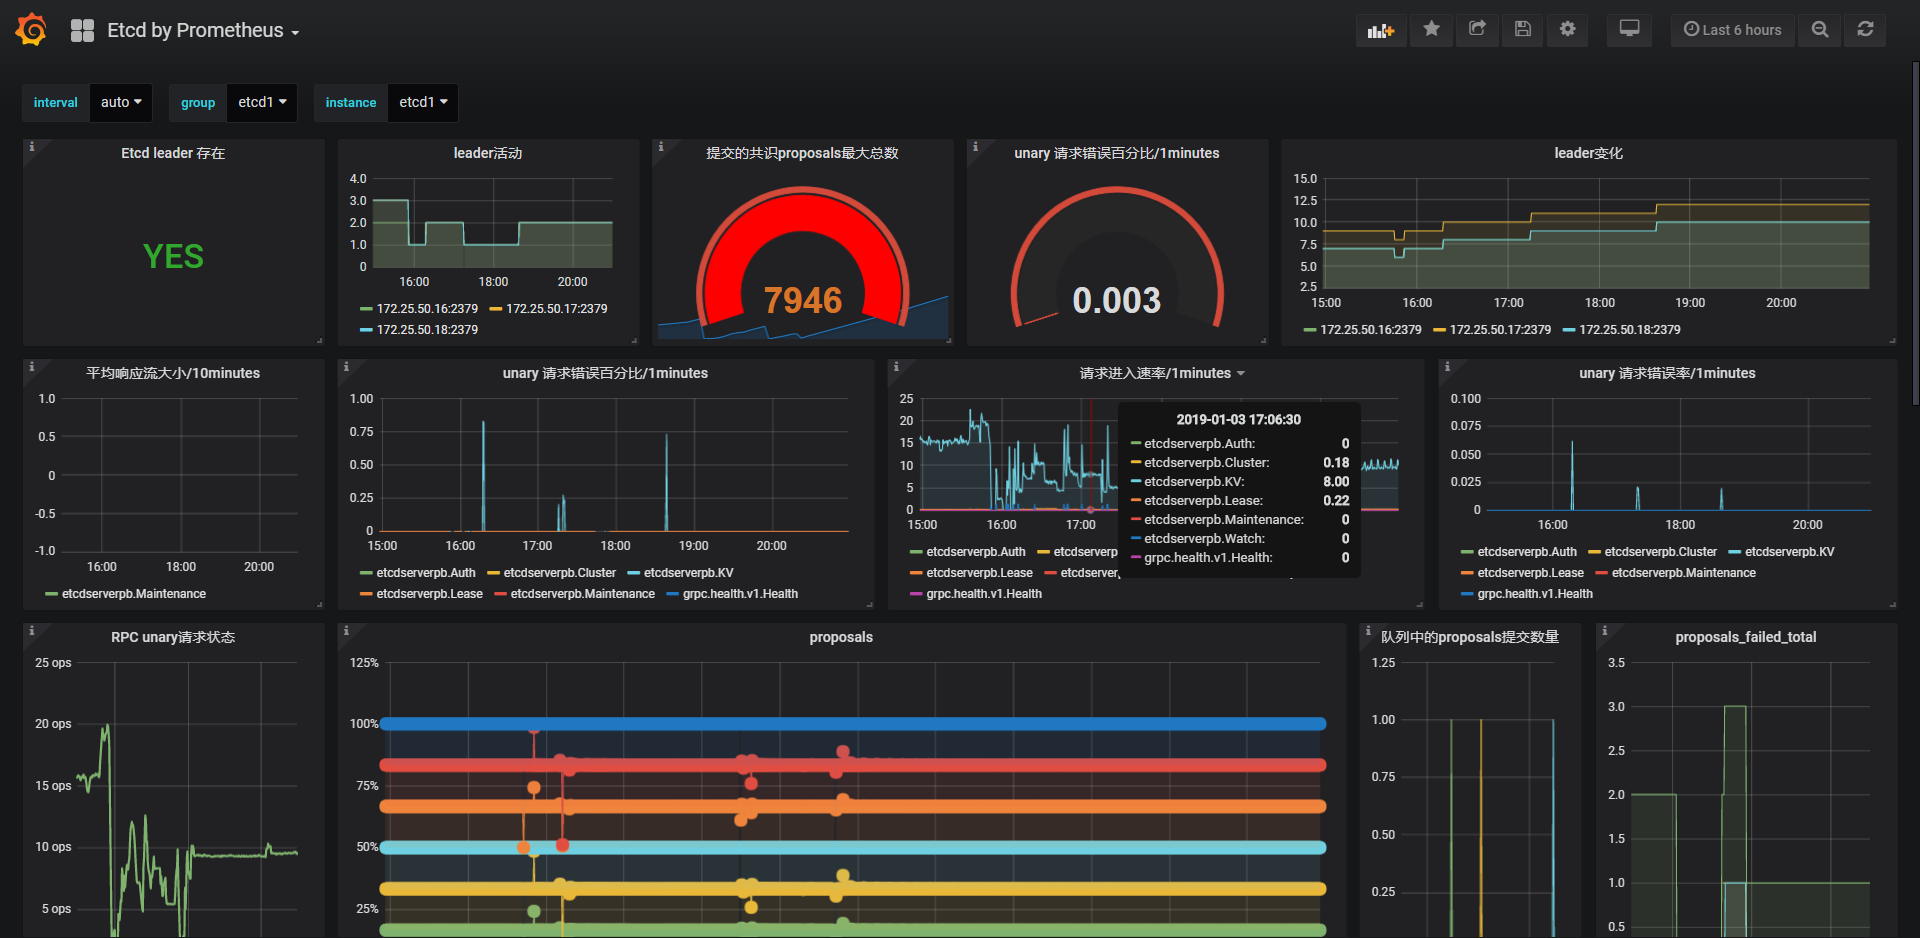 grafana上的仪表盘共享:
https://grafana.com/dashboards/9593
https://grafana.com/dashboards/9594
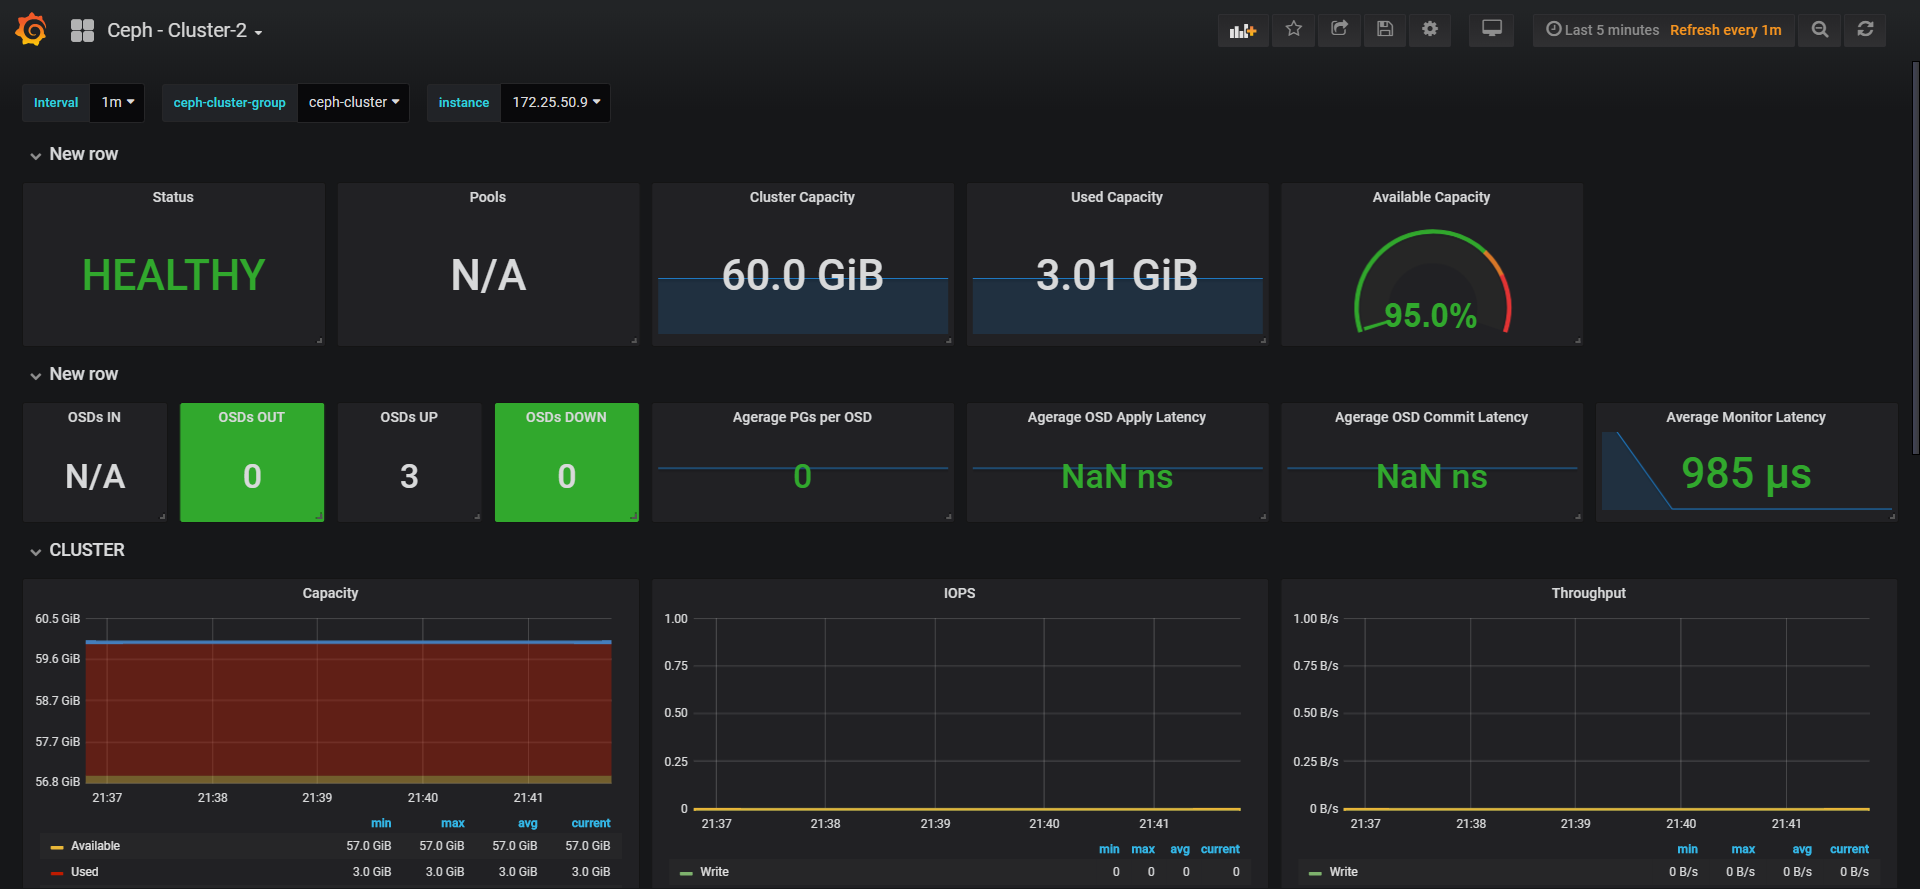
ceph
ceph的发现规则如下:
  - job_name: 'ceph_exporter'
    metrics_path: /metrics
    scheme: http
    consul_sd_configs:
      - server: 127.0.0.1:8500
        services: ['ceph_exporter']
    relabel_configs:
        - source_labels: ['__meta_consul_service']
          regex:         '(.*)'
          target_label:  'job'
          replacement:   '$1'
        - source_labels: ['__meta_consul_service_address']
          regex:         '(.*)'
          target_label:  'instance'
          replacement:   '$1'
        - source_labels: ['__meta_consul_service_address', '__meta_consul_service_port']
          regex:         '(.*);(.*)'
          target_label:  '__address__'
          replacement:   '$1:$2'

        - source_labels: ['__meta_consul_tags']
          regex:         ',(ceph-cluster|cephfs),'
          target_label:  'group'
          replacement:   '$1'
如果__meta_consul_tags等于ceph-cluster就被归为一个组,而后在仪表盘中,我修改了变量,可以将同一个group组合一起。这个仪表盘来自共享
已知问题
在自动发现中,有的机器已经失效,且consul不存在,但是在prometheus中仍然存在,并且送达警告。 可以通过curl进行删除
curl -X "DELETE" "http://127.0.0.1:9090/api/v1/series?match[]={job="your job"}"
curl -X POST -g 'http://localhost:9090/api/v1/admin/tsdb/delete_series?match[]={instance="172.25.50.10"}'
curl -X POST 127.0.0.1:9090/api/v1/admin/tsdb/delete_series?match[]={instance="172.25.50.10"}
curl -X POST -g 'http://localhost:9090/api/v1/admin/tsdb/delete_series?match[]={job="ceph_exporter"}'
curl -X POST -g 'http://localhost:9090/api/v1/admin/tsdb/delete_series?match[]={instance="192.168.0.1:9100"}'