stsievert / Python Drawnow
Programming Languages
Labels
drawnow for matplotlib
The scientific community often runs iterative code, often in the form of
simulation. It's often useful to see the results after each iteration.
Accordingly, MATLAB® has a nice feature that allows you to update the
figure, drawnow. This repo brings the same feature to Python's
matplotlib, with some extras.
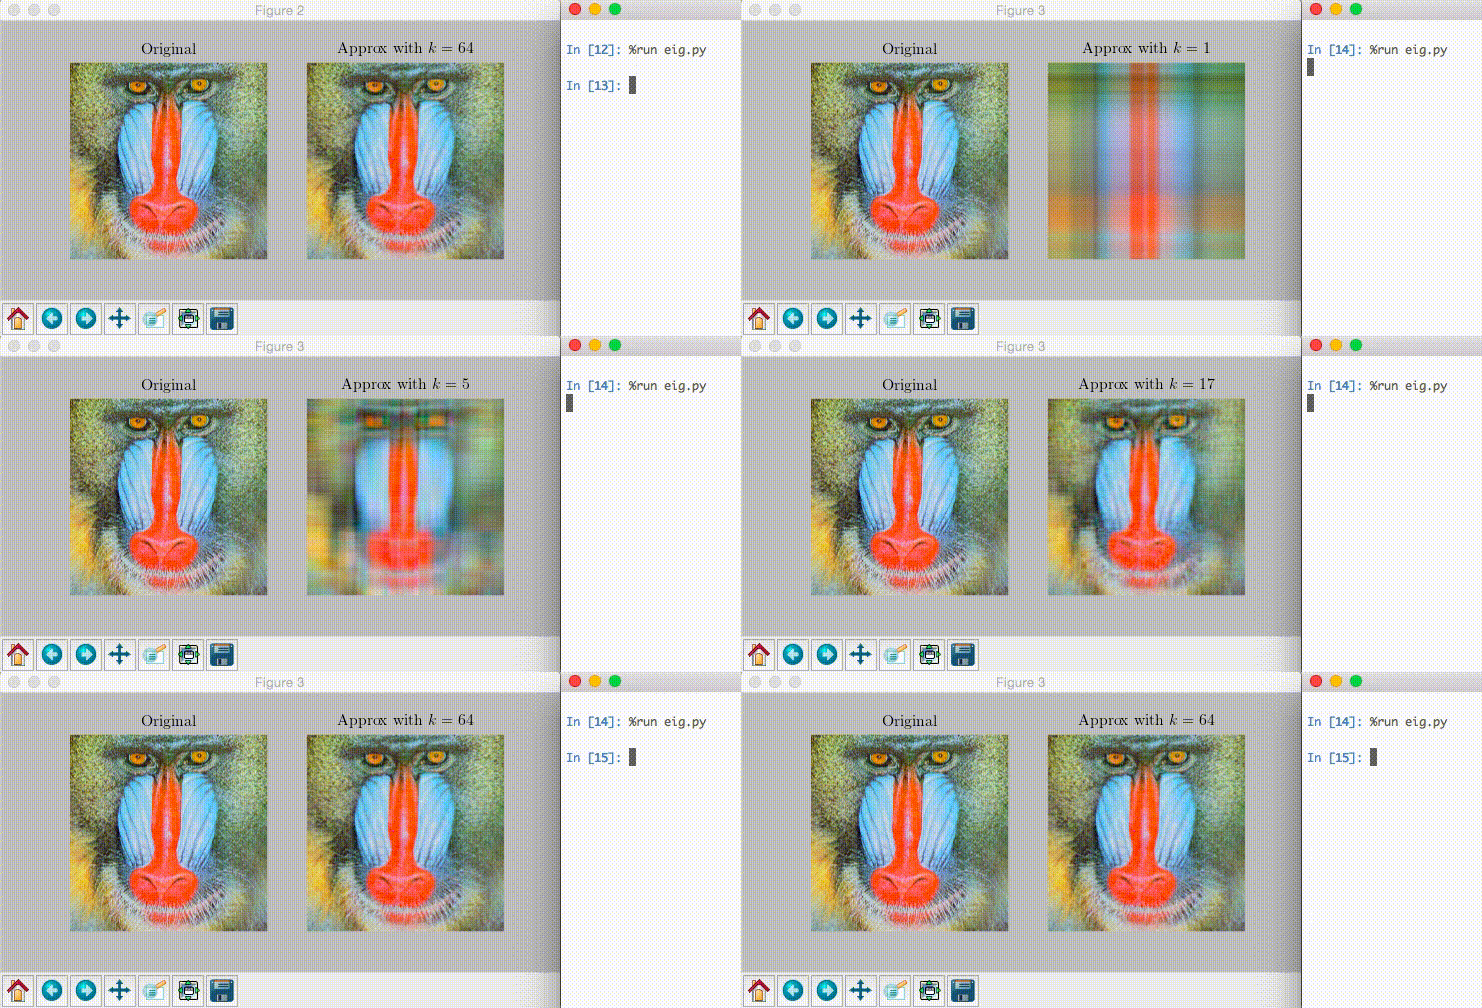
Example:
This is shown with imshow, but python-drawnow allows updates of any
figure.
Usage:
# complete implementation of script found in test/test.py
from pylab import *
from drawnow import drawnow, figure
# if global namespace, import plt.figure before drawnow.figure

def approx(x, k):
    """Approximate x with k singular values"""
    ...

figure(figsize=(7, 7/2))
def draw_fig():
    subplot(1, 2, 1)
    imshow(x)

    subplot(1, 2, 2)
    imshow(x_hat)
    #show()

x = imread('test-data/mandrill.png').mean(axis=2)
k_values = around(logspace(0, 2, num=10))
for k in k_values:
    x_hat = approx(x, k)
    drawnow(draw_fig)
Documentation
If you want to wait for confirmation after update or the option to drop
into a debugger, call drawnow(function_to_draw_figure, confirm=True).
If you only want to show the figure once, call
drawnow(function_to_draw_figure, show_once=True). The full
documentation is included in the doc strings. Use drawnow? or
help(drawnow) to see these docs.
Jupyter/Spyder
Try running the folloowing code in a Jupyter input cell/in the console/etc:
%matplotlib
This will disable the Matplotlin inline mode and use the default plotting backend. For more detail, see the IPython plotting documentation.
Installation
Two options:
- Run
pip install drawnow. - Download this repository and run
python setup.py install.
Option 2 assumes a working Python installation with pip. I suggest
Anaconda's distribution: https://www.anaconda.com/distribution/ For
other options, see https://realpython.com/installing-python/.
Changes to code
This does require small changes to your code. All it should really
amount to is moving figure(); plot(...); show() inside a function; not
much.

