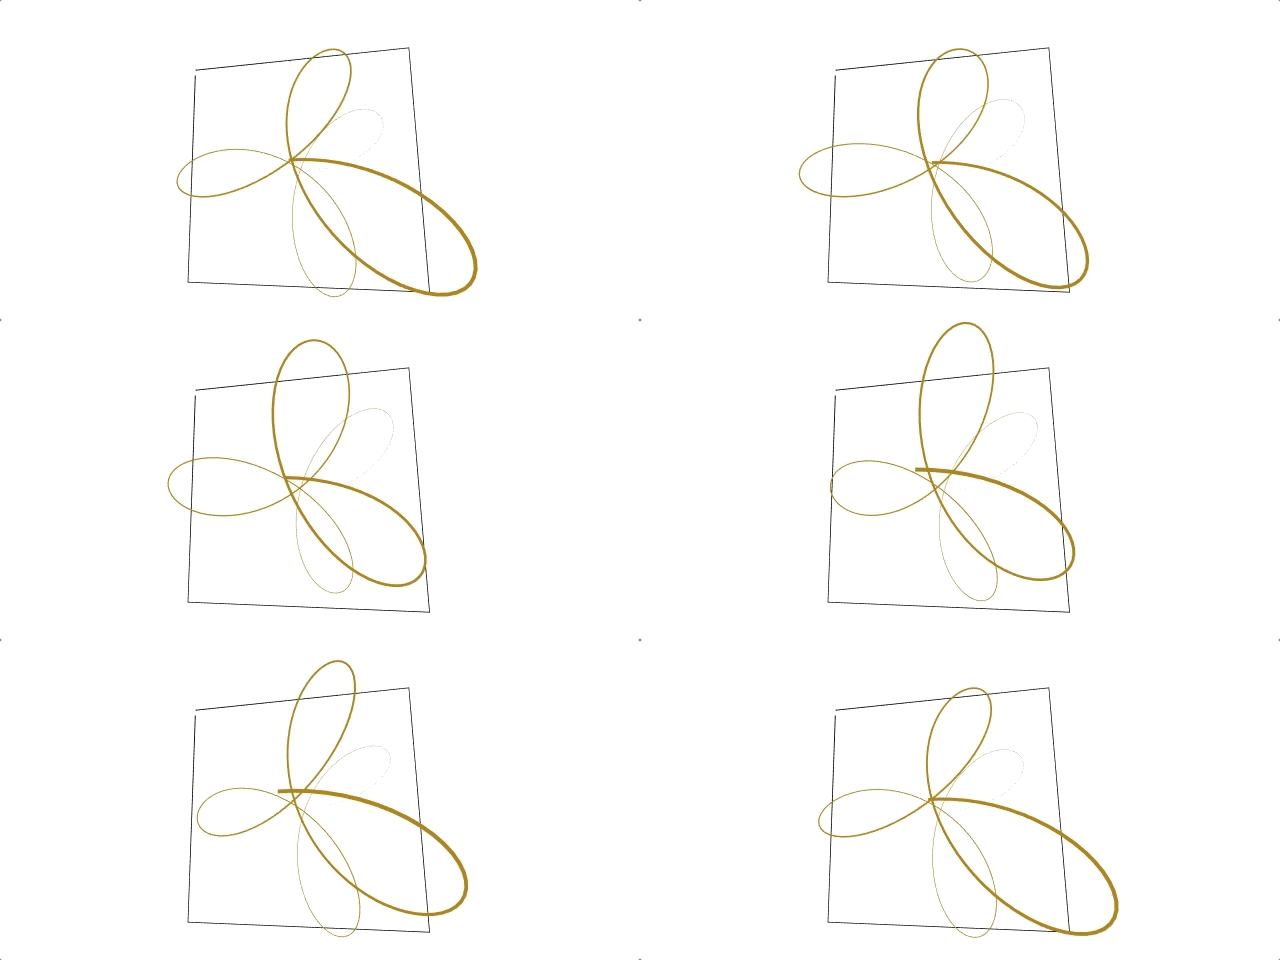
Regl Line
A regl function to conveniently draw flat 2D and 3D lines.
Click here to see
This small library is inspired by Regl's line example and Matt Deslauriers' wonderful blog post on drawing lines in WebGL.
Install
npm -i regl-line
Getting started
import createRegl from 'regl';
import createCamera from 'canvas-orbit-camera';
import createLine from 'regl-line';

// Setup the canvas
const canvas = document.getElementById('canvas');
const { width, height } = canvas.getBoundingClientRect();
canvas.width = width * resize.scale;
canvas.height = height * resize.scale;

// Setup Regl
const regl = createRegl(canvas);
const camera = createCamera(canvas);

// Create a line
const line = createLine(regl, {
  width: 2,
  color: [0.8, 0.2, 0.0, 1.0],
  is2d: true,
  // Flat list of normalized-device coordinates
  points: [-0.9, +0.9, +0.9, +0.9, +0.9, -0.9, -0.9, -0.9, -0.9, +0.85],
});

// Draw
regl.frame(() => {
  regl.clear({ color: [0, 0, 0, 1], depth: 1 });
  camera.tick();
  line.draw({ view: camera.view() });
});
For a complete example, see example/index.js.
Draw Multiple Lines At Once
To draw multiple lines, you can pass a list of lists of flat point coordinates to setPoints() or the constructor.
line.setPoints([
  [-0.8, +0.9, +0.8, +0.9], // top line
  [+0.9, +0.8, +0.9, -0.8], // right line
  [+0.8, -0.9, -0.8, -0.9], // bottom line
  [-0.9, -0.8, -0.9, +0.8], // left line
]);
Variable Line Color
To give each line an individual color, you have to do 2 things. First, you have to specify all the colors you plan to use.
line.setStyle({
  color: [
    [0, 1, 1, 1], // cyan
    [1, 1, 0, 1], // yellow
  ],
});
Next, when you set the points (with setPoints()), specify an array of indices to associate lines with your previously specified colors.
line.setPoints(points, {
  colorIndices: [
    0, //    top line will be cyan
    1, //  right line will be yellow
    0, // bottom line will be cyan
    1, //   left line will be yellow
  ],
});
Color Gradient
You could even go one step further and specify the color for each point on the line using a list of list of indices.
line.setPoints(points, {
  colorIndices: [
    [0, 0, 1, 1], //    top line will have a cyan to yellow gradient
    [1, 1, 0, 0], //  right line will have a yellow to cyan gradient
    [0, 1, 0, 1], // bottom line will have a cyan, yellow, cyan, yellow gradient
    [0, 1, 1, 0], //   left line will have a cyan, yellow, cyan gradient
  ],
});
Variable Line Opacity
To adjust, you can adjust the line width using
line.setPoints(points, {
  opacities: [
    0.25, //    top line will have an opacity of 0.25
    0.5, //  right line will have an opacity of 0.5
    0.75, // bottom line will have an opacity of 0.75
    1.0, //   left line will have an opacity of 1.0
  ],
});
Similar to color gradient, you can also specify the opacity for each point on the line using a list of list of numbers.
Variable Line Width
To adjust, you can adjust the line width using
line.setPoints(points, {
  widths: [
    1, //    top line will have a width of 1
    2, //  right line will have a width of 2
    3, // bottom line will have a width of 3
    4, //   left line will have a width of 4
  ],
});
Similar to color gradient, you can also specify the width for each point on the line using a list of list of numbers.
API
Constructor
# createLine(regl, options = {})
Create a line instance.
Args:
regl[regl]: Regl instance to be used for drawing the line.options[object]: An object with the following props to customize the line creator.projection[mat4]: projection matrix (Defaut: identity matrix)model[mat4]: model matrix (Defaut: identity matrix)view[mat4]: view matrix (Defaut: identity matrix)points[array]: flat list of normalized-device coordinates alternating x,y ifis2distrueor x,y,z. (Defaut:[]). To draw multiple lines at once, pass in a list of lists of coordinates.widths[array]: flat array of point-wise widths, i.e., the line width at every point. (Defaut:[])color[array]: a quadruple of floats (RGBA) ranging in [0,1] defining the color of the line. (Defaut:[0.8, 0.5, 0, 1])width[number]: uniform line width scalar. This number sets the base line width. (Defaut:1)miter[boolean]: iftrueline segments are miter joined. (Defaut:true)is2d[boolean]: iftruepoints are expected to have only x,y coordinates otherwise x,y,z coordinates are expected. (Defaut:false)zPos2d[number]: ifis2distruethis value defines the uniform z coordinate. (Defaut:0)
Returns: line instance.
Methods
# line.clear()
Clears all of the data to remove the drawn line.
# line.destroy()
Destroys all related objects to free memory.
# line.draw({ projection, model, view })
Draws the line according to the projection, model, and view matrices.
Args:
1 options [object]:
projection[mat4]: projection matrix (Defaut: identity matrix)model[mat4]: model matrix (Defaut: identity matrix)view[mat4]: view matrix (Defaut: identity matrix)
# line.getBuffer()
Get a reference to the point, width, and color index buffer objects. This can be useful for efficient animations.
Returns: { points, widths, colorIndices }
# line.getData()
Get a reference to the buffers' typed data arrays.
Returns: { points, widths, colorIndices }
# line.getPoints()
Get the original list of points defining the line.
Return: flat array of points
# line.getStyle()
Get all the style settings.
Returns: { color, miter, width }
# line.setPoints(points, widths, is2d)
Set points defining the line, the point-wise widths, and change the dimensionality.
Args:
points[array]: flat list of normalized-device coordinates alternating x,y ifis2distrueor x,y,z. To draw multiple lines at once, pass in a list of lists of coordinates.widths[array]: flat array of point-wise widths, i.e., the line width at every point.is2d[boolean]: iftruepoints are expected to have only x,y coordinates otherwise x,y,z coordinates are expected.
# line.setStyle({ color, miter, width })
Args:
option[object]:color[array]: a quadruple of floats (RGBA) ranging in [0,1] defining the color of the line.width[number]: uniform line width scalar. This number sets the base line width.miter[boolean]: iftrueline segments are miter joined.


