Replephant 

A Clojure library to perform interactive analysis of Hadoop cluster usage via REPL and to generate usage reports.
Table of Contents
- Quick Start
- Motivation
- Features
- Requirements
- Installation
- Usage
- API
- How it works
- Data structures
- FAQ
- Known problems and limitations
- Roadmap
- Change log
- Contributing to Replephant
- License
Quick Start
This section is an appetizer of what you can do with Replephant. Do not worry if something is not immediately obvious to you -- the following sections will describe Replephant in full detail.
First, clone the Replephant repository and start the Clojure REPL. You must have lein (leiningen) already installed;
if you do not the sections below will explain you how to do that.
$ git clone https://github.com/miguno/replephant.git
$ cd replephant
$ lein repl

# once the REPL is loaded the prompt will change to:
replephant.core=>
Then you can begin analyzing the usage of your own cluster:
; The root directory is usually the one defined by Hadoop's
; mapred.job.tracker.history.completed.location and/or
; hadoop.job.history.location settings
(def jobs (load-jobs "/local/path/to/hadoop/job-history-root-dir"))

; How many jobs are in the log data?
(count jobs)
=> 12

; Show me all the users who ran one or more jobs in the cluster
(distinct (map :user.name jobs))
=> ("miguno", "alice", "bob", "daniel", "carl", "jim")

; Consumption of computation resources: which Hadoop users
; account for most of the tasks launched?
(println (utils/sort-by-value-desc (tasks-by-user jobs)))
=> {"miguno" 2329, "alice" 2208, "carl" 1440, "daniel" 19, "bob" 2, "jim" 2}
Alright, that was a quick start! The next sections cover Replephant in-depth.
Motivation
Understanding how an Hadoop cluster is actually used in practice is paramount to properly manage and operate it. This includes knowing cluster usage across the following dimensions:
- Which users account for most of the resource consumption in the cluster (impacts e.g. capacity planning, budgeting and billing in multi-tenant environments, cluster configuration settings such as scheduler pool/queue settings).
- Which analysis tools such as Pig or Hive are preferred by the users (impacts e.g. cluster roadmap, trainings, providing custom helper libraries and UDFs).
- Which data sets account for most of the analyses being performed (impacts e.g. prolonging or canceling data subscriptions, data archiving and aging, HDFS replication settings).
- Which MapReduce jobs consume most of the resources in the cluster and for how long (impacts e.g. how the jobs are coded and configured, when and where they are launched; also allows your Ops team to point and shake fingers).
Replephant was created to answer those important questions by inspecting production Hadoop logs (here: so-called Hadoop job configuration and job history files) and allowing you to derive relevant statistics from the data. Notably, it enables you to leverage Clojure's REPL to interactively perform such analyses. You can even create visualizations and plots from Replephant's usage reports by drawing upon the data viz magics of tools such as R and Incanter (see FAQ section).
Apart from its original goals Replephant has also proven to be useful in cluster/job troubleshooting and debugging. Because Replephant is lightweight and easy to install operations teams can conveniently run Replephant in production environments if needed.
Related work
The following projects are similar to Replephant:
- hadoop-job-analyzer -- analyzes Hadoop jobs, aggregates the information according to user specified crosssections, and sends the output to a metrics backend for visualization and analysis (e.g. Graphite). Its analysis is based on parsing Hadoop's job log files just like Replephant does.
If you are interested in more sophisticated cluster usage analysis you may want to take a look at:
- White Elephant (by LinkedIn) is an open source Hadoop log aggregator and dashboard which enables visualization of Hadoop cluster utilization across users and over time.
- hRaven (by Twitter) collects run time data and statistics from MapReduce jobs running on Hadoop clusters and stores the collected job history in an easily queryable format. A nice feature of hRaven is that it can group related MapReduce jobs together that are spawned from a single higher-level analysis job such as Pig (e.g. Pig jobs usually manifests themselves in several chained MapReduce jobs). A current drawback of hRaven is that it only supports Cloudera CDH3 up to CDH3u4 -- CDH3u5, Hadoop 1.x and Hadoop 2.x are not supported yet.
- Commercial offerings such as Cloudera Manager (Enterprise Core), Hortonworks Management Center or MapR M5 include cluster usage reporting features.
Features
Replephant's main value proposition is to read and parse Hadoop's raw log files and turn them into ready-to-use Clojure data structures -- because as is often the case for such a data analysis preparing and loading the original raw data is the hardest part.
On top of this ETL functionality Replephant also includes a set
of basic usage reports such as (tasks-by-user jobs) and convenient filter predicates such as pig?, which are
described in section Usage below. But even more interesting is the fact that you can use the Clojure REPL
including all of Clojure's own powerful features to interactively drill down into the job data yourself.
Requirements
- Java JDK/JRE >= 6
- Leiningen version 2 -- either install manually or use your favorite package manager such as HomeBrew for Macs
- Tested with Hadoop 1.0+ and Hadoop 0.20.203+ -- feel free to report back which other versions work with Replephant
That's it!
Installation
Apart from meeting Replephant's Requirements you only need to clone this git repository.
# Option 1: using HTTPS for data transfer
$ git clone https://github.com/miguno/replephant.git

# Option 2: using SSH for data transfer (requires GitHub user account)
$ git clone [email protected]:miguno/replephant.git
Note: This step requires a working Internet connection and appropriate firewall settings, which you may or may not have in a production environment.
Usage
Start the Clojure REPL first:
$ lein repl

# once the REPL is loaded the prompt will change to:
replephant.core=>
Note: When you start the REPL for the very first time (or basically, run any lein command) all dependencies of
Replephant will be downloaded from their respective Maven repositories and stored in your
user's $HOME/.m2/ directory. This download step requires a working Internet connection and appropriate firewall
settings, which you may or may not have in a production environment. After the first startup you do not need Internet
connectivity anymore as long as you do not want to update the Replephant software; e.g. you can then copy the
Replephant directory plus your $HOME/.m2/ directory to the cluster's NameNode and run it there even if the
NameNode cannot access the Internet. In the future we may improve the packaging of Replephant.
Once the REPL is running you can play around with the library and create your first usage reports. Enter the following commands into the REPL:
; The root directory is usually the one defined by Hadoop's mapred.job.tracker.history.completed.location and/or
; hadoop.job.history.location settings
(def jobs (load-jobs "/local/path/to/hadoop/job-history-root-dir"))

; How many jobs are in the log data?
(count jobs)
=> 12

; What data fields are available in a job record?
;
; Note that (sort ...) turns the map data structure of a job record into a sequence.
; Clojure's pprint is used for pretty-printing the output.
(clojure.pprint/pprint (sort (first jobs)))
=> ([:data-local-maps 0]
    [:dfs.access.time.precision 3600000]
    [:dfs.balance.bandwidthPerSec 10485760]
    [:dfs.block.access.key.update.interval 600]
    [:dfs.block.access.token.enable false]
    ...)

; Show me all the users who ran one or more jobs in the cluster
(distinct (map :user.name jobs))
=> ("miguno", "alice", "bob", "daniel", "carl", "jim")

; Consumption of computation resources: which Hadoop users account for most of the tasks launched?
(println (utils/sort-by-value-desc (tasks-by-user jobs)))
=> {"miguno" 2329, "alice" 2208, "carl" 1440, "daniel" 19, "bob" 2, "jim" 2}

; Consumption of computation resources: which Hadoop users account for most of the jobs launched?
(println (utils/sort-by-value-desc (jobs-by-user jobs)))
=> {"daniel" 3, "alice" 3, "carl" 2, "miguno" 2, "bob" 1, "jim" 1}

; Consumption of computation resources: which MapReduce tools account for most of the tasks launched?
(println (utils/sort-by-value-desc (tasks-by-tool jobs)))
=> {:hive 2329, :other 1440, :streaming 1778, :mahout 432, :pig 21}

; Consumption of computation resources: which MapReduce tools account for most of the jobs launched?
(println (utils/sort-by-value-desc (jobs-by-tool jobs)))
=> {:pig 4, :other 2, :mahout 2, :streaming 2, :hive 2}

; Consumption of computation resources: which data sets account for most of the tasks launched?
; (data sets are defined in a simple associative data structure; see section "Data sets" below)
(def data-sets {"Twitter Firehose data" #"^/twitter/firehose/?", "Facebook Social Graph" #"^/facebook/social-graph/?"})
(println (utils/sort-by-value-desc (tasks-by-data-set jobs data-sets)))
=> {"Facebook Social Graph data" 2329, "UNKNOWN DATA SET" 1872, "Twitter Firehose data" 1799}

; Find jobs that violate data locality -- those are candidates for optimization and tuning.
;
; The example below is pretty basic.  It retrieves all jobs that have 1+ rack-local tasks,
; i.e. tasks where data needs to be transferred over the network (but at least they are from
; the same rack).
; A slightly improved version would also include jobs were data was retrieved from OTHER racks
; during a map tasks, which in pseudo-code is (- all-maps rack-local-maps data-local-maps).
;
(def optimization-candidates (filter #(> (:rack-local-maps % 0) 0) jobs))

; Restrict your analysis to a specific subset of all jobs according to one or more predicates
(def hive-jobs (filter hive? jobs))
(def jobs-with-compressed-output (filter compressed-output? jobs))
(def failed-jobs (filter failed? jobs))
; Detect write-only jobs and jobs for which Replephant cannot yet extract input data information.
(def jobs-with-missing-input (filter missing-input-data? jobs))
; Helpful to complete your data set definitions
(def jobs-with-unknown-input (filter (partial unknown-input-data? data-sets) jobs))
API
Here is a short overview of the most important API functions.
ETL (Loading job logs)
(load-jobs "/local/path/to/hadoop/job-history-root-dir")-- the meat-and-potatoes of Replephant
Predicates
distcp?hive?pig?mahout?streaming?successful?failed?compressed-output?missing-input-data?unknown-input-data?
Analysis and reports
- Focused on Hadoop users:
(tasks-by-user jobs)and(jobs-by-user jobs) - Focused on MapReduce tools:
(tasks-by-tool jobs)and(jobs-by-tool jobs) - Focused on data sets:
(tasks-by-data-set jobs)
Display
(fingerprint job)-- extracts a short list of data fields from a job that should help you to identify the job
How it works
In a nutshell Replephant reads the data in Hadoop job configuration files and job history files into a "job" data structure, which can then be used for subsequent cluster usage analyses.
Background: Hadoop creates a pair of files for each MapReduce job that is executed in a cluster:
-
A job configuration file, which contains job-related data created at the time when the job was submitted to the cluster. For instance, the location of the job's input data is specified in this file via the parameter
mapred.input.dir.- Format: XML
- Example filename:
job_201206222102_0003_conf.xmlfor a job with IDjob_201206222102_0003
<?xml version="1.0" encoding="UTF-8" standalone="no"?><configuration>
<property><name>io.bytes.per.checksum</name><value>512</value></property>
<property><name>mapred.input.dir</name><value>hdfs://namenode/facebook/social-graph/2012/06/22/</value></property>
<property><name>mapred.job.name</name><value>Facebook Social Graph analysis</value></property>
<property><name>mapred.task.profile.reduces</name><value>0-2</value></property>
<property><name>mapred.reduce.tasks.speculative.execution</name><value>true</value></property>
...
</configuration>
-
An accompanying job history file, which captures run-time information on how the job was actually executed in the cluster. For instance, Hadoop stores a job's run-time counters such as
HDFS_BYTES_WRITTEN(a built-in counter of Hadoop, which as a side note is also shown in the JobTracker web UI when looking at running or completed jobs) as well as application-level custom counters (provided by user code).- Format: Custom plain-text encoded format for Hadoop 1.x and 0.20.x, described in JobHistory class
- Example filename:
job_201206222102_0003_1340394471252_miguno_Job2045189006031602801
Meta VERSION="1" .
Job JOBID="job_201206011051_137865" JOBNAME="Facebook Social Graph analysis" USER="miguno" SUBMIT_TIME="1367518567144" JOBCONF="hdfs://namenode/app/hadoop/staging/miguno/\.staging/job_201206011051_137865/job\.xml" VIEW_JOB=" " MODIFY_JOB=" " JOB_QUEUE="default" .
Job JOBID="job_201206011051_137865" JOB_PRIORITY="NORMAL" .
Job JOBID="job_201206011051_137865" LAUNCH_TIME="1367518571729" TOTAL_MAPS="2316" TOTAL_REDUCES="12" JOB_STATUS="PREP" .
Task TASKID="task_201206011051_137865_r_000013" TASK_TYPE="SETUP" START_TIME="1367518572156" SPLITS="" .
ReduceAttempt TASK_TYPE="SETUP" TASKID="task_201206011051_137865_r_000013" TASK_ATTEMPT_ID="attempt_201206011051_137865_r_000013_0" START_TIME="1367518575026" TRACKER_NAME="slave406:localhost/127\.0\.0\.1:56910" HTTP_PORT="50060" .
...
Depending on your Hadoop version and cluster configuration, Hadoop will store those files in directory trees rooted at
mapred.job.tracker.history.completed.location and/or hadoop.job.history.location.
Replephant uses standard XML parsing to read the job configuration files, and relies on the Hadoop 1.x Java API to parse
the job history files via DefaultJobHistoryParser. At the moment Replephant retrieves only such history data from
job history files that are related to job start, job finish or job failure (e.g. task attempt data is not retrieved).
For each job Replephant creates a single associative data structure that contains both the job configuration as well as
the job history data in a Clojure-friendly format (see section [Data structures](#Data structures) below for an example
data snippet). This job data structure forms the basis for all subsequent cluster usage analyses.
Data structures
Replephant's public API uses only two data structures:
- Jobs: The main data we are interested in for cluster usage analysis, parsed by Replephant from the raw Hadoop job logs.
- Data sets: Defined by the user, i.e. you!
Jobs
Jobs are modelled as associative data structures that map Hadoop job parameters as well as Hadoop job history data to their respective values. Both the keys in the data structure -- the names of job parameter and the name of data fields in the job history data, which together we just call fields -- as well as their values are derived straight from the Hadoop logs.
Replephant converts the keys of the data fields into Clojure keywords according to the following schema:
- Job parameters (from job configuration files) are directly converted into keywords. For instance,
mapred.input.dirbecomes:mapred.input.dir(note the leading colon, which denotes a Clojure keyword). - Job history data including job counters (from job history files) are lowercased and converted into Lisp-style keywords
For instance, the job counter
HDFS_BYTES_WRITTENbecomes:hdfs-bytes-writtenand a field such asJOB_PRIORITYbecomes:job-priority.
Basically, everything that looks like :words.with.dot.separators is normally a job parameter whereas anything else
is derived from job history data. The values of the various fields are, where possible, converted into the appropriate
Clojure data types (e.g. a value representing an integer will be correctly turned into an int, the strings "true"
and "false" are converted into their respective boolean values).
Here is a (shortened) example of a job data structure read from Hadoop log files:
{
 :dfs.access.time.precision 3600000,    ; <<< a job configuration data field
 :dfs.block.access.token.enable false,
 ; *** SNIP ***
 :hdfs-bytes-read 69815515804,          ; <<< a job history data field
 :hdfs-bytes-written 848734873,
 ; *** SNIP ***
 :io.sort.mb 200,
 :job-priority "NORMAL",
 :job-queue "default",
 :job-status "SUCCESS",
 :jobid "job_201206011051_137865",
 :jobname "Facebook Social Graph analysis",
 ; *** SNIP ***
 :user.name "miguno"
}
In addition to the data derived from Hadoop log files Replephant also adds some Clojure metadata
to each job data structure. At the moment only a :job-id field is available. This helps to identify problematic
job log files (e.g. those Replephant fails to parse) because at least Replephant will tell you the job id, which you
can then use to find the respective raw log files on disk.
(def job ...) ;
(meta job)
=> {:job-id "job_201206011051_137865"}
Note that even though this metadata follows the same naming conventions as the actual job data it is still metadata and
as such you must access it via (meta ...). Accessing the job data structure directly -- without meta -- only
provides you with the log-derived data.
Data sets
You only need to define data sets if you use any of Replephant's data set related functions such as
tasks-by-data-sets. Otherwise you can safely omit this step.
Data sets are used to describe the, well, data sets that are stored in an Hadoop cluster. They allow you to define, for example, that the Twitter Firehose data is stored in this particular location in the cluster. Replephant can then leverage this information to perform usage analysis related to these data sets; for instance, to answer questions such as "How many Hadoop jobs were launched against the Twitter Firehose data in our cluster?".
Thanks to Clojure's homoiconicity it is very straight-forward to define
data sets so that Replephant can understand which jobs read which data in your Hadoop cluster. You only need to create
an associative data structure that maps the name of the data set to a regex pattern that is matched against a job's
input directories (more correctly, input URIs) as configured via mapred.input.dir and mapred.input.dir.mappers.
You then pass this data structure to the appropriate Replephant function.
Important note: In order to simplify data set definitions Replephant will automatically extract the path component
of input URIs, i.e. it will remove scheme and authority information from mapred.input.dir and
mapred.input.dir.mappers values. This means you should write regexes that match against strings such as
/path/to/foo/ instead of hdfs:///path/to/foo/ or hdfs://namenode.your.datacenter/path/to/foo/.
(def data-sets
  {
   ; Will match e.g. "hdfs://namenode/twitter/firehose/*", "/twitter/firehose" and "/twitter/firehose/*"; see note above
   "Twitter Firehose data" #"^/twitter/firehose/?"
   })
Replephant uses native Clojure regex patterns, which means you have the full power of java.util.regex.Pattern at your disposal.
How Replephant matches job input with data set definitions:
Replephant will consider a MapReduce job to be reading a given data set if ANY of the job's input URIs match the
respective regex of the data set. In Hadoop the values of mapred.input.dir and mapred.input.dir.mappers maybe
be a single URI or a comma-separated list of URIs; in the latter case Replephant will automatically explode the
comma-separated string into a Clojure collection of individual URIs so that you don't have to write complicated regexes
to handle multiple input URIs in your own code (the regex is matched against the individual URIs, one at a time).
Analyzing multiple cluster environments:
If you are running, say, a production cluster and a test cluster that host different data sets (or at different locations),
it is convenient to create separate data set definitions such as (def production-data-sets { ... }) and
(def test-data-sets { ... }).
See data_sets.clj for further information and for an example definition of multiple data sets.
FAQ
Why is it called Replephant?
Replephant is a portmanteau of REPL and "elephant", which is the mascot and logo of Apache Hadoop. Another source of inspiration was LinkedIn's (much more sophisticated) cluster usage analysis tool White Elephant.
Why is Replephant written in Clojure?
Of course Replephant could have been written in Java, Python or whatever other language may come to your mind. For me, the main reason was that I started reading up on Clojure a few weeks back and needed a good excuse to actually implement something with the language. The use case of Replephant seemed to be a perfect fit as most of it comes down to manipulations of associative data structures -- the job configuration and job history files. I learned to my positive surprise that implementing Replephant with Clojure was simpler, shorter and more readable (and also more fun) than, say, an equivalent Java version would have been. At the same time using Clojure means that Replephant is a JVM-based tool with all the goodness that comes with it. In particular Clojure's Java interop allowed me to leverage the existing Hadoop (Java) API where needed.
Why are not all data fields from job history files available in job data structures?
The reason is to keep the total memory footprint at manageable levels, notably when analyzing a lot of jobs interactively. But if you feel there is an important data field missing just create a feature request.
Do I always need both job configuration and job history files in pairs?
No, you don't. Replephant works with the following setups:
- Only a job configuration file (XML) exists for a job. This is ok but implies that Replephant may not be able to provide you with all job-related data you might be interested in because Hadoop stores some data only in the job history files.
- Both a job configuration file as well as an accompanying job history file exists for a job.
Replephant does not handle jobs for which only a job history file is available.
Why is Replephant not able to read Hadoop 2.x log files?
Hadoop 2.x log files are not supported yet but on the roadmap.
Hadoop 2.x (e.g. as used in Cloudera CDH4) writes job history files in a different format, which are Avro data files instead of the previous custom plain-text encoded format in Hadoop 1.x/0.20.x. See Events.avpr for the Avro protocol definition and EventWriter, which writes the actual job history events in the respective Avro format. Note that the new format is actually much easier to parse and work with thanks to Avro, hence adding support for Hadoop 2.x is not far away.
Can I read Hadoop log files straight from HDFS?
No, this is not supported yet. At the moment the job configuration files and job history files must be stored on the local filesystem (or copied there from HDFS).
How can I define data sets to match wildcards in mapred.input.dir and mapred.input.dir.mappers values?
Wildcards in mapred.input.dir and mapred.input.dir.mappers values are not handled transparently by Replephant.
That is, Replephant itself does not treat wildcards like * in input URIs such as /tmp/foo/* in any special way.
If, for instance, a data set is defined as having the regex #"^/tmp/foo/bar" it will NOT match the
mapred.input.dir value /tmp/foo/*. If you need such functionality you must write the data set regex
appropriately.
Can Replephant analyze what's running and going on in my cluster right now?
No, it can't. Replephant relies on completed Hadoop log files, which means it can only analyze and work with data of past cluster activities. If you are interested in a live analysis of what's going on in an Hadoop cluster you should take a look at the available Hadoop-related monitoring tools.
Why doesn't Replephant store the loaded job data into e.g. a Hive table, which would let you use existing Hadoop tools for the usage analysis?
This feature might indeed be implemented in the future. That said, we feel that the flexibility and agility of Clojure for working with job data (as long as we are not talking GBs of data, e.g. when doing trend analysis over long periods of time) beats the currently available functionality of Pig, Hive & Co. Your mileage may vary though, and we'd certainly welcome any code contributions to implement this feature sooner than later!
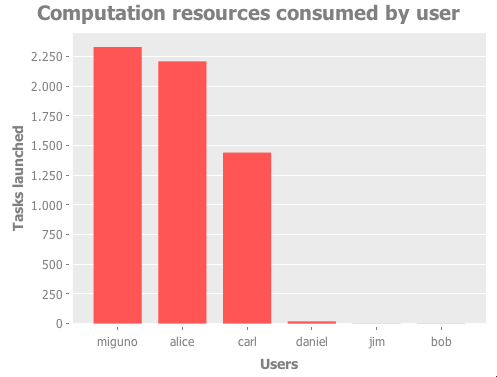
How can I visualize the usage reports of Replephant?
Replehant itself does not implement any native visualization features. However you can leverage all the existing data visualization tools such as R or Incanter (the latter is basically a clone of R written in Clojure).
For your convenience Incanter has been added as a dependency of Replephant, which is a fancy way of saying that you can
use Incanter from Replephant's REPL right out of the box. Here is an example Incanter visualization of cluster usage
reported by tasks-by-user:
;; Create a bar chart using Incanter
(def jobs (load-jobs ...))
(def u->t (utils/sort-by-value-desc (tasks-by-user jobs)))
(use '(incanter core charts))
(view (bar-chart
       (keys u->t)
       (vals u->t)
       :title "Computation resources consumed by user"
       :x-label "Users"
       :y-label "Tasks launched"))
Note: This specific example requires a window system such as X11. In other words it will not work in a text terminal.
This produces the following chart:
How can I run the unit tests of Replephant?
Instead of running lein test you should run:
$ lein midje
Known problems and limitations
- Replephant may crash when analyzing a lot of Hadoop log files: When analyzing logs for more than 20k+ jobs (empirical number based on internal testing) Replephant may run into JVM garbage collection problems. I have not had the time yet to debug this problem, but it is most likely caused by a) having not enough RAM to hold all the parsed job data in your computer's memory and/or b) my beginner Clojure skills. :-)
Roadmap
-
1.0
- Complete
TODOitems - Complete test suite
- Complete
-
0.9.0
- Hadoop 2.x log file support
Change log
See CHANGELOG.
Contributing to Replephant
Code contributions, bug reports, feature requests etc. are all welcome.
If you are new to GitHub please read Contributing to a project for how to send patches and pull requests to Replephant.
License
Copyright © 2013 Michael G. Noll
See LICENSE for licensing information.