kis / Scale
Licence: mit
Angular plugin for creating charts
Stars: ✭ 39
Programming Languages
javascript
184084 projects - #8 most used programming language
Projects that are alternatives of or similar to Scale
Timeline Plus
Timeline - chronological visualization of your data
Stars: ✭ 140 (+258.97%)
Mutual labels: chart, timeline
flame-chart-js
Component for incredibly fast viewing of flame charts
Stars: ✭ 28 (-28.21%)
Mutual labels: chart, timeline
jquery-linechart
JQuery plugin for creating charts
Stars: ✭ 42 (+7.69%)
Mutual labels: chart, timeline
Vis Timeline
📈 Create a fully customizable, interactive timelines and 2d-graphs with items and ranges.
Stars: ✭ 654 (+1576.92%)
Mutual labels: chart, timeline
chartjs-chart-timeline
Google-like timeline chart for Chart.js.
Stars: ✭ 44 (+12.82%)
Mutual labels: chart, timeline
React Itinerary
Render react components based on time sequences such as video or audio files.
Stars: ✭ 13 (-66.67%)
Mutual labels: timeline
D3 In Motion
Code examples and references for the course "D3.js in Motion"
Stars: ✭ 37 (-5.13%)
Mutual labels: chart
Vue World Map
A Vue JS component for displaying dynamic data on a world map.
Stars: ✭ 33 (-15.38%)
Mutual labels: chart
Unitystationbumper
Video bumper for Unity's live streaming channel.
Stars: ✭ 28 (-28.21%)
Mutual labels: timeline
Vue Echarts V3
Vue.js(v2.x+) component wrap for ECharts.js(v3.x+)
Stars: ✭ 884 (+2166.67%)
Mutual labels: chart
Adaptivecards
A new way for developers to exchange card content in a common and consistent way.
Stars: ✭ 950 (+2335.9%)
Mutual labels: timeline
Timesheet.js
JavaScript library for HTML5 & CSS3 time sheets
Stars: ✭ 6,881 (+17543.59%)
Mutual labels: chart
Timeliner
A standalone timeline app that can be controlled by and sends out its values via OSC.
Stars: ✭ 33 (-15.38%)
Mutual labels: timeline
Samples Viewer Generator
🎉 A CLI utility tool to generate web app of data visualization samples for presentation purpose
Stars: ✭ 13 (-66.67%)
Mutual labels: chart
Catchart
Pipe something from command line to a chart in the browser
Stars: ✭ 27 (-30.77%)
Mutual labels: chart
Scale


Angular plugin for building scale of items. Chart ruler completely on HTML/CSS/JS. Bar chart, line chart, calendar view visualisation. Diagram, graph, pyramid visualisation of large datasets. Showreel. The source for this module is in the main repo. Please create issues and pull requests.
Inspired by kinopoisk.ru chart written using Adobe Flash. But this chart is just on HTML/CSS without using libraries. Feel free for contribute.
Install
bower install angular-scale
npm install angular-scale
Use
<!DOCTYPE html>
<html ng-app="myApp">
	<head>
		<meta charset="utf-8">
		<link rel="stylesheet" type="text/css" href="../scale.css">
	</head>
	<body ng-controller="main">
		<scale data="data"
			   width="50"
			   height="10"
			   box-size="14"
			   line="true"
			   theme="default">
		</scale>

		<script src="https://ajax.googleapis.com/ajax/libs/angularjs/1.5.7/angular.min.js"></script>
		<script src="../scale.js"></script>
		<script src="./index.js"></script>
	</body>
</html>
angular.module('myApp', ['scale']).controller('main', ['$scope', function($scope) {
	$scope.data = [];

	var SCALE_WIDTH = 50,
	    SCALE_HEIGHT = 10;

	for (var i=0; i < SCALE_WIDTH; i++) {
		var value = Math.floor(Math.random() * SCALE_HEIGHT + 1);

		$scope.data.push({
			value: value, //Value from 1 to SCALE_HEIGHT
			title: (i + 1) + " item" //Description
		});
	}
}]);
Options
<scale data="data"
	   width="50"
	   height="10"
	   box-size="14"
	   line="true"
	   theme="default">
</scale>
- data is an array of objects [{value: 0}, ... , {value: 10}]. This is the dataset of the chart.
- width is the horizontal length of the data array. If width param is less than the length of the data array then user will see the last values of the data array.
- height is the vertical length.
- box-size is size of each box in pixels.
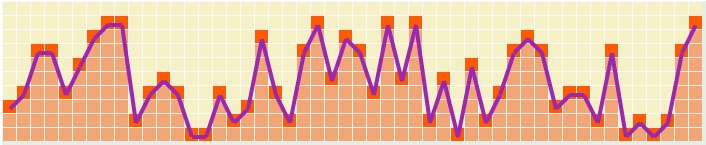
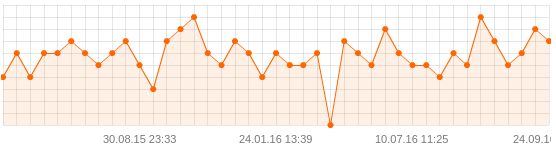
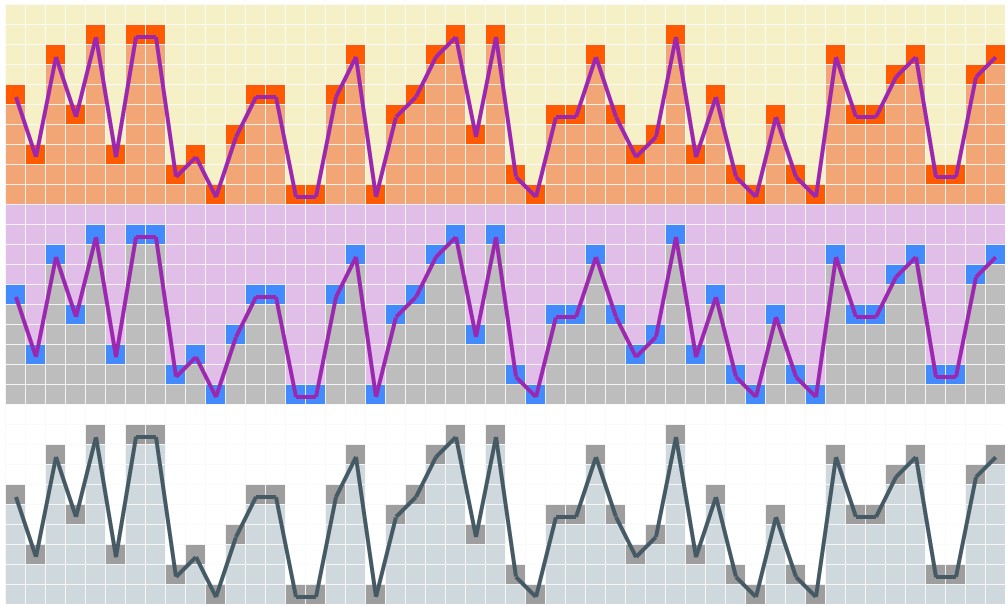
- line is param that determines if this is a line-chart.
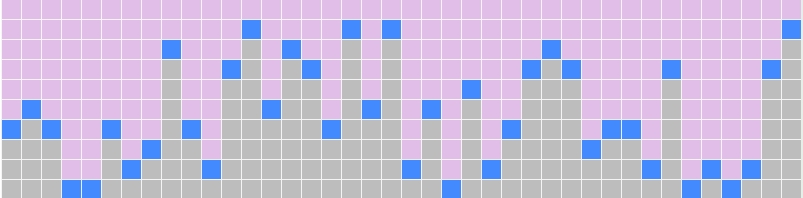
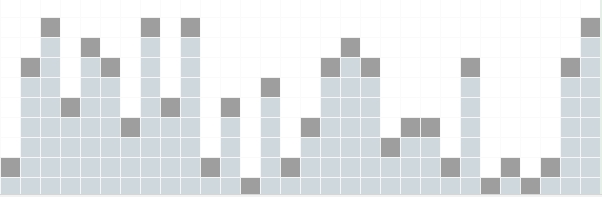
- theme is color scheme of the chart.
Please check the example folder to see how it's going on practice.
Themes
- default
- purple
- grey
Changelog
- 10/02/2016 Implemented tooltips.
- 10/01/2016 Implemented different color schemes.
- 09/20/2016 Rewriting the project as an Angular.js plugin.
- 06/05/2016 Finished writing function for calculating angle of the line that connects the points of the chart. Rendering chart.
License
Copyright (c) 2016 Kirill Stepkin
Inspired by kinopoisk.ru chart.

Note that the project description data, including the texts, logos, images, and/or trademarks,
for each open source project belongs to its rightful owner.
If you wish to add or remove any projects, please contact us at [email protected].