ericleong / Slickr
Programming Languages
Projects that are alternatives of or similar to Slickr
slickr
A collection of python and bash scripts to collect and analyze frame rendering performance in Android apps.
requirements
- python
-
matplotlib - only needed for
plot.py
setup
on device
Make sure to enable the "In adb shell dumpsys gfxinfo" option for "Profile GPU rendering" inside "Developer options" in your settings app!
You may need to kill and restart your app for the logging to work!
on computer
If you can't execute the scripts, you may need to mark them as executable.
$ chmod +x *.sh *.py
should do the trick on Unix-like operating systems, or cygwin.
examples
Scroll for 8 seconds and save the GPU profiling information for the current screen into a file.
$ ./slickr.sh > profile.txt
Scroll for 8 seconds and display the average frame delay (in milliseconds).
$ ./slickr.sh | ./avg.py
Scroll for 8 seconds and plot the recorded data and other metrics.
$ ./slickr.sh | ./plot.py
Compare the frame delay histograms and demand curves of two (or more) saved profiles.
$ ./compare.py profile1.txt profile2.txt
api
$ slickr.sh <package> <iterations> <distance>
-
packageis the Java package name for the Android application. For example, for the Tumblr app, it iscom.tumblr. It can be gleaned from the play store url for an application.If an app has multiple activities open,
profile.pywill choose the activity withvisibility=0(the currently visibile activity). On devices below Lollipop, all profile data is exported. -
iterationsis the number of 2 second iterations to run (since 128 frames, the default buffer size, is a duration of about 2 seconds at 60 frames per second). Default is4. -
distanceis the scroll distance in pixels. It defaults to 3x the display density (at the bucket the device belongs to).
framestats in Android Marshmallow (6.0) is automatically enabled as long as a package name is provided. It provides detailed information about the draw stage of the rendering pipeline.
understanding the plots
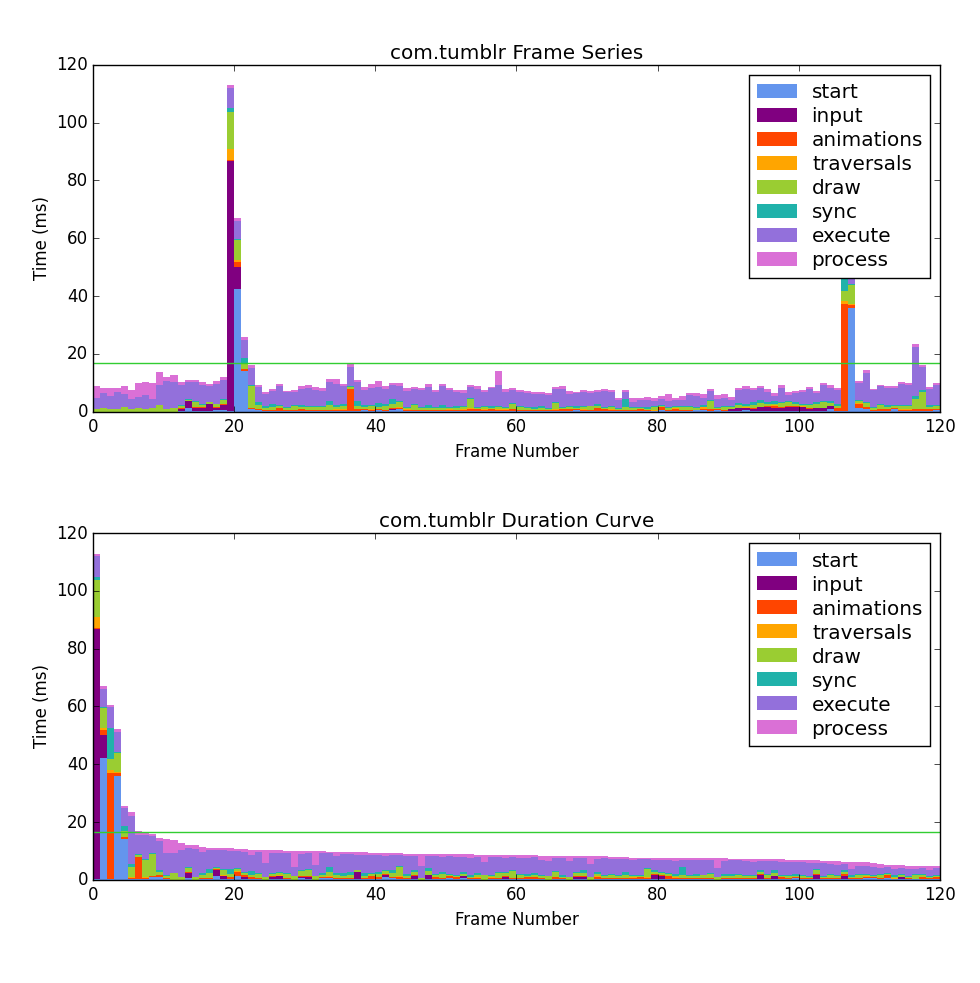
The Android M framestats data is a series of raw timestamps. These are then converted into time deltas according to the Android Developer guidelines. The gfxinfo data is also plotted if available, though there is some overlap.
| component | gfxinfo |
framestats timestamps |
notes |
|---|---|---|---|
| start | ↓ |
INTENDED_VSYNC → HANDLE_INPUT_START
|
time spent by system |
| input | ↓ |
HANDLE_INPUT_START → ANIMATION_START
|
time spent handling input events |
| animations | ↓ |
ANIMATION_START → PERFORM_TRAVERSALS_START
|
time spent evaluating animators |
| traversals | ↓ |
PERFORM_TRAVERSALS_START → DRAW_START
|
time spent on layout and measure |
| draw | draw |
DRAW_START → SYNC_START
|
time spent on View.draw()
|
| sync | prepare |
SYNC_START → ISSUE_DRAW_COMMANDS_START
|
time spent transfering data to gpu |
| ↓ | execute | time spent executing display lists | |
| gpu | process |
ISSUE_DRAW_COMMANDS_START → FRAME_COMPLETED
|
time spent waiting on gpu |
The green line represents the 16.67 ms threshold needed to achieve a smooth 60 frames per second.
duration curve
The duration curve rearranges the profiling data by sorting it from slowest to fastest frame. This is based off load duration curves in power engineering and illustrates how many frames went over the 16 ms threshold needed for 60 FPS and how many milliseconds they went over.

