Introduction:
SmartDump is a flexible command line utility to capture exception logs and memory dump files against a target process based on user specified settings like filter strings or memory addresses of breakpoints. This tool also focuses on addressing several scenarios that we cannot utilize some well-known and most widely used debugging tools, for example:
1. iDNA Trace(TTT/TTD) cannot be used within Kudu console or RDP for Azure Web Sites related debugging scenarios.
2. Debug Diagnostic Tool(DebugDiag) cannot be installed and used for Kudu console or RDP as well.
3. Procdump works with Kudu but may not successfully capture managed exceptions against web hosts with .Net Core runtime.
4. For intermittent issues, capturing iDNA Trace(TTT/TTD) may not be an appropriate approach even with selective recording.
Currently SmartDump is still under development. New features are continuously being added. Bug reports, suggestions and feedback from you will be very much appreciated.
New feature:
Now -v option can real-time display manage callstack when a .net exception is thrown. Moreover using function name as filter to capture memory dump is supported.
(NOTE: this feature is only available on 32bit version currently and hasn't been added into 64bit version.

How to Use:
Below is a detailed step-to-step demo.
- First of all, we need to open Kudu console and drag/upload the tool into the site folder.

-
Next, we need to find the PID of our site’s w3wp.exe from Process Explorer.
NOTE: the one with (scm) is for Kudu console. Hence we always have to focus on w3wp.exe without (scm).

-
Then we can run SmartDump.exe and use -p option to specify the PID found in step #2.
This makes SmartDump attach to the target process and start to monitor any exception thrown in it. By default, the tool captures 5 exceptions.

After submitting requests to generate some exceptions, SmartDump will be able to capture them within the console.
-
If you want to see more exceptions, just use -n option to specify number of exceptions to be captured.
NOTE: using -n 0 to start an unlimited/endless capture. However please be careful to use this in Kudu because it doesn’t support Ctrl+C to exit a process. Run inside a common cmd.exe without such issue.
Tips: you can also add: > filename.log at the end of a command to make Kudu write output into a log file for you.

-
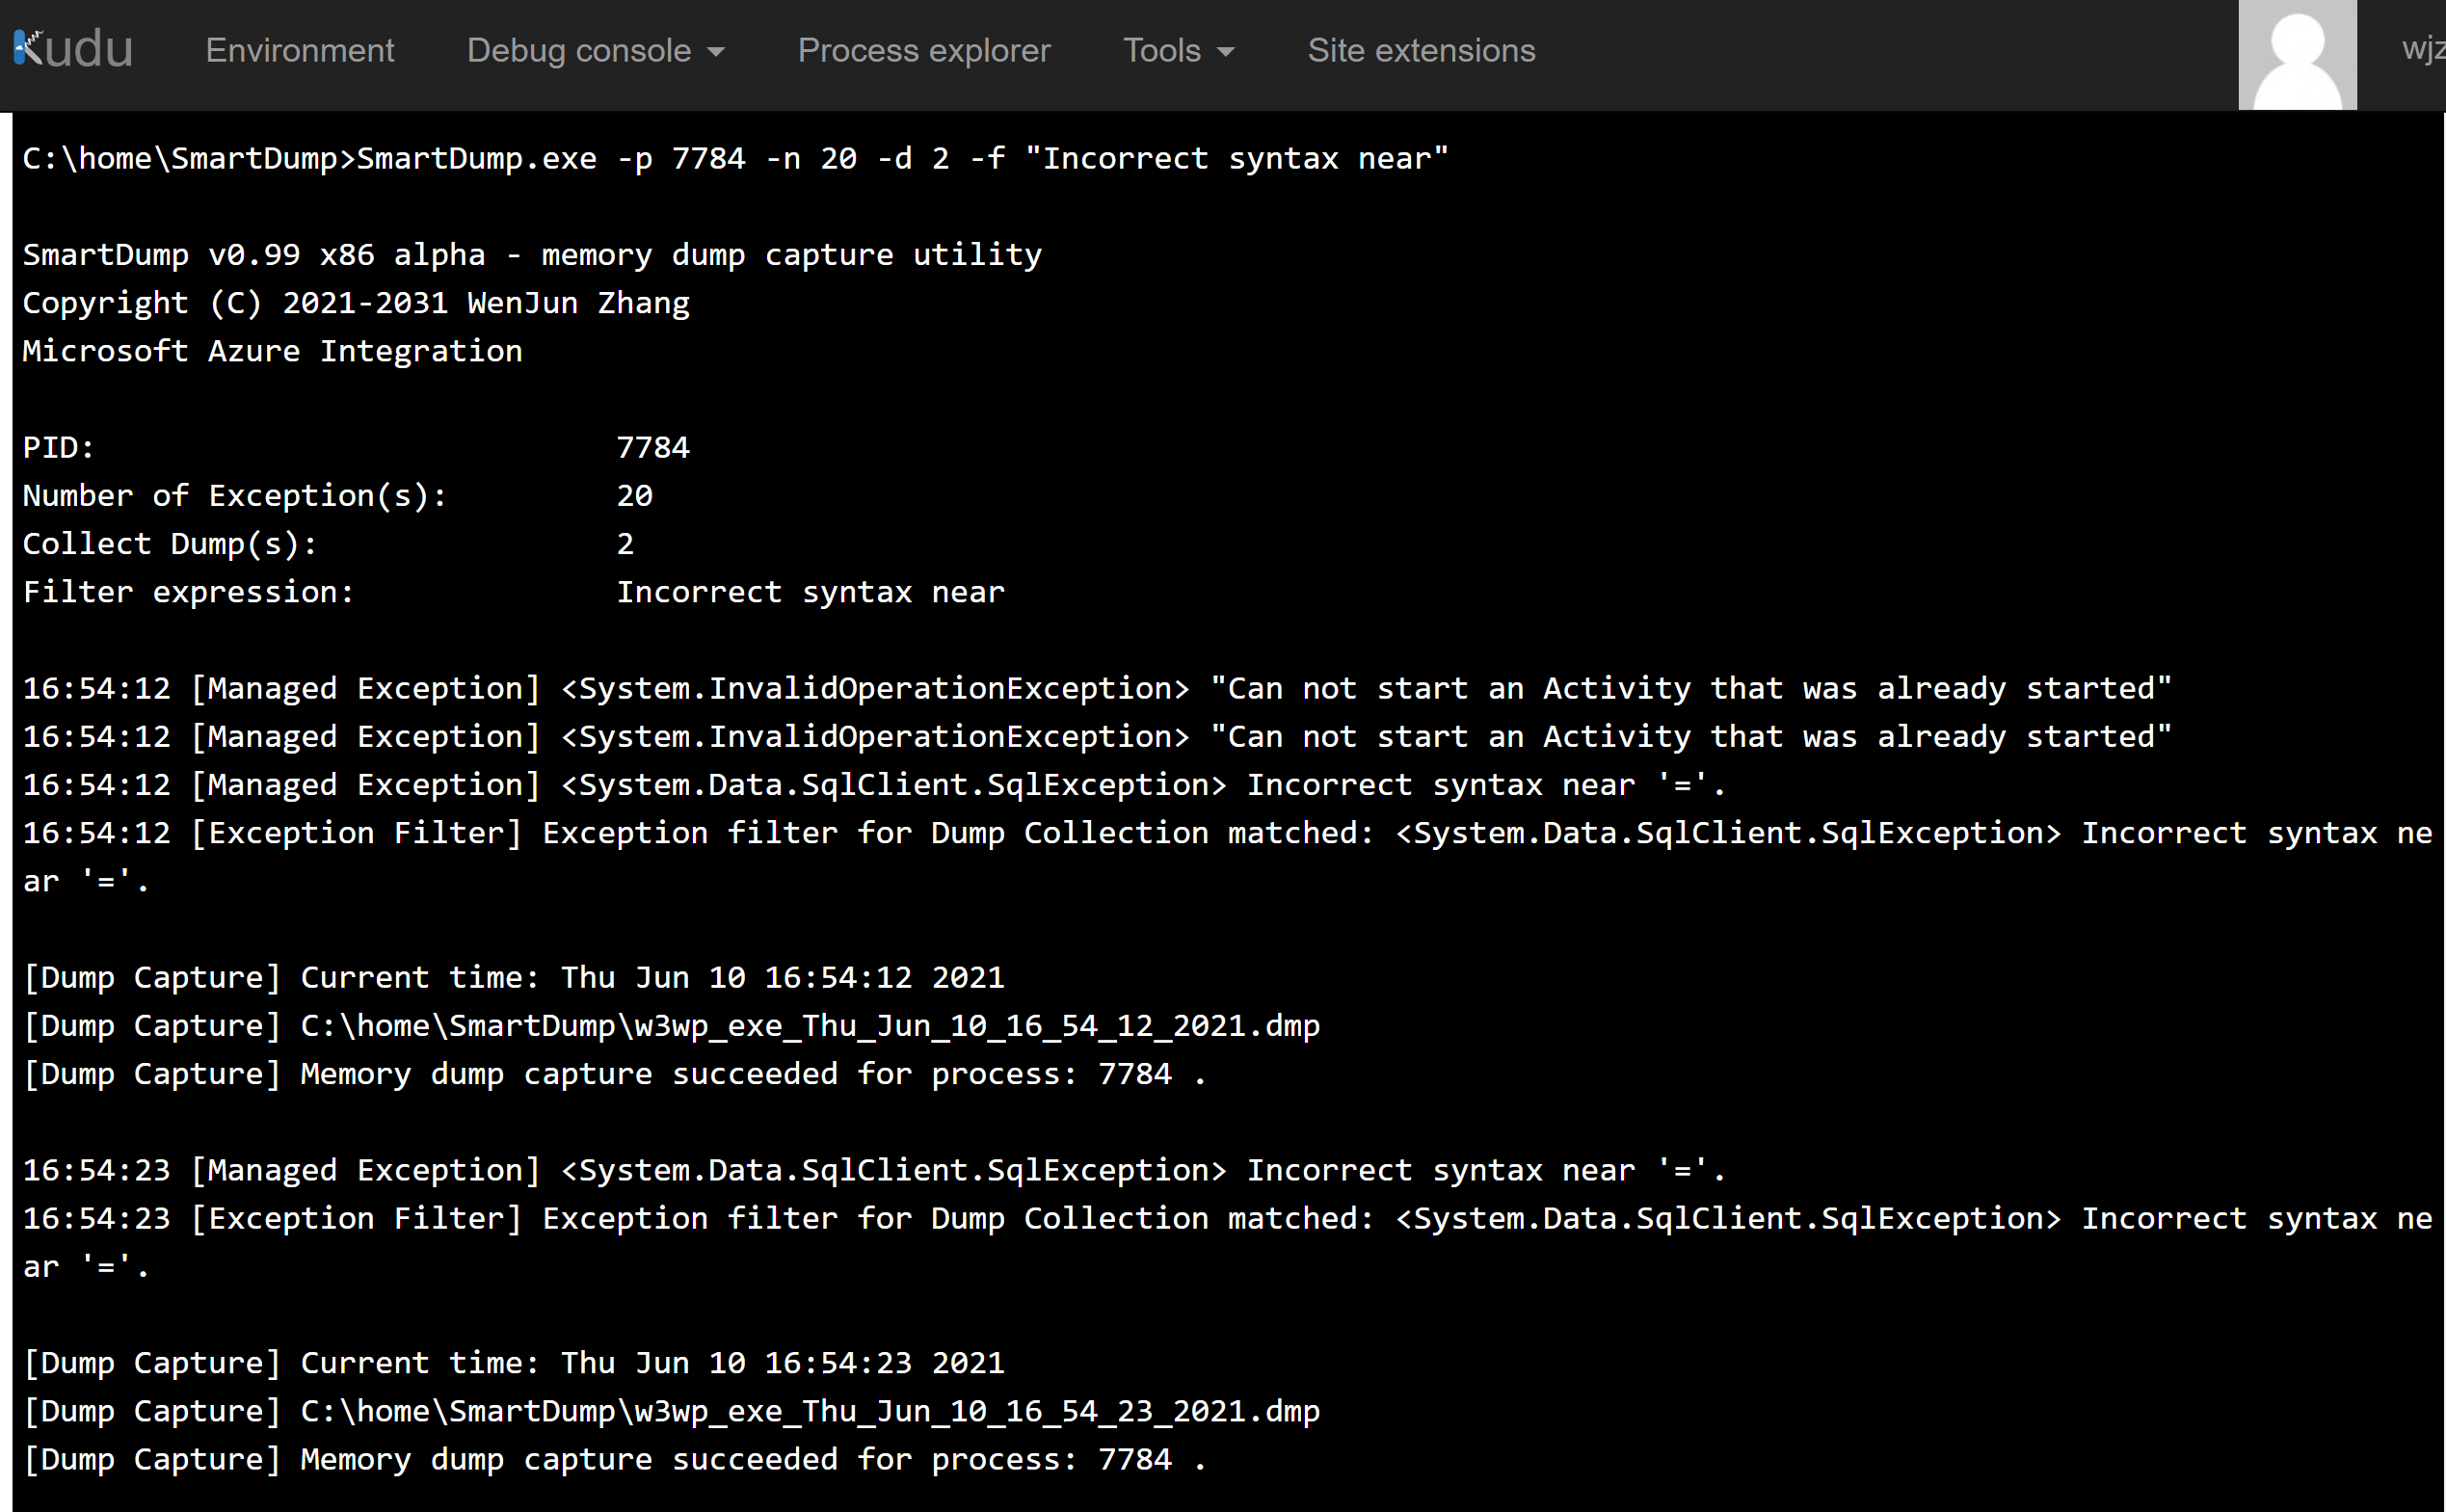
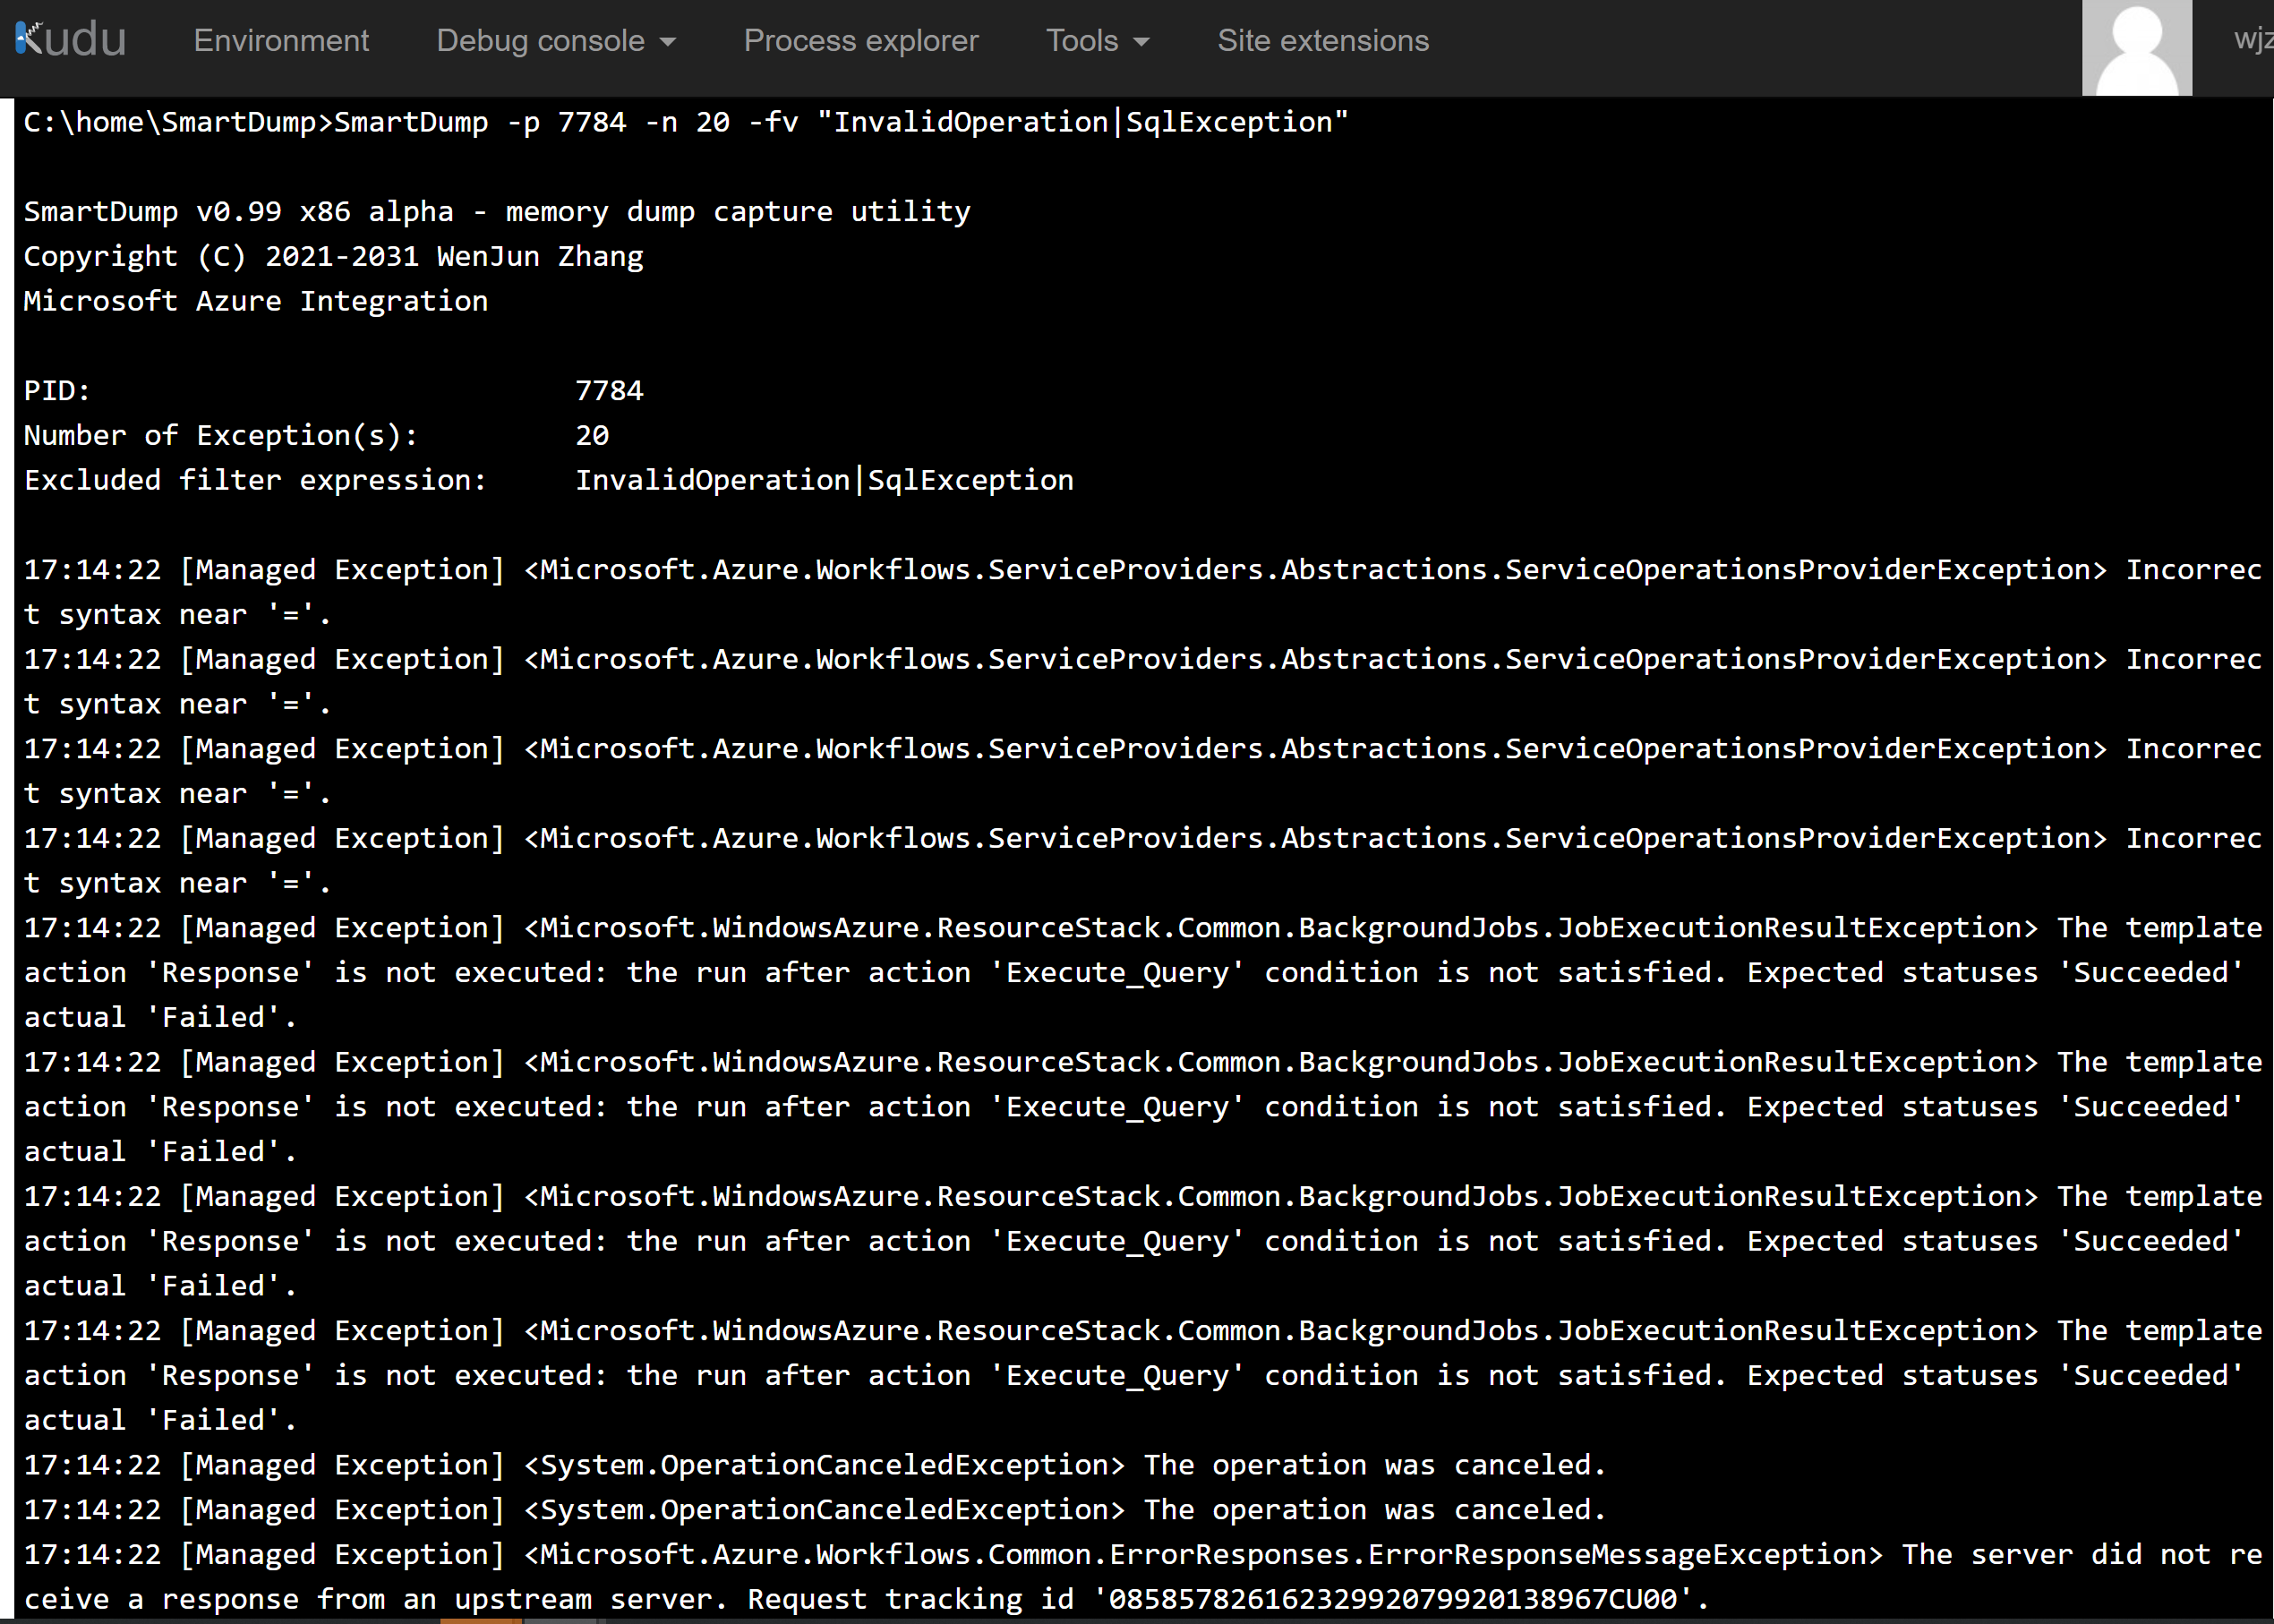
To generate dump, use -d option to set number of dumps to be captured. Associating it with -f(filter include) allows you to capture dumps against specific exceptions. Also, use -fv (filter exclude) options to filter/exclude any unnecessary exceptions from output.
- -f Filter exception based on specified string(s). Use '|' as delimiter for multiple strings.
- -fv Exclude exceptions contain specified filter. Use '|' as delimiter for multiple strings.

-
The tool also supports to set memory address of breakpoint to generate dump files.
You can capture a dump first and then open it in debugger to find the code entry address of a function you interest in(or code address of any line). Then use -a option of SmartDump to set the address as breakpoint for capture:


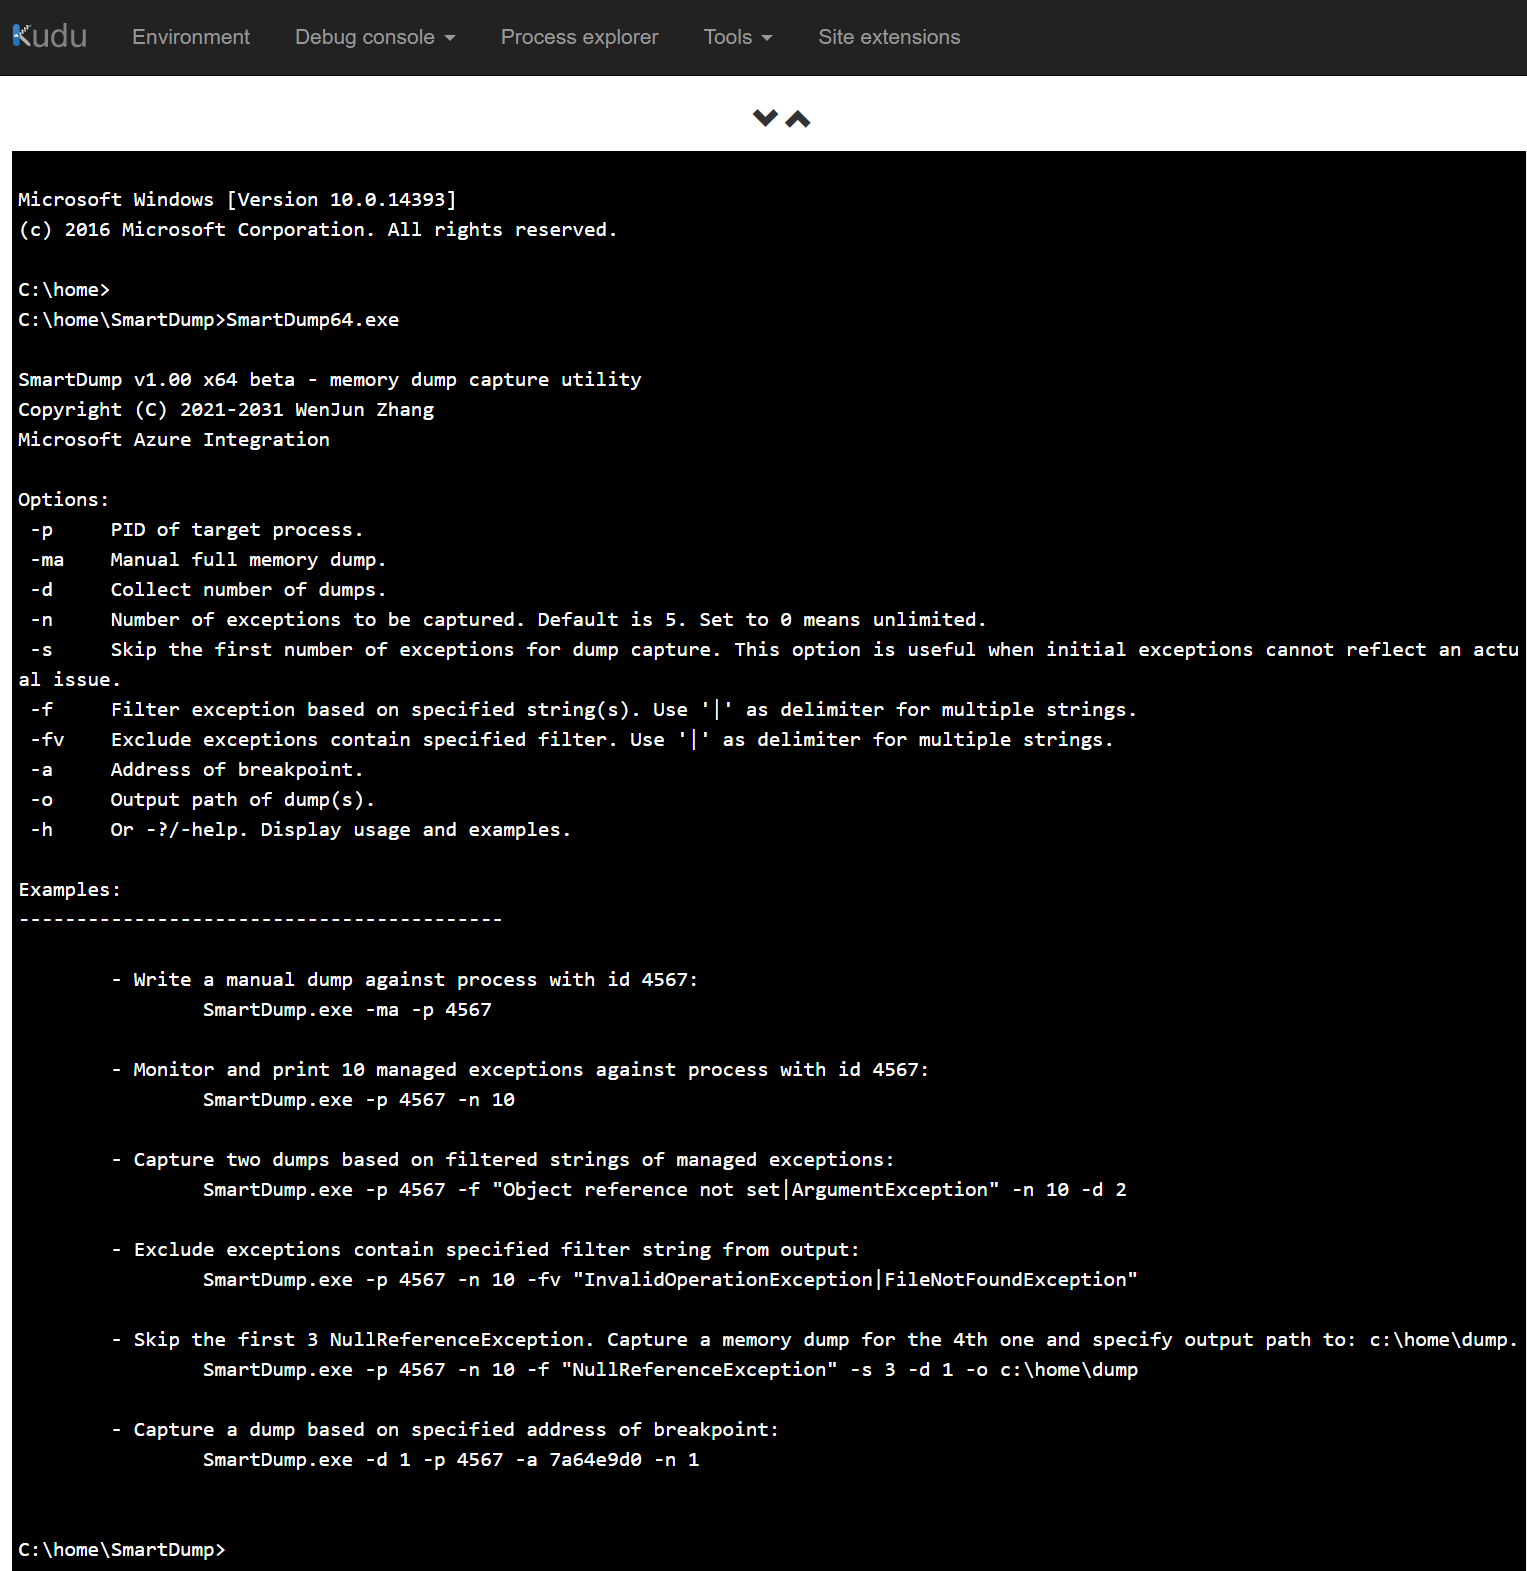
Usage:
SmartDump x86/x64 - exception and memory dump capture utility
Options:
-p     PID of target process.

-n     Number of exceptions to be captured. Default is 5. Set to 0 means unlimited.

-d     Collect number of dumps.

-de    Collect number of dumps in 'Dump for each' mode. Dumps will be captured for each of different exception types.

-f     Filter(include) exception based on specified string(s). Use '|' as delimiter for multiple strings.

-fv    Exclude exceptions contain specified filter. Use '|' as delimiter for multiple strings.

-s     Skip the first number of exceptions for dump capture.

-ma    Capture a manual dump.

-mn    Option to captue a mini dump. Default setting is to capture full memory dumps.

-v     Enable verbose output to list managed callstacks and function entry addresses can be utilized to set breakpoints with -a option.

-a     Dump with address of breakpoint.

-o     Output path of dump(s).

-h     Or -?/-help. Display usage and examples.
Examples:
    - Write a manual dump against process with id 4567:
            SmartDump.exe -ma -p 4567

    - Monitor and print 10 managed exceptions against process with id 4567:
            SmartDump.exe -p 4567 -n 10

    - Capture two dumps based on filtered strings of managed exceptions:
            SmartDump.exe -p 4567 -f "Object reference not set|ArgumentException" -n 10 -d 2

    - Exclude exceptions contain specified filter string from output:
            SmartDump.exe -p 4567 -n 10 -fv "InvalidOperationException|FileNotFoundException"

    - Skip the first 3 NullReferenceException. Capture a memory dump for the 4th one and specify output path to: c:\home\dump.
            SmartDump.exe -p 4567 -n 10 -f "NullReferenceException" -s 3 -d 1 -o c:\home\dump

    - Capture 3 mini dumps for each of the exception types: NullReferenceException, SocketException and ArgumentException
            SmartDump.exe -p 4567 -n 10 -de 3 -mn -f "NullReferenceException|SocketException|ArgumentException"

    - Display verbose output to list managed callstacks.
        After that, we can use function name as filter to capture dumps or utilize function entry address to set breakpoint with -a option to dump an interested call.
            SmartDump.exe -p 4567 -n 20 -v

    - Capture a dump based on specified address of breakpoint:
            SmartDump.exe -d 1 -p 4567 -a 7a64e9d0 -n 1
The following are several sample commands that uses the tool with Kudu debug console.
- Show options and examples
- Monitor and display exceptions

- Capture a manual dump

- Capture two exception dumps based on filter string.
- Exclude/filter uninterested exceptions based on specified strings delimited with '|'
- Collect dump based on specified address of breakpoint.

- Skip the first 3 SqlException. Capture two memory dumps for the 4th and 5th ones and specify output path to: c:\home\dump.

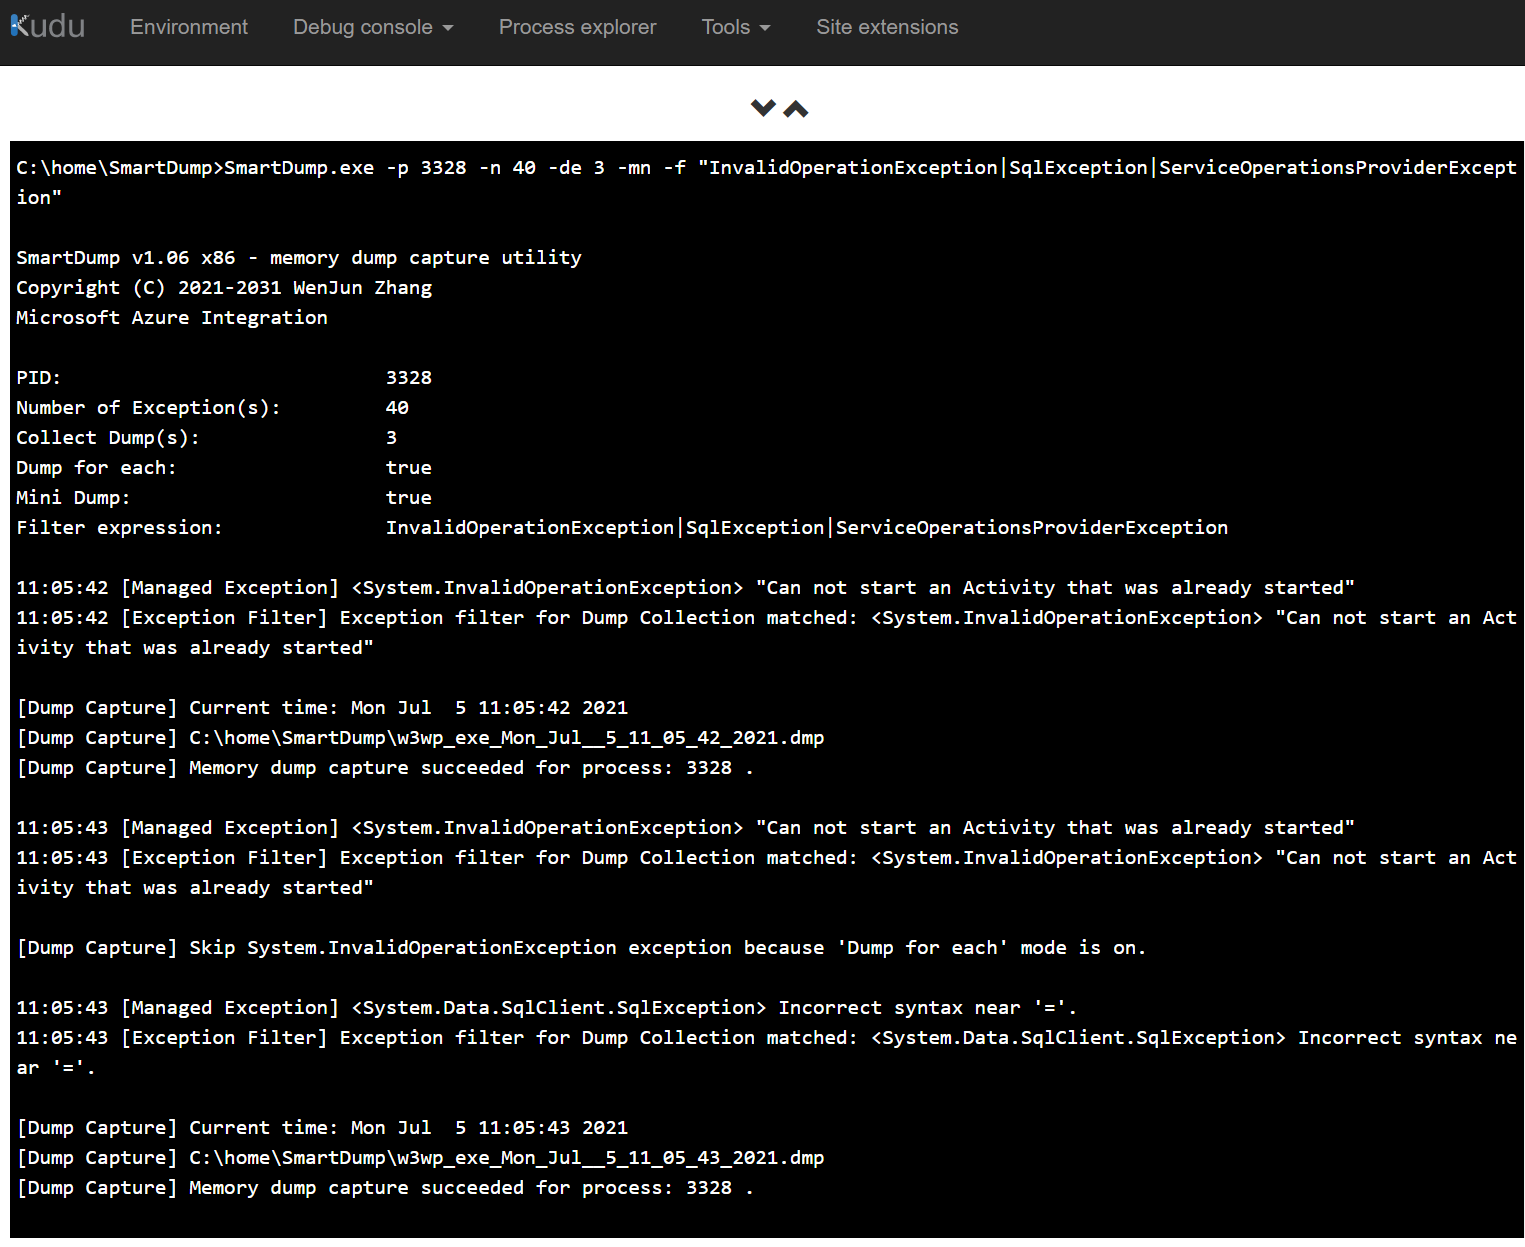
- Use -de 'Dump for each' option to capture 3 mini dump files for 3 specified exception types: InvalidOperationException, SqlException and ServiceOperationsProviderException.
- Use SmartDump to write a log of exceptions for your site.


- Capture against process of onpromise environment

-
Verbose(-v) option can real-time display manage callstack when a .net exception is thrown. Moreover using function name as filter to capture memory dump is supported in this build. (NOTE: this feature is only available on 32bit version currently and hasn't been added into 64bit version.
SmartDump.exe -p 4567 -n 20 -v
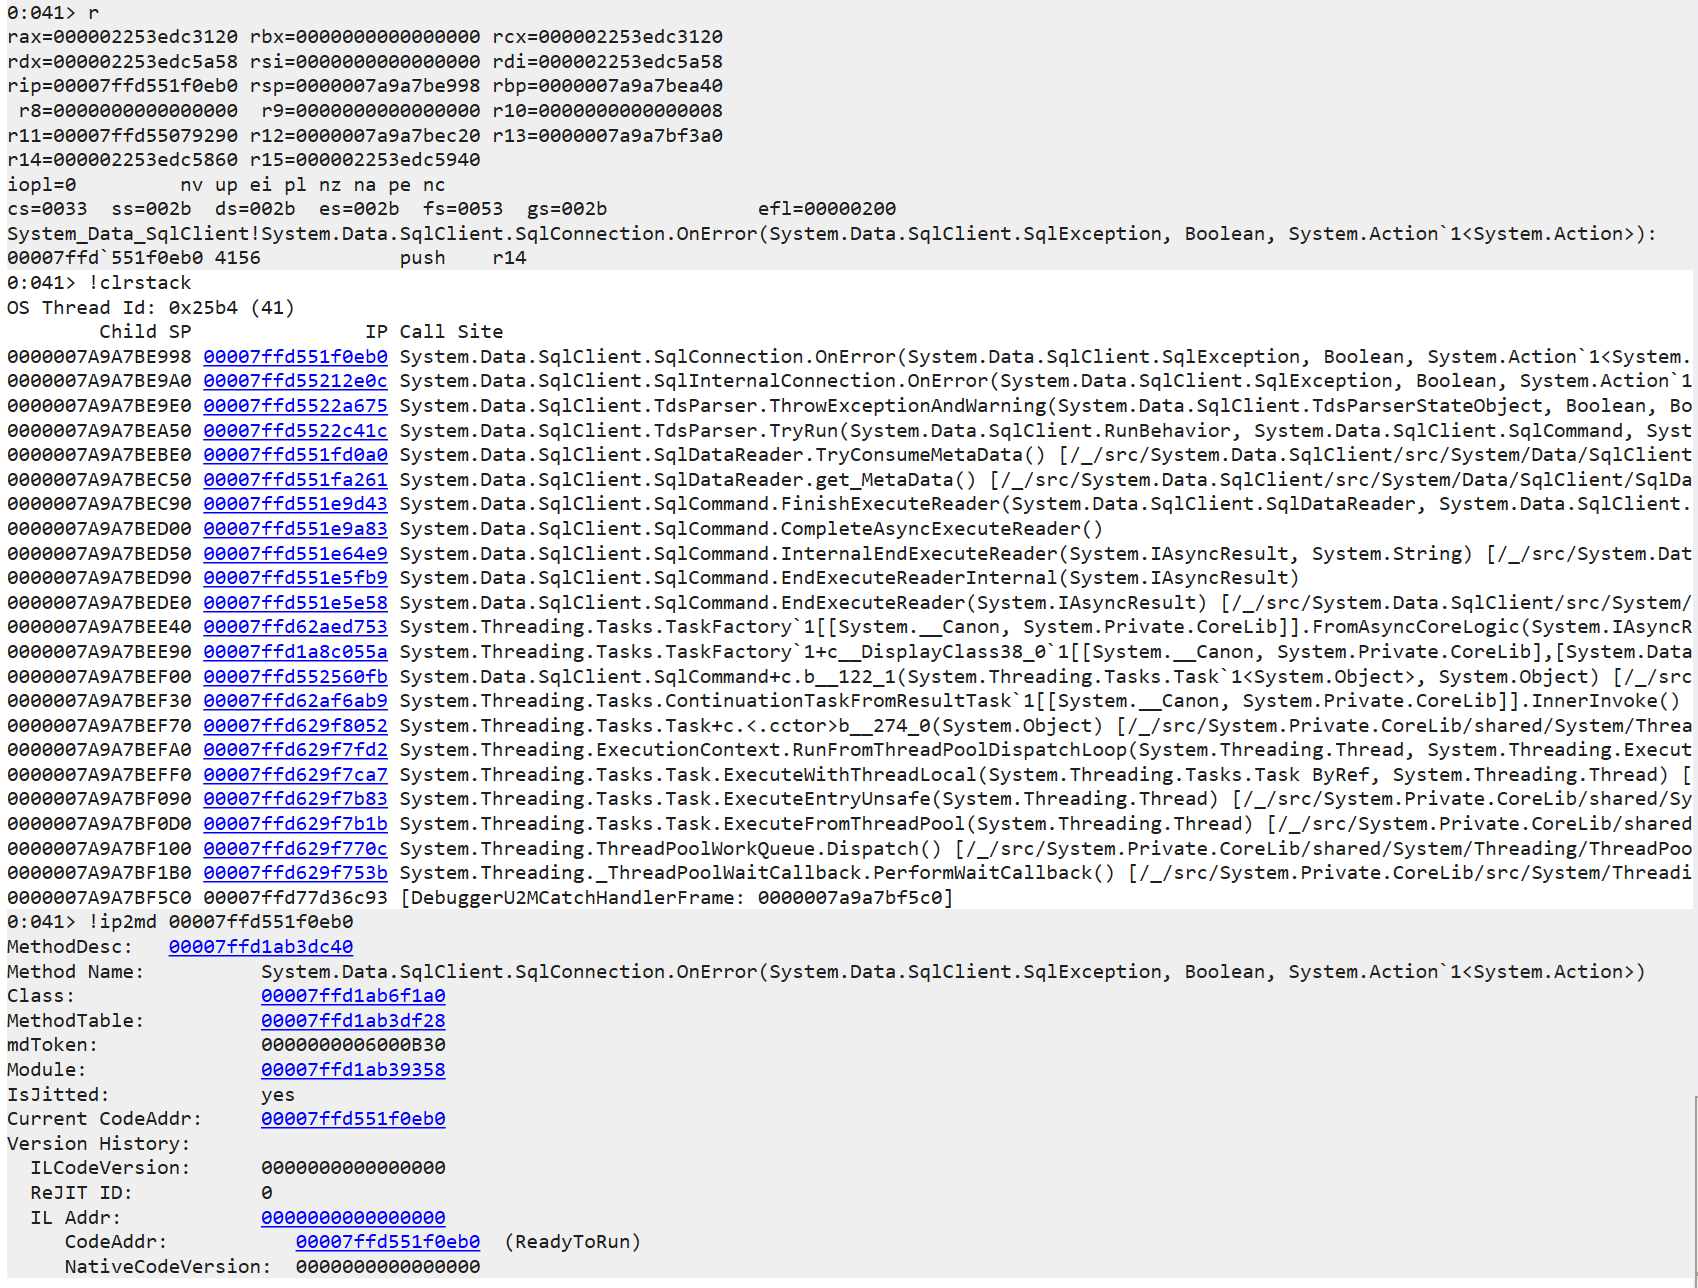
Also a function entry address of a function can be used to dump its corresponding interested call. The frame output indicates the entry code address of the first managed call that threw the exception is 0x00007ffd`551f0eb0.

So we use address: 00007ffd`551f0eb0 as breakpoint to capture dump with -a option:

As we can see, 00007ffd`551f0eb0 is just the entry address of function: System.Data.SqlClient.SqlConnection.OnError
Project
This repo has been populated by an initial template to help get you started. Please make sure to update the content to build a great experience for community-building.
As the maintainer of this project, please make a few updates:
- Improving this README.MD file to provide a great experience
- Updating SUPPORT.MD with content about this project's support experience
- Understanding the security reporting process in SECURITY.MD
- Remove this section from the README
Contributing
This project welcomes contributions and suggestions. Most contributions require you to agree to a Contributor License Agreement (CLA) declaring that you have the right to, and actually do, grant us the rights to use your contribution. For details, visit https://cla.opensource.microsoft.com.
When you submit a pull request, a CLA bot will automatically determine whether you need to provide a CLA and decorate the PR appropriately (e.g., status check, comment). Simply follow the instructions provided by the bot. You will only need to do this once across all repos using our CLA.
This project has adopted the Microsoft Open Source Code of Conduct. For more information see the Code of Conduct FAQ or contact [email protected] with any additional questions or comments.
Trademarks
This project may contain trademarks or logos for projects, products, or services. Authorized use of Microsoft trademarks or logos is subject to and must follow Microsoft's Trademark & Brand Guidelines. Use of Microsoft trademarks or logos in modified versions of this project must not cause confusion or imply Microsoft sponsorship. Any use of third-party trademarks or logos are subject to those third-party's policies.