meltaxa / Solariot
Programming Languages
Projects that are alternatives of or similar to Solariot
Solariot
Leverage your IoT enabled Solar PV Inverter to stream your solar energy usage data to a real time dashboard.
Solariot will connect directly to your Inverter using Modbus TCP.
Currently, Solariot is able to talk to a SMA Sunny Boy and Sungrow SH5K & SG5KD inverters. Solariot is designed to allow any Modbus TCP enabled inverter to be queried using a Modbus register map.
Data is collected and can be streamed to destinations like dweet.io, MQTT, InfluxDB or PVOutput. To visual the telemetry, use a dashboard such as Grafana. For example, this is Meltaxa's Grafana dashboard on solarspy.live:
Pre-requisites
-
The Inverter must be accessible on the network using TCP.
-
This Python script should work on most Inverters that talk Modbus TCP. You can customise your own modbus register file.
-
Run on Python 3.5+.
Installation
-
Download or clone this repository to your local workstation.
git clone https://github.com/meltaxa/solariot.git cd solariot -
Install the required libraries.
pip install -r requirements.txt -
Update the config.py with your values, such as the Inverter's IP address, port, inverter model (which corresponds to the modbus register file) and the register addresses Solariot should scan from. Enable optional support for MQTT, PVOutput, InfluxDB and more.
-
Run the solariot.py script.
./solariot.py- Command line options:
-c             Python module to load as our config. Default is config.py.
-v             Level of verbosity 0=ERROR 1=INFO 2=DEBUG.
--one-shot     Run solariot just once then exit.
Docker
-
Create a directory for the config file [config.py].
-
Create a config.py (see config-example.py) and place it in the config directory.
-
Run the Docker image with the volume switch to mount your config directory as /config in the image
docker run -v <localpath>:/config meltaxa/solariot
Next Steps
Now that you are collecting the inverter's data, you'll want to ultimately display it in a dashboard as seen above.
There are many methods to stream the data. Here are a couple options, which both can be enabled in Solariot. Let me know if you have other methods, such as MQTT as the pub/sub service or another IoT Time Series database.
Dweet.io and Freeboard
This is the quickest method and is a good place to start.
Metrics are streamed to dweet.io a free IoT messaging service. No sign up is required. All you need to do is create a unique identifier by updating the dweepy_uuid value in the config.py file.
Data can then be visualised using a free dashboard service from Freeboard. You'll need to create your own dashboard, using dweet.io as your data source.
MQTT Support
This is a good way to push data to MQTT topics that you might subscribe various tools such as Node-Red or Home Assistant to. Running your own MQTT server will mean you can also retrieve these values when your internet is offline.
All you need to do is to set the mqtt_server, mqtt_port, mqtt_username,
mqtt_password and mqtt_topic values in config.py file and you'll be up
and running.
InfluxDB and Grafana
Use a time series database such as InfluxDB to store the inverter data as it streams in. You'll need to install this on your own server.
To display the data in real time dashboard, you can use Grafana to pull the metrics from InfluxDB. You can either install your own Grafana server or use their free Grafana hosted solution.
A json export of solarspy.live Grafana dashboard is available under the grafana folder. The file will require editing to match your InfluxDb settings.
PVOutput.org
We offer direct integration to publishing metrics to the 'Add Status' API endpoint of PVOutput.
Supported values are v1 through to v6 and an assumption that v1 and v3 are values are incremental and reset every day.
All you need to do is set the pvoutput_api, pvoutput_sid and pvoutput_rate_limit values in config.py file and
you'll be publishing in no time!
Integration with PVOutput.org and Grafana
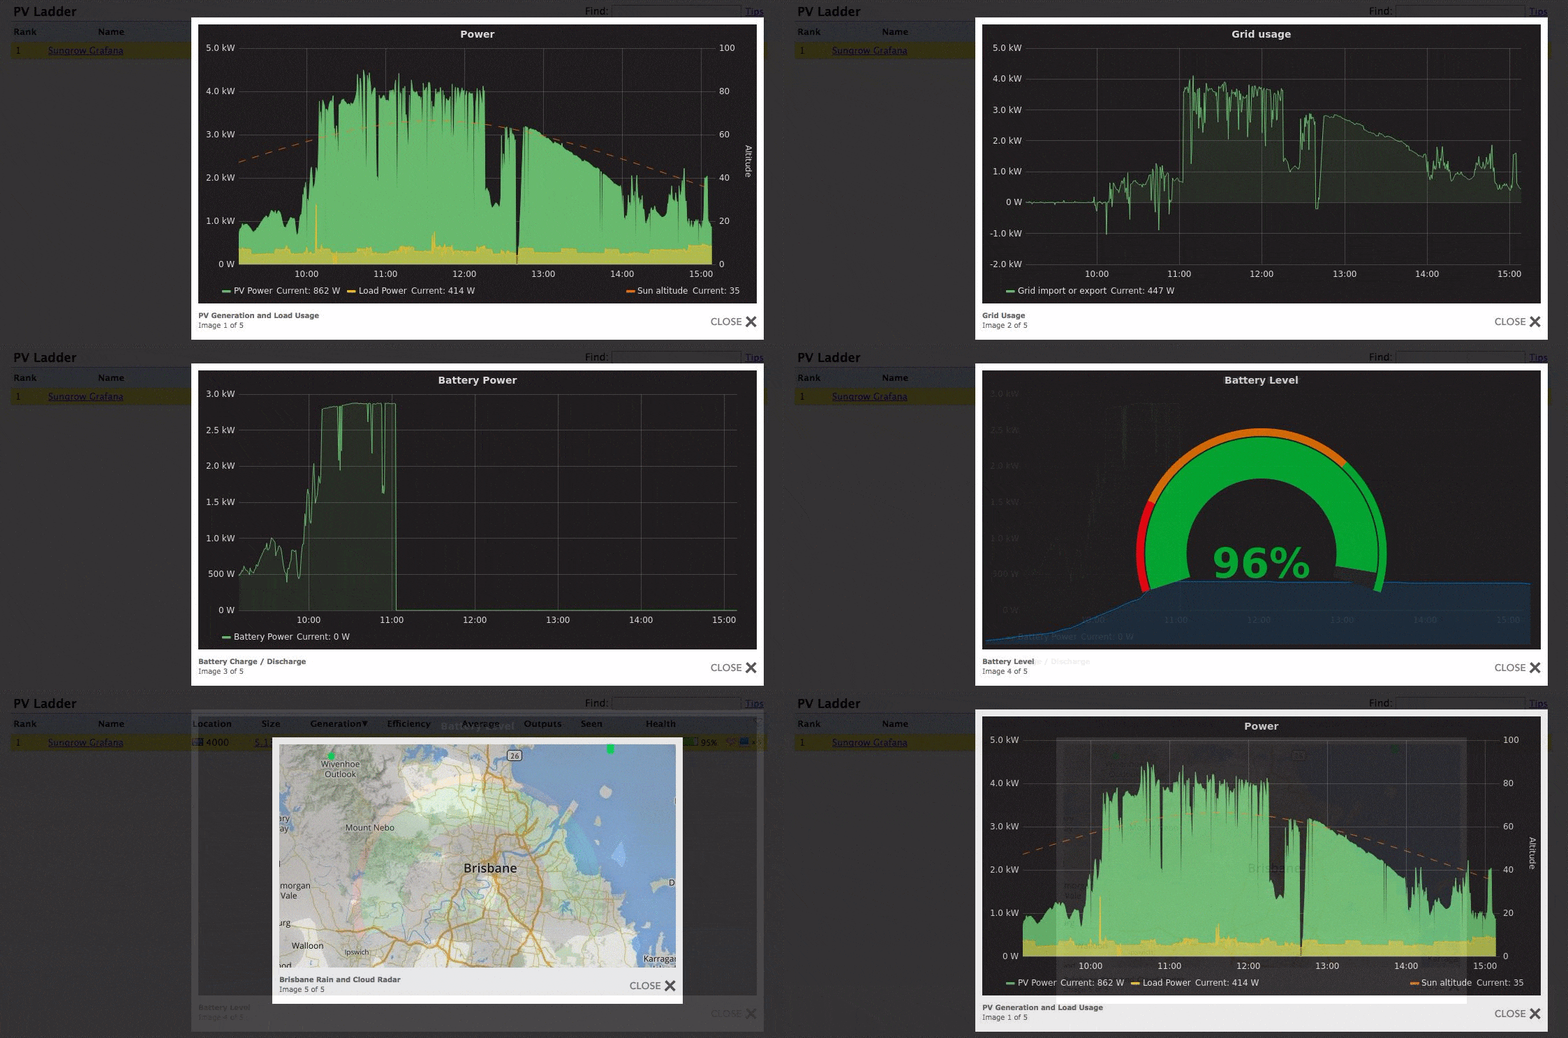
If you are using Grafana as your dashboard, a neat little trick is to then incorporate your Grafana panels with your PVOutput as system photos. From your PV Ladder page, click on your photos to view the real time Grafana images:
-
Obtain your Grafana panel direct link, see their documentation: http://docs.grafana.org/reference/sharing/#direct-link-rendered-image.
-
In your PVOutput "Edit System" page, add your Grafana panel link in the "Image Link" field. Append "&png" to the link. Note, if the URL is longer than 100 characters, use a URL shortener service instead (such as https://goo.gl). Don't forget to append the "&png" string to your URL.
-
Now go to your system in the PV Ladder page and click on the photos.
💡 Tip: You can add any URL image, such as the latest weather radar image 😉
Contributions
If you have created a modbus register map for an inverter, please submit your file as a pull request for Solariot inclusion.
Acknowledgements
- michael-robbins for Docker support, modbus contrib and other improvements.
- rpvelloso for the SungrowModbusTcpClient class that enables decryption of comms.
- ShogunQld for the SMA Sunnuyboy modbus map.
- zyrorl for MQTT support contrib.


