skrusche63 / Spark Piwik
Programming Languages

Beyond Piwik Web Analytics
Transform customer engagement data from Piwik Analytics into actionable business insights.
In this project, we illustrate that Apache Spark not only is a fast and general engine for large-scale data processing, but also an appropriate means to integrate existing data sources and make their data applicable by sophisticated machine learning, mining and prediction algorithms. As a specific data source, we selected Piwik Analytics, which is a widely used open source platform for web analytics, and, an appropriate starting point for market basket analysis, user behavior analytics and more.
From piwik.org
Piwik is the leading open source web analytics platform that gives you valuable insights into your website’s visitors, your marketing campaigns and much more, so you can optimize your strategy and online experience of your visitors.
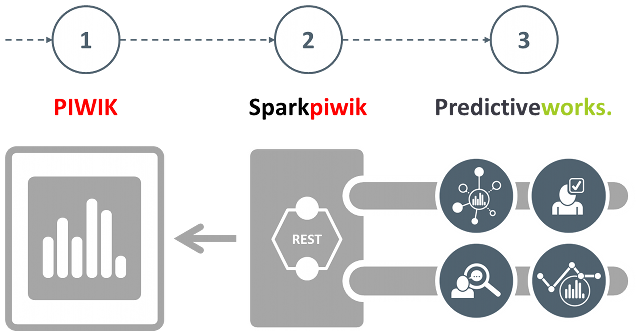
Integrating Piwik Analytics with Predictiveworks. enables to evaluate customer engagement data from Piwik with Association Analysis, Intent Recognition, Recommendations and Series Analysis and more to gain insights into customer engagement data far beyond traditional web analytics.
Historical Engagement Data
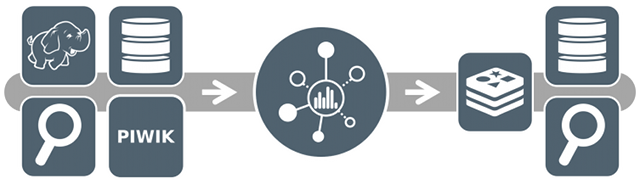
Integration is based on Piwik's MySQL database.
The few lines of Scale code below show how to access customer engagement data persisted in Piwik's MySQL database. The connector requires the respective database location, name and user credentials.
Customer engagement data are retrieved by specifying the unique identifier idsite of a certain website supported by Piwik, and a specific query statement query.
object MySQLConnector {

  private val MYSQL_DRIVER   = "com.mysql.jdbc.Driver"
  private val NUM_PARTITIONS = 1

  def readTable(sc:SparkContext,url:String,database:String,user:String,password:String,idsite:Int,query:String,fields:List[String]):RDD[Map[String,Any]] = {

    val result = new JdbcRDD(sc,() => getConnection(url,database,user,password),
      query,idsite,idsite,NUM_PARTITIONS,
      (rs:ResultSet) => getRow(rs,fields)
    ).cache()

    result

  }
Customer Segmentation
Grouping customers or visitors of a business website by a common set of features such as time of engagement, location and others help marketers or publishers to reach a specific target audience.
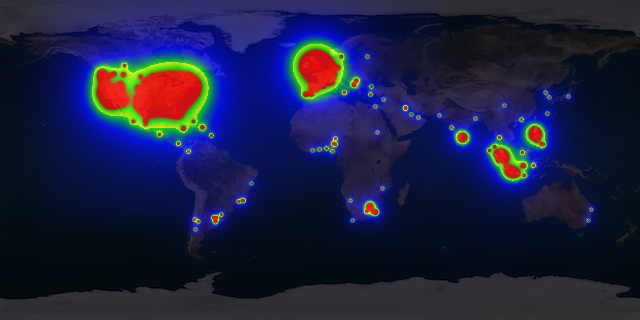
In this project KMeans clustering is applied to customer transaction data from the piwik_log_conversion table. The focus is on the geo location of the customers or visitors who made the respective transactions. For more information please look into the ClusterBuilderobject of this project.
From these data a heatmap can be drawn to visualize from which region of world most of the transactions come from. Most of the functionality to create heatmaps is covered by the objects HeatUtiland PixelUtil of this project.
The image below shows a multi-colored heatmap from real data extracted from the piwik_log_conversiontable. The colors red, yellow, green and blue indicate different heat ranges.
Segmenting customers into specific target groups is not restricted their geo location. Time of the day, product or service categories, total revenue, and other parameters may directly be used to group customers by their purchase behavior.
Purchase Horizon Prediction
Customers of products or service have a natural rhythm with respect to his or her purchase behavior. Regular visitors tend to visit an ecommerce store according to some temporal patterns that are inherent in their purchase history.
Email marketing or any other marketing campaign leads to better results if it will be aligned with these temporal patterns of the customers. This means that a marketing campaign that will go out at the right time for the right customer is obviously more effective than a campaign that does not take the customer's rhythm into account.
Predicting the right purchase horizon for each customer requires to build a personalized predictive model from the customer's historical engagement data. Once this model is available, it is easy to predict when a certain customer is likely to make the next purchase and how much he or she is likely to spend.
Optimizing email marketing is just one use case for predictive models. As Piwik Analytics tracks the ecommerce items being purchased with each order or transaction, the predicted purchase horizon may also be combined with Association Rule Mining (see below) to recommend products or services for time delayed cross-selling.
In this project, we use personalized Markov Models to predict when a customer is likely to make the next purchase.
The idea behind this approach is to aggregate customer transaction data into discrete well-defined states. A timely ordered list of customer transaction may then be interpreted as a sequence of states, where each pair of subsequent states is accompanied by a state transition probability.
With this transition probability in mind, it is no magic to compute the next probable state.
In this project, we focus on server_time and revenue_subtotal from Piwik's piwik_log_conversion table, and represent a state by a two letter symbol:
| Time since last transaction | Revenue compared to last transaction |
|---|---|
| S: Small | L: Significantly less |
| M: Medium | E: More or less equal |
| L: Large | G: Significantly greater |
Transactions are then described as sequences of states:
idsite|idvisitor|state state state ...
-----------------------------------------------------

1|b65ce95de5c8e7ea|SG SL SG
1|b65ce95de5c8e7ea|SL SG LL SG
1|b65ce95de5c8e7ea|LL SG MG LL
...
From this representation of customer transactions, we count the frequency of subsequent state pairs, i.e. (SG,SL) or (LL,SG), normalize and scale these frequencies to finally end up with state transition probabilities.
The functionality described above is covered by the MarkovBuilder, that is also responsible for serializing and persisting the derived personalized predictive models.
Finally, the `MarkovPredictor is responsible for predicting the next likely time and amount of transaction, using the personalized Markov Models as well as the last transactions of a certain customer.
Customer Loyalty Prediction
The customer's engagement with a business is reflected by a wide range of events, such as e-commerce orders (or transactions), service calls, social media comments and more. All these events are indicative of the customer's loyalty to a certain business.
Loyalty is usually defined as the strength of the relationship between a customer and a certain business. A higher degree of loyalty results in more purchase orders at a higher frequency.
Customer loyalty is an important parameter for almost any kind of business, and can e.g. be used to measure the effectiveness of marketing campaigns. Following a campaign, the loyalty curve can be analyzed for a certain period of time to see if there is any significant impact on customers loyalty.
Loyalty, however, can not be directly observer and measured. It is an internal customer state, that must be inferred adn predicted from customer engagement events.
Customer Loyalty is a highly valuable business insight derived from customer engagement data using Predictive Analytics.
We suggest to predict a sequence of (hidden) customer loyalty states from a sequence of observed customer engagement data by using a Hidden Markov Model. Identifying customers with a downward loyalty curve with such analysis can directly trigger proactive actions to resurrect the relationships of these customers.
Customer Loyalty Prediction is based on the functionality of the Spark-HMM project.
As in predicting the Purchase Horizon, the folowing states are used to aggregate a customer transaction: the time elapsed since the last transaction, small(S), medium(M) and large(L), and the amount spent compared to the last one, less(L), about same(S) and more(M).
Each customer transaction is represented by a certain state, e.g. the state SM describes a transaction, where the time elapsed since the last transaction is small and the customer spent more than last time.
Customer Loyalty is specified by three additional states, representing three different levels of loyalty: low(L), normal(N), high(H). A Hidden Markov Model combines the observed states from customer transactions with these hidden states and predicts a certain Loyalty state for each transaction.
A Hidden Markov Model transforms a set of customer transactions into a sequence of customer loyalty states.
Applying the Hidden Markov Model to customer transactions finally results in the following loyalty sequences:
idsite|idvisitor|state state state ...
-----------------------------------------------------

1|b65ce95de5c8e7ea|H H H H H L N L N N
1|b62de95da5c8e1aa|L L L N L L L H H N H N N
...
The customer loyalty sequence may then be used as a starting point to predict, whether a certain customer intends to skip the relation to a certain business.
Cross-Selling and more
Association rule mining is a wide-spread method to discover interesting relations between items in large-scale databases. These relations are specified as so called association rules. A very popular application area for association rules is the detection of regularities between products in large-scale customer engagement data recorded by ecommerce websites or point-of-sale systems in supermarkets.
For example, the rule [onions, potatoes] -> [burger] indicates that if a customer buys onions and potatoes together, he or she is likely to also buy hamburger meat. Such information can be used as the basis for decisions about marketing activities such as, e.g., promotional pricing or product placements.
In this project, we retrieve historical engagement data from the piwik_log_conversion_item table with Spark and transform these data into an appropriate transaction format. To this end, all ecommerce items that refer to the same ecommerce order are aggregated into single line.
Note: The retrieved ecommerce items are filtered by those items that have not been deleted from a certain order.
The output of this transformation has the format specified here,
idsite|idvisitor|idorder|timestamp|item item item ...
-----------------------------------------------------

1|b65ce95de5c8e7ea|A10000124|1407986582000|1 2 4 5
1|b65ce95de5c8e7ea|A10000123|1407931845000|2 3 5
1|b65ce95de5c8e7ea|A10000125|1407986689000|1 2 4 5
...
and is done by the following lines of Scala code:
def fromLogConversionItem(sc:SparkContext,idsite:Int,startdate:String,enddate:String):RDD[String] = {

  val fields = LOG_ITEM_FIELDS

  val query = sql_logConversionItem.replace("$1",startdate).replace("$2",enddate)
  val rows = MySQLConnector.readTable(sc,url,database,user,password,idsite,query,fields)

  val items = rows.filter(row => (isDeleted(row) == false)).map(row => {

    val idsite  = row("idsite").asInstanceOf[Long]
    val idvisitor = row("idvisitor").asInstanceOf[Array[Byte]]

    val user = new java.math.BigInteger(1, idvisitor).toString(16)

    val server_time = row("server_time").asInstanceOf[java.sql.Timestamp]
    val timestamp = server_time.getTime()

    val idorder = row("idorder").asInstanceOf[String]
    val idaction_sku = row("idaction_sku").asInstanceOf[Long]

    (idsite,user,idorder,idaction_sku,timestamp)

  })

  items.groupBy(_._3).map(valu => {

    val data = valu._2.toList.sortBy(_._5)
    val output = ArrayBuffer.empty[String]

    val (idsite,user,idorder,idaction_sku,timestamp) = data.head
    output += idaction_sku.toString

    for (record <- data.tail) {
      output += record._4.toString
    }

    "" + idsite + "|" + user + "|" + idorder + "|" + timestamp + "|" + output.mkString(" ")

  })

}
Discovering the Top K Association Rules from the transactions above, does not require any reference to certain website (idsite), visitor (idvisitor) or order (idorder). It is sufficient to
specify all items of a transaction in a single line, and assign a unique line number (lno):
lno|item item item ...
----------------------

0,4 232 141 6
1,169 129 16
2,16 6 175 126
3,16 124 141 175
4,16 124 175
5,232 4 238
...
Association Rule Mining is based on the Association Analysis Engine of Predictiveworks.. This engine is extracts transactions from Piwik's database and discovers the respective rules. The figure provides a conceptual perspective of the Association Analysis Engine.
The table describes the result of the Top K Association Rule Mining, where k = 10 and the confidence threshold is set to minconf = 0.8. For example, the first row of table indicates that if a customers buys the ecommerce items with the idaction_sku value of 4 and 232 together, then there is a likelihood of 90% that he or she also buys the item with the identifier 141: [4, 232] -> [141].
| antecedent | consequent | support | confidence |
|---|---|---|---|
| 4, 232 | 141 | 35 | 0.90 |
| 169, 238 | 110 | 41 | 0.84 |
| 6, 232 | 124 | 39 | 0.83 |
| 129, 175 | 141 | 35 | 0.83 |
| 124, 132, 175 | 141 | 35 | 0.83 |
| 124, 126 | 132 | 37 | 0.82 |
| 175, 232 | 124 | 38 | 0.81 |
| 16, 124, 141 | 132 | 36 | 0.80 |
| 16, 232 | 141 | 37 | 0.80 |
| 16, 175 | 141 | 41 | 0.80 |
From the association rules discovered it is no magic to support features such as
Customers who bought product A also bought product B and / or C
or even recommendations. The use case described above for applying Association Rule Mining focuses on a single predicate, i.e. buys, and the items evaluated are solely ecommerce items from a web store. The customer engagement data available from Piwik's database, however, offer the opportunity to evaluate higher dimensional predicates.
From the piwik_log_conversion table, we may easily extract further predicates, such as customer location, item quantity and more. Transforming these predicates into categorical variables (having a discrete set of possible values), such as city = berlin or daytime = afternoon, enables to assign additional item identifiers.
Taking those additional predicates into account leads to more detailed association rules:
daytime("afternoon") AND location("berlin") AND buys("onions") AND buys("tomatoes") -> buys("burger")
We have discussed association rules so far with respect to ecommerce events. The technique may - of course - also be applied to pageview events. In this scenario, a transaction specifies a web session or visit, and an item characterizes a certain web page (url).
Instead of retrieving customer engagement data from the piwik_log_conversion_item table, transactions are derived from the piwik_log_link_visit_action table.
Customer Similarity
Customer engagement data from Piwik's piwik_log_conversion_item table is easily transformed into sequential data, where each customer order or transaction is aggregated into an itemset, and all those itemsets in a certain time window form a sequence of itemsets.
These sequences describe the temporally customer purchase behavior. This is the starting point for discovering and grouping users with similar purchase behavior.
In this project, we have published a SimilarityBuilder, which computes the purchase sequence similarities within a sequence database, and then determines the K most similar customers or visitors with respect to a selected customer.
The SimilarityBuilder starts with engagement data from the piwik_log_conversion_item table transformed into the following format (see above):
idsite|idvisitor|idorder|timestamp|item item item ...
-----------------------------------------------------

1|b65ce95de5c8e7ea|A10000124|1407986582000|1 2 4 5
1|b65ce95de5c8e7ea|A10000123|1407931845000|2 3 5
1|b65ce95de5c8e7ea|A10000125|1407986689000|1 2 4 5
...
From these data, it is only a few lines of Scala code to calculate a similarity matrix, which specifies the similarity of users (i,j) with respect to their purchase behavior:
def build(sc:SparkContext,source:RDD[String],output:String) {

  val dataset = source.map(line => {

    val Array(idsite,user,idorder,timestamp,items) = line.split("|")

    val cid = idsite + "|" + user
    (cid,idorder,timestamp.toLong,items)

  }).groupBy(_._2)

  val sequences = dataset.map(valu => {

    val records = valu._2.toList.sortBy(_._3)

    val cid = records.head._1
    val sequence = records.map(_._4.split(" ").map(_.toInt)).toArray

    (cid,sequence)

  })

  matrix = computeSimilarity(sequences)

}
Real-time Engagement Data
Integration is based on Spray, Apache Kafka and Piwik's tracking library (JavaScript).
Historical customer engagement data are an appropriate means to discover valuable customer insights, and also to build predictive models, that may then be applied to customer engagement in real-time.
Real-time Clickstream Analysis
Real-time Clickstream Analysis starts from customer interaction events sent by Piwik's tracking library. The endpoint for this library is a REST service, backed by Spray, an open-source oolkit on top of Scala and Akka.
Spray is actor-based, lightweight, and modular, and comes with a small, embedded and super-fast HTTP server that is a great alternative to servlet containers. It is fully asynchronous and can handle thousands of concurrent connections.
Spray is used to delegate customer interaction events to Apache Kafka. Using the streaming support of Spark Streaming, these events are transformed into page views. These are analyzed in real-time to build e.g. page or visitor counts from streaming windows.
This approach enables to look into an event stream in real-time, and, e.g. determines which pages have been clicked or how many visitors have visited a web site every 15 seconds.
Technology Stack
- Akka
- Apache Kafka
- Apache Spark
- Spray
- MySQL