pocketjoso / Specificity Graph
Licence: mit
Generate interactive Specificity Graphs for your CSS
Stars: ✭ 680
Programming Languages
javascript
184084 projects - #8 most used programming language
Specificity Graph (for CSS)
![]()

Idea by Harry Roberts
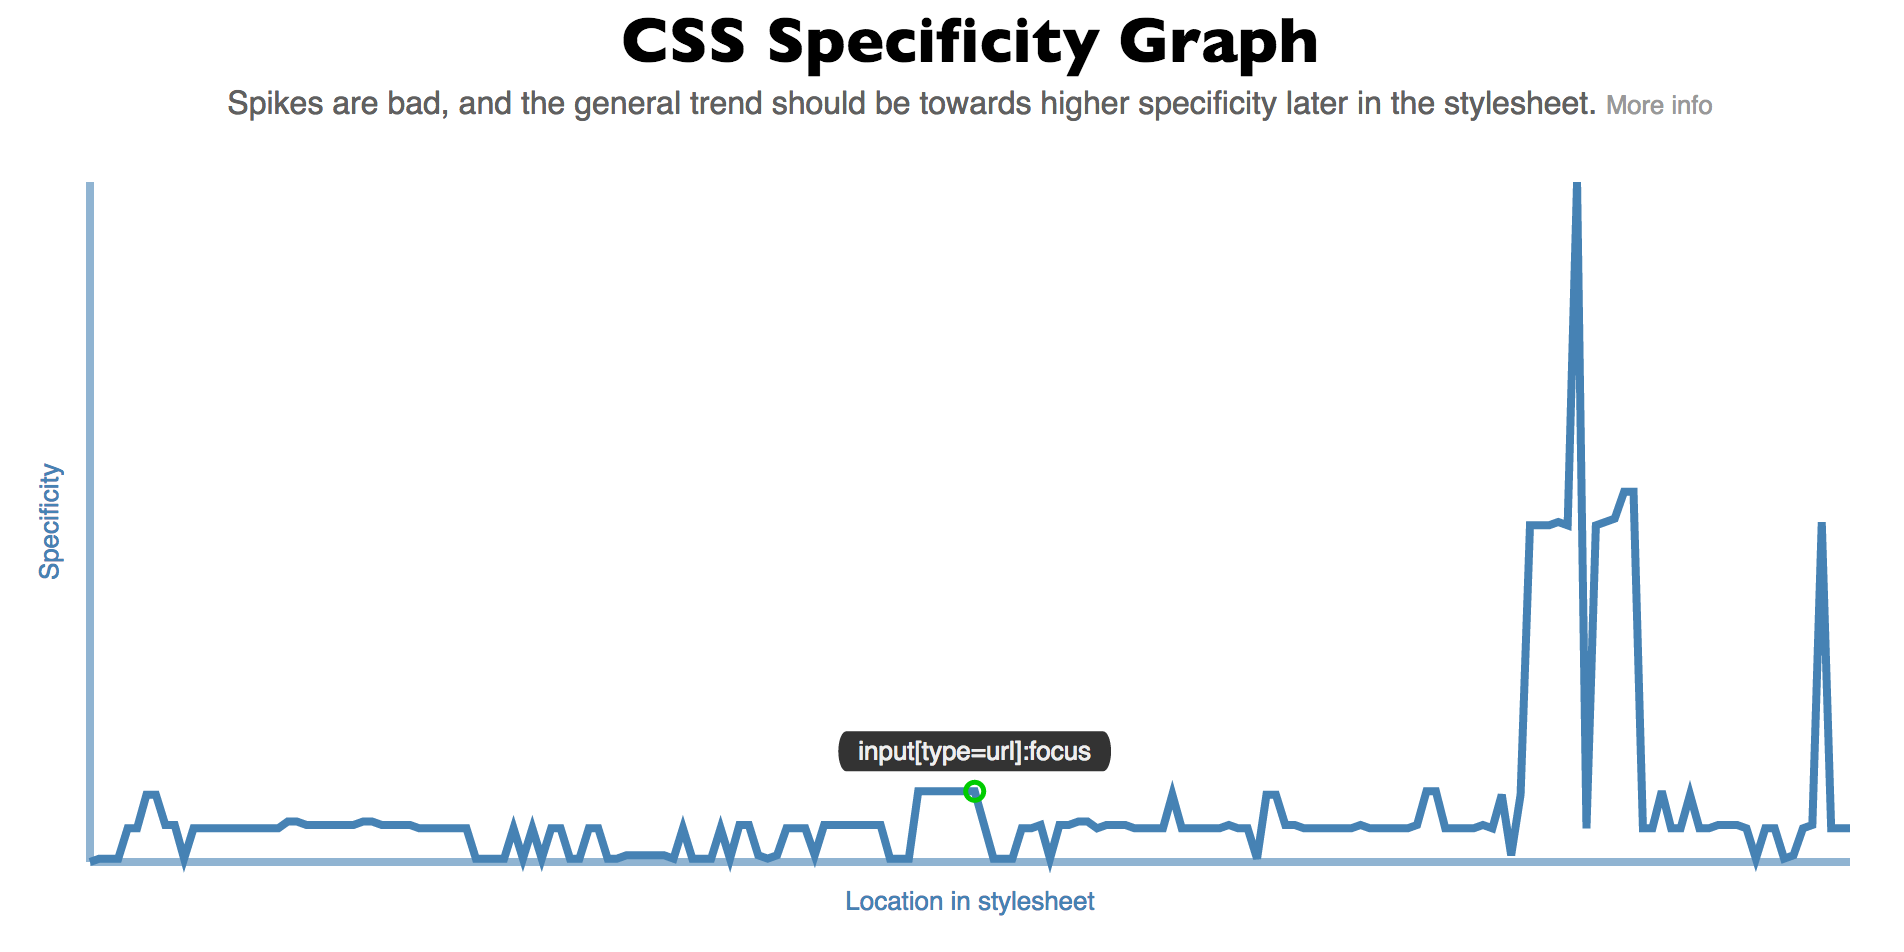 Generate an interactive line graph showing the specificity in your stylesheet. Uses d3, css-parser, and specificity.
Installation
npm install specificity-graph
Usage
specifity-graph can be used in different ways:
CLI
specificity-graph <cssFile> [options]
Creates a directory containing
-
jsonfile with specificity data for your CSS -
htmlfile with interactive specificity graph for CSS - necessary JS files to run graph
Options
| Flag | Description |
|---|---|
| -o --output | name for generated directory (default: specificity-graph) |
| -b --browser | auto launch browser to view generated chart |
| -h --help | Help |
Node module
var specificityGraph = require('specificity-graph');

specificityGraph(directory, css, function(directory){
  console.log('specificity-graph files created in ' + directory);
});
Via JavaScript
First get the specificityGraph accessible in your code:
Using Browserify (or similar)
Just require('specificity-graph').
Standalone (no module loader)
Add <script src="specificity-graph-standalone.js"></script>,
this will expose specificityGraph as a global variable.
Methods
specificityGraph.create(css, options)-
specificityGraph.createFromData(specificityData, options), specificityGraph.update(css)
Options
| Name | Description |
|---|---|
| css | String with css to generate specificity graph for |
| specificityData | JSON object with css specificity data. CLI write a JSON in this format, as does the lib/lineChart's create function' |
Create options
| Create option name | Description |
|---|---|
| svgSelector | Selector for svg element to draw specificity graph inside. Defaults to .js-graph. |
| width | default 1000. You should set a viewBox value on the SVG element to match width and height, f.e. viewbox='0 0 1000 4000'. |
| height | default 400
|
| showTicks |
Boolean. Show scale and ticks. Default false. |
| xProp | (possible values: 'selectorIndex', 'line'). What to base the x dimension, 'location in stylesheet' in graph on: index of selector in CSS, or line number for selector in CSS. Default 'selectorIndex'. |
| yProp | default 'specificity'
|
Note that the project description data, including the texts, logos, images, and/or trademarks,
for each open source project belongs to its rightful owner.
If you wish to add or remove any projects, please contact us at [email protected].