oazabir / Sqlserverperformancedashboard
Labels
Projects that are alternatives of or similar to Sqlserverperformancedashboard
SQL Server Performance Dashboard (SSPD)
Introduction
SQL Server Performance Dashboard (SSPD) is a small website that shows you performance & problems of one or more SQL Server instances and their databases in near real time. It uses the Dynamic Management Views (DMV) to gather useful data from the verbose output and combines them with utility stored procs in order to get meaningful, easy to understand information out of them. You can use it to quickly spot blocking queries, who is blocking who, expensive query that are consuming high CPU or disk, see if there's unusual locks, very high disk activity and so on.
Get the code
The binaries are here, which you can just extract into a IIS folder, put the connection strings in the web.config file for a user that has elevated privilege, and you are done. SqlServerDashboard GitHub Project Binaries
If you aren't using the sa user, but your own user, give the user the right permission:
USE master;
GO
GRANT VIEW SERVER STATE TO MyUser;
GO
Here's a sample connection string:
<add name="DB1" connectionString="Data Source=.\SQLEXPRESS;Initial Catalog=YourDatabase;User ID=MyUser;Password=MyPassword" />
Or you can get the source code from the GitHub project site: https://github.com/oazabir/SQLServerDashboard
Why not use SQL Server Management Studio?
SQL Server Management Studio comes with Activity Report that shows real time performance of the server, as well as various reports to show you top queries, blocked sessions etc. Those are quite useful surely, but what we need is someone telling us exactly what is wrong with the query or what is wrong with a particular WAIT or what is really wrong with some graph that looks high. For ex, on the Top IO query report, it would be useful to know what part of the query is causing high IO. Is there a table scan? Index scan? Similarly, on the blocked session report, it would be useful to know who is blocking who. SSPD tries to make it painless for us by telling us exactly what is wrong. Moreover, it is available as a website, readily available without having to launch SQL Server Management Studio and running the reports. Also SSPD refreshes real time, showing you the latest state of the server every 5-10 seconds.
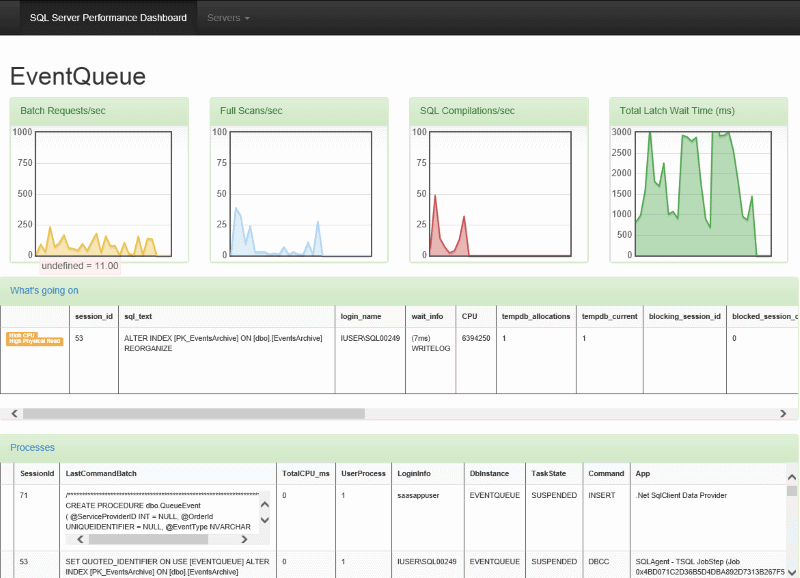
What's happening on the server now?
SSPD uses some custom made scripts to query the DMVs and then make sense out of it. For ex, let's look at the first one: "What's going on." It shows you near real-time view of what queries are running at this moment, and it will also tell you what is really bad about the queries:
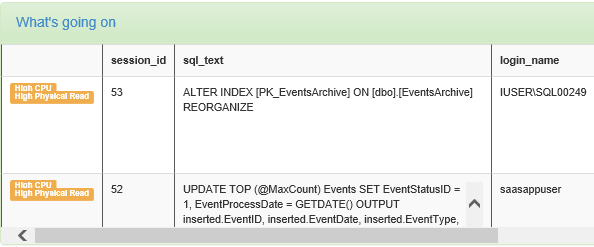
It uses the famous Who is Active script made by Adam Machanic, that gives a very informative view of what is currently happening on the server.
Once it pulls the output, it binds to a DataGrid and for each row, and then it checks if there's something off the chart:
<asp:GridView CssClass="table table-striped" ID="GridView1" runat="server" DataSourceID="sqlDataSource" EnableModelValidation="True">
	<Columns>
		<asp:TemplateField>
			<ItemTemplate>
				<%# Convert.ToDecimal(Eval("CPU")) > 1000 ? "<span class='label label-warning'>High CPU</span>" : "" %>
				<%# Convert.ToDecimal(Eval("physical_reads")) > 1000 ? "<span class='label label-warning'>High Physical Read</span>" : "" %>
			</ItemTemplate>
		</asp:TemplateField>
	</Columns>
	<EmptyDataTemplate>
		No Query running at the moment.
	</EmptyDataTemplate>
</asp:GridView>
Here you see, it looks at specific values and if the values are unusually high, it injects a warning label. This saves you from scanning through the output to see if something is off. You can easily set the threshold values you want and get instant warning labels on the screen.
Wherever you see a query, you can click on it to view the full details.

Most expensive queries
This is probably the most useful one for day to day monitoring. It queries the cached plan for the queries SQL Server has run since it was last restarted or DBCC FREEPROCCACHE was called. Then it shows you not just the most expensive query, but also exactly what part of the query is causing the problem. You can see the WHERE clause that is causing the highest IO load.
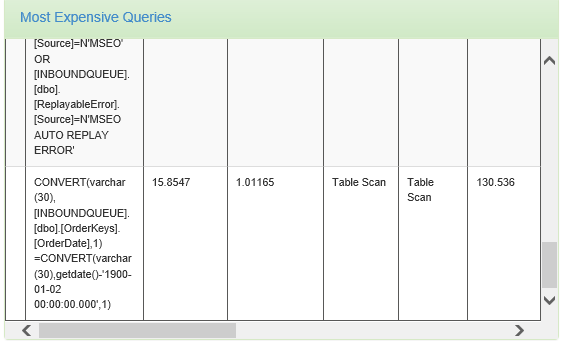
Here you can see some table scan going on. You can also see the part of the WHERE clause that is causing the table scan. If you click on the query (scrolling right), it will show the full query.
Expensive stored proc
Next one is the Expensive Stored Proc view, which shows you the most expensive stored procs in terms of CPU or IO.
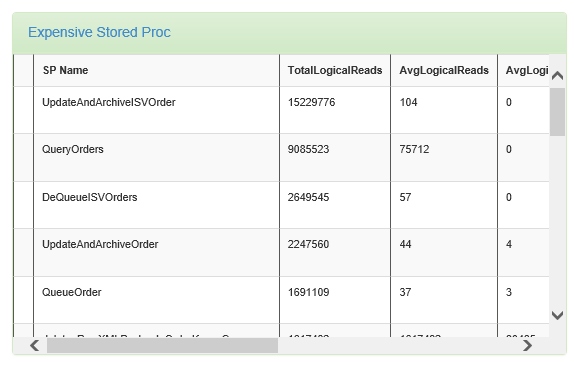
You can see here the AvgLogicalReads for QueryOrders is very high. That stored proc is killing the database.
How it works
Look ma, no AJAX!
You will notice that the panels are refreshing periodically. You might think I am using AJAX to call some serverside web service in order to get JSON/XML response, and then use some jQuery template to render the html output. Nope. I am using what our ancestors have happily used for generations. The natural, organic IFRAME solution, with no side effect. The html output for each panel comes from individual ASP.NET pages, via IFRAMEs and then they get injected into a DIV on the main Dashboard page.
There are several benefits to this approach:
- The widgets are individual pages, which user can browse directly in full browser view.
- Each widget is a plain ASP.NET page. No need to build webservices to return data in JSON/XML format. No need for any entity classes either that you usually use to serialize into JSON/XML.
- The HTML content is generated server side, using regular ASP.NET. Thus there's no need to use any Javascript based HTML templating library.
- As there's no need for AJAX or html templating, there's no need to worry about jQuery or its plugin breaking compatibility in new versions, and updating javascript libraries regularly.
Let's see how to do this. First the HTML markup to draw the panels:
<div class="row">
	<div class="panel panel-success">
		<div class="panel-heading"><a href="WhoIsActive.aspx?c=<%= ConnectionString %>">What's going on</a></div>
		<div class="panel-body panel-body-height" id="WhoIsActive">
			<div class="progress">
				<div class="progress-bar progress-bar-striped" style="width: 60%"><span class="sr-only">100% Complete</span></div>
			</div>
		</div>
		<iframe class="content_loader" onload="setContent(this, 'WhoIsActive')" src="WhoIsActive.aspx?c=<%= ConnectionString %>" style="width: 100%; height: 100%; border: none; display: none" frameborder="0"></iframe>
	</div>
</div>
This is the markup taken from the Twitter Bootstrap theme.
You will notice there's an invisible IFRAME there. When the IFRAME loads, it calls the setContent function. That function takes the whole content of the IFRAME and injects inside the panel-body div.
function setContent(iframe, id) {
        ...
        $('#' + id)
            .html($(iframe).contents().find("form").html())
            .dblclick(function () {
                iframe.contentWindow.location.reload();
            })
            ...
    }
There you go, clean AJAX-like solution without any AJAX: no XMLHTTP, no JSON plumbing, no HTML templating, no server-side webservice.
Now this would not work for any event handler that is hooked inside the IFRAME. So, how does the click on a query show the popup window with the full query? Also if it was an IFRAME, shouldn't the popup actually come inside the IFRAME?
The click functionality is done on the main Dashboard page. After injecting the content into the DIV, it hooks the click handlers that shows the popup on the main page:
function setContent(iframe, id) {
    $('#' + id)
        .find('td.large-cell').off('click');

    if ($('#' + id).scrollLeft() == 0) {
        $('#' + id)
            .html($(iframe).contents().find("form").html())
            .dblclick(function () {
                iframe.contentWindow.location.reload();
            })
            .find('td.large-cell').find('div').click(function () {
                $('#content_text').text($(this).html());
                $('#basic-modal-content').modal();
            });
    }
Here's it looks for any
having the class large-cell. It then hooks the click even on it and shows the modal dialog box. The modal dialog box is from Eric Martin's SimpleModal plugin.Plotting the charts
The chart uses the jQuery plugin Flot to render some of the performance counters as running charts.
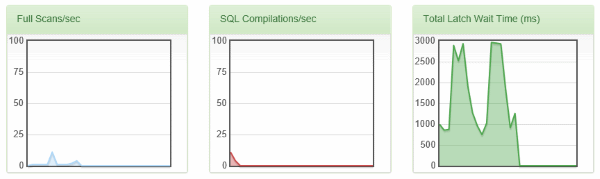
There's a PerformanceCounter.aspx which is responsible for rendering the table showing the performance counters. It picks some important counters, and marks them to appear on the chart. First it runs through the table, looking for the counters, and marks the label of the counter as x-axis and value of the counter as y-axis:
var plot = ["Batch Requests/sec", "Full Scans/sec", "SQL Compilations/sec", "Total Latch Wait Time (ms)"];
$('td').each(function (i, e) {
    td = $(e);
    if (td.text().trim().length > 0) {
        for (var i = 0; i < plot.length; i ++) {
            if (plot[i] == td.text().trim()) {
                if (td.prev().text() == "_Total" || td.prev().text().trim().length == 0) {
                    td.addClass("x-axis");
                    td.next().addClass("y-axis");
                }
            }
        }
    }
})
Now this page is hosted on the Dashboard page inside an IFRAME. So, the Dashboard page scans the IFRAME content, looks for these labels, picks their values and passes to the Flot chart plugin:
$(iframe).contents().find("form").find(".x-axis").each(function (i, e) {
    var x = $(e);
    var y = x.next('.y-axis');
    var xname = x.text();
    var yvalue = parseInt(y.text());
    if (datasets[xname]) {
        var data = datasets[xname].data;

        data.pop();

        data.splice(0, 0, yvalue);
    }
});
Rest of the job of updating the Flot chart is done by the usual Flot code:
function updatePlot() {
    var index = 0;

    $.each(datasets, function (key, val) {
        var items = [];
        for (var i = 0; i < val.data.length; i++)
            items.push([i, val.data[i]]);

        var data = { color: val.color, data: items };

        if (plots[index] != null) {
            plot = plots[index];
            plot.setData([data]);
            plot.draw();
        }
        else {
            plot = $.plot("#placeholder" + (index + 1), [data], {
                series: {
                    //shadowSize: 0	// Drawing is faster without shadows
                },
                lines: { show: true, fill: true },
                grid: {
                    hoverable: true,
                    clickable: true
                },
                yaxis: {
                    min: 0,
                    max: val.ymax
                },
                xaxis: {
                    show: false
                }
            });
That's it! Again, no AJAX, no webservice, no html templating, no JSON plubing. Pure organic IFRAME and html.
Conclusion
SSPD tries to make it easy for us to monitor SQL Server health. It gives meainingful information out of the verbose data produced by SQL Server's built-in views. It shows you exactly where the problem is. You can customize the code anyway you like, adding your own warnings, own thresholds, and make it suit your specific need.