DeepSpace2 / Styleframe
Programming Languages
Projects that are alternatives of or similar to Styleframe


StyleFrame
Exporting DataFrames to a styled Excel file has never been so easy
A library that wraps pandas and openpyxl and allows easy styling of dataframes in Excel.
Contents
- Rationale
- Installation
- Basics
-
Usage Examples
- Simple Example
- Advance Example - Commandline Interface
- Buy me a Pizza
Rationale
Pandas's DataFrame is great.
Dealing with a lot of data is not easy and DataFrame helps us to manage it in the best way possible.
There are many ways to present the output and one of them is excel files.
Excel files are easy to understand, can be viewed offline, can be sent over the email
and a large percentage of the population familiar with it.
That is why many times we would choose excel files as our output.
StyleFrame package allows us to design the excel file on the data in a similar way to DataFrame api.
It saves us the trouble of working with excel workbook and the suffering of trying to match it with the data stored in our DataFrame.
Installation
$ pip install styleframe
Basics
- Styler:
__init__(self, bg_color=None, bold=False, font=utils.fonts.arial, font_size=12, font_color=None,
         number_format=utils.number_formats.general, protection=False, underline=None,
         border_type=utils.borders.thin, horizontal_alignment=utils.horizontal_alignments.center,
         vertical_alignment=utils.vertical_alignments.center, wrap_text=True, shrink_to_fit=True,
         fill_pattern_type=utils.fill_pattern_types.solid, indent=0,
         comment_author=None, comment_text=None, text_rotation=0)
Object that represents the style of a cell in our excel file.
Styler is responsible of storing the style of single cell.
Once the style is ready, .to_openpyxl_style() method is called.
- utils:
from styleframe import utils
Before you start to style your StyleFrame, take a look in the utils module. You may find there very useful things such as number formats, colors, borders and more!
- Container:
__init__(self, value, styler=None)
Object that represents cell in our excel file.
it contains two variables:
- value which may be anything you wish to put in the cell as long as excel file support its format.
- style which is the style of the cell- created by Styler(...).to_openpyxl_style()
And finally:
- StyleFrame:
__init__(self, obj, styler_obj=None):
StyleFrame is the main object we will be dealing with.
It contains self DataFrame which is based on the given obj.
Each item of the self DataFrame is wrapped by a Container object to store the given data and its` style.
StyleFrame (usually referred as sf) reveals a very easy api for styling.
Usage Examples
Simple Example
import pandas as pd
from styleframe import StyleFrame, Styler, utils
df = pd.DataFrame({
'Time': [1.496728e+09, 1.496728e+09, 1.496728e+09, 1.496728e+09, 1.496728e+09],
'Expect': ['Hey', 'how', 'are', 'you', 'today?'],
'Actual': ['Hello', 'how', 'are', 'u', 'today?'],
'Pass/Fail': ['Failed', 'Passed', 'Passed', 'Failed', 'Passed']
},
columns=['Time', 'Expect', 'Actual', 'Pass/Fail'])
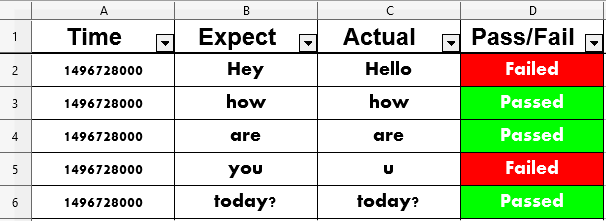
"""Our DataFrame looks like this:
Time Expect Actual Pass/Fail
0 1.496728e+09 Hey Hello Failed
1 1.496728e+09 how how Passed
2 1.496728e+09 are are Passed
3 1.496728e+09 you u Failed
4 1.496728e+09 today? today? Passed
"""
# Create StyleFrame object that wrap our DataFrame and assign default style.
default_style = Styler(font=utils.fonts.aharoni, font_size=14)
sf = StyleFrame(df, styler_obj=default_style)
# Style the headers of the table
header_style = Styler(bold=True, font_size=18)
sf.apply_headers_style(styler_obj=header_style)
# Set the background color to green where the test marked as 'passed'
passed_style = Styler(bg_color=utils.colors.green, font_color=utils.colors.white)
sf.apply_style_by_indexes(indexes_to_style=sf[sf['Pass/Fail'] == 'Passed'],
cols_to_style='Pass/Fail',
styler_obj=passed_style,
overwrite_default_style=False)
# Set the background color to red where the test marked as 'failed'
failed_style = Styler(bg_color=utils.colors.red, font_color=utils.colors.white)
sf.apply_style_by_indexes(indexes_to_style=sf[sf['Pass/Fail'] == 'Failed'],
cols_to_style='Pass/Fail',
styler_obj=failed_style,
overwrite_default_style=False)
# Change the columns width and the rows height
sf.set_column_width(columns=sf.columns, width=20)
sf.set_row_height(rows=sf.row_indexes, height=25)
sf.to_excel('output.xlsx',
# Add filters in row 0 to each column.
row_to_add_filters=0,
# Freeze the columns before column 'A' (=None) and rows above '2' (=1).
columns_and_rows_to_freeze='A2').save()
The final output saved under output.xlsx:
Advance Example
First, let us create a DataFrame that contains data we would like to export to an .xlsx file
from datetime import date
import pandas as pd


columns = ['Date', 'Col A', 'Col B', 'Col C', 'Percentage']
df = pd.DataFrame(data={'Date': [date(1995, 9, 5), date(1947, 11, 29), date(2000, 1, 15)],
                        'Col A': [1, 2004, -3],
                        'Col B': [15, 3, 116],
                        'Col C': [33, -6, 9],
                        'Percentage': [0.113, 0.504, 0.005]},
                  columns=columns)

only_values_df = df[columns[1:-1]]

rows_max_value = only_values_df.idxmax(axis=1)

df['Sum'] = only_values_df.sum(axis=1)
df['Mean'] = only_values_df.mean(axis=1)

"""Our DataFrame looks like this:

         Date  Col A  Col B  Col C  Percentage   Sum        Mean
0  1995-09-05      1     15     33       0.113    49   16.333333
1  1947-11-29   2004      3     -6       0.504  2001  667.000000
2  2000-01-15     -3    116      9       0.005   122   40.666667

"""
Now, once we have the DataFrame ready, lets create a StyleFrame object
from styleframe import StyleFrame

sf = StyleFrame(df)
# it is also possible to directly initiate StyleFrame
sf = StyleFrame({'Date': [date(1995, 9, 5), date(1947, 11, 29), date(2000, 1, 15)],
                 'Col A': [1, 2004, -3],
                 'Col B': [15, 3, 116],
                 'Col C': [33, -6, 9],
                 'Percentage': [0.113, 0.504, 0.005],
                 'Sum': [49, 2001, 122],
                 'Mean': [16.333333, 667.000000, 40.666667]})
The StyleFrame object will auto-adjust the columns width and the rows height but they can be changed manually
sf.set_column_width_dict(col_width_dict={
    ('Col A', 'Col B', 'Col C'): 15.3,
    ('Sum', 'Mean'): 30,
    ('Percentage', ): 12
})

# excel rows starts from 1
# row number 1 is the headers
# len of StyleFrame (same as DataFrame) does not count the headers row
all_rows = sf.row_indexes
sf.set_row_height_dict(row_height_dict={
    all_rows[0]: 45,  # headers row
    all_rows[1:]: 25
})
Applying number formats
from styleframe import Styler, utils


sf.apply_column_style(cols_to_style='Date',
                      styler_obj=Styler(number_format=utils.number_formats.date,
                                        font=utils.fonts.calibri,
                                        bold=True))

sf.apply_column_style(cols_to_style='Percentage',
                      styler_obj=Styler(number_format=utils.number_formats.percent))

sf.apply_column_style(cols_to_style=['Col A', 'Col B', 'Col C'],
                      styler_obj=Styler(number_format=utils.number_formats.thousands_comma_sep))
Next, let's change the background color of the maximum values to red and the font to white
we will also protect those cells and prevent the ability to change their value
style = Styler(bg_color=utils.colors.red,
               bold=True,
               font_color=utils.colors.white,
               protection=True,
               underline=utils.underline.double,
               number_format=utils.number_formats.thousands_comma_sep).to_openpyxl_style()

for row_index, col_name in rows_max_value.iteritems():
    sf[col_name][row_index].style = style
And change the font and the font size of Sum and Mean columns
sf.apply_column_style(cols_to_style=['Sum', 'Mean'],
                      style_header=True,
                      styler_obj=Styler(font_color='#40B5BF',
                                        font_size=18,
                                        bold=True))
Change the background of all rows where the date is after 14/1/2000 to green
sf.apply_style_by_indexes(indexes_to_style=sf[sf['Date'] > date(2000, 1, 14)],
                          cols_to_style='Date',
                          styler_obj=Styler(bg_color=utils.colors.green,
                                            number_format=utils.number_formats.date,
                                            bold=True))
Finally, let's export to Excel but not before we use more of StyleFrame's features:
- Change the page writing side
- Freeze rows and columns
- Add filters to headers
ew = StyleFrame.ExcelWriter('sf tutorial.xlsx')
sf.to_excel(excel_writer=ew,
            sheet_name='1',
            right_to_left=False,
            columns_and_rows_to_freeze='B2', # will freeze the rows above 2 (=row 1 only) and columns that before column 'B' (=col A only)
            row_to_add_filters=0,
            allow_protection=True)
Adding another excel sheet
other_sheet_sf = StyleFrame({'Dates': [date(2016, 10, 20), date(2016, 10, 21), date(2016, 10, 22)]},
                            styler_obj=Styler(number_format=utils.number_formats.date))

other_sheet_sf.to_excel(excel_writer=ew, sheet_name='2')
Don't forget to save
ew.save()
the result: Sheet 1:

Sheet 2:

Note that Sheet 1 is protected:

Commandline Interface
General Information
Starting with version 1.1 StyleFrame offers a commandline interface that lets you create an xlsx file from a json file.
Usage
-v Displays the installed versions of StyleFrame and its dependencies.
--json_path Path to the json file.
--output_path Path to the output xlsx file. If not provided defaults to output.xlsx.
Usage Examples:
$ styleframe --json_path data.json --output_path data.xlsx
JSON Format
The input JSON should be thought of as an hierarchy of predefined entities,
some of which correspond to a Python class used by StyleFrame.
The top-most level should be a list of sheet entities (see below).
An example JSON is available here.
- style:
Corresponds to: Styler class.
This entity uses the arguments of Styler.__init__() as keys.
Any missing keys in the JSON will be given the same default values.
"style": {"bg_color": "yellow", "bold": true}
- cell
This entity represents a single cell in the sheet.
Required keys:
"value" - The cell's value.
Optional keys:
"style" - The style entity for this cell.
If not provided, the style provided to the coloumn entity will be used.
If that was not provided as well, the default Styler.__init__() values will be used.
{"value": 42, "style": {"border": "double"}}
- column
This entity represents a column in the sheet.
Required keys:
"col_name" - The column name.
"cells" - A list of cell entities.
Optional keys:
"style" - A style used for the entire column. If not provided the default Styler.__init__() values will be used.
"width" - The column's width. If not provided Excel's default column width will be used.
- sheet
This entity represents the whole sheet.
Required keys:
"sheet_name" - The sheet's name.
"columns" - A list of column entities.
Optional keys:
"default_styles" - A JSON object with items as keys and style entities as values.
Currently only headers is supported as an item.
"default_styles": {"headers": {"bg_color": "blue"}}
"row_heights" - A JSON object with rows indexes as keys and heights as value.
"extra_features" - A JSON that contains the same arguments as the
to_excel method, such as "row_to_add_filters", "columns_and_rows_to_freeze",
"columns_to_hide", "right_to_left" and "allow_protection".
You can also use other arguments that Pandas' "to_excel" accepts.
Refer to the documentation for more information.
Buy me a Pizza
You made it all the way down here, cool! If you love StyleFrame and want to show your appreciation, consider buying me a slice of Pizza (or even just drop a comment). Anything will be greatly appreciated 🙂
