ajyoon / Systemf
Programming Languages
systemf
a brainfuck interpreter supporting Linux syscalls
brainfuck is awesome, but per spec it's only able to interact with the real world via STDIN and STDOUT.
By extending the language with a special character % which executes a syscall, we can
do a whole lot more with it while having all the "fun" of working in the language.
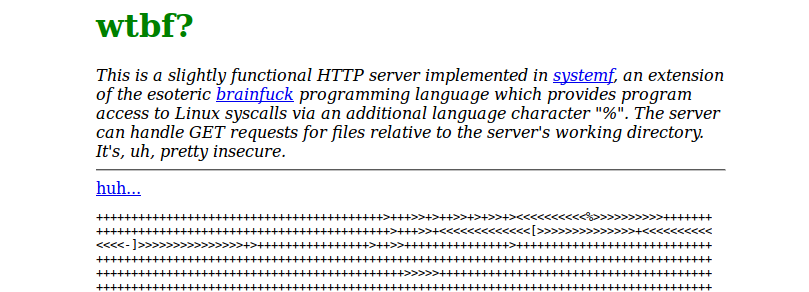
This lets us do lots of cool things like
write an HTTP server in brainfuck:
Building:
The interpreter is written in NASM x86-64 assembly. You'll need NASM to build, and if your architecture is not x86-64 you will need to use an emulator or similar solution. Otherwise, it's as easy as:
make [build || debug || clean]
To run, call the binary on a brainfuck file:
./bin/systemf examples/hello_world.bf
Hello, World!
Interpreter rules
This interpreter features a full implementation of the brainfuck programming language. The default settings for language-unspecified rules are:
- Each cell in the program arena is a single byte with possible values 0-255
- Cell values wrap automatically between their min (0) and max (255) values
- The program arena consists of 30000 cells
- Attempting to move the cell pointer below 0 or above 29999 results in a bounds error,
and will crash the program with exit code
2 - Mismatched brackets will cause a crash with exit code
1
Syscalls
To make a syscall in brainfuck programs, this implementation introduces an
additional language character: %. When this character is encountered in
a program, the interpreter does the following:
- The value at the current cell is considered the syscall code
- The following cell is considered the number of arguments
- The following cells outline arguments in the following form:
- One cell is a flag for what type of argument this is, where 0 indicates a regular argument, 1 indicates a pointer to the argument contents in memory, and 2 indicates a pointer to a given cell number.
- One cell indicates the cell length of the argument
- The following cells indicate the argument contents. Multi-cell arguments are interpreted as bytes in big-endian form.
- The syscall is made, and its return value is dumped to the current cell.
For example, to call sys-exit, we can give the following code:
++++++[>++++++++++<-]>  Write code 60 (sys exit) in cell1

>                       move to cell2
+                       Write argument count of 1 to cell2

>                       move to cell3
(leave 0)               Write first arg type as normal

>                       move to cell4
+                       Write first arg cell length of 1 to cell3

>                       move to cell5
+++                     Write exit code 3 in cell4

<<<<                    move back to cell1
%                       Call kernel
This will trigger a program exit with exit code 3:
$ ./bin/systemf examples/syscall_simple.bf
$ echo $?
3
We can use cell pointers to tell the kernel to write side effect data
directly into our program tape. For example, system read() takes in
its second argument a pointer to a buffer. To implement this in systemf
we can pass a cell pointer instead and flag it as such:
Read 5 bytes from stdin into cells 28 to 32 and print them out

  (0) >  Syscall code 0 for read()
  +++ >  Arg count 3

Arg 0~file descriptor  ================================

  (0) >  Arg type:    Normal
  +   >  Cell length: 1
  (0) >  Content:     File descriptor 0 for STDIN

Arg 1~write buffer  ===================================

  ++ >   Arg type:    Cell pointer
  + >    Cell length: 1
  +++++++
  +++++++
  +++++++
  +++++++ >  Content: Target cell 28

Arg 2~read byte count ==================================

  (0) > Arg type:    Normal
  + >   Cell length: 1
  +++++ Content:     read byte count 5

Return to cell 0 and execute
  <<<<<<<<<<
  %

5 input characters are taken and stored in cells 28 to 32
Let's prove it:

Go to cell 28
  >>>>>>>>>>>>>>>>>>>>>>>>>>>>
Print those contents out!
  .>.>.>.>.>
And in execution...
systemf$ ./bin/systemf examples/syscall_read.bf
12345
12345systemf$
Other goodies
While the interpreter does not come with built-in debugging abilities, running the interpreter from GDB makes debugging quite manageable.
The interpreter offers a special pseudo-instruction $ which does nothing
except run a no-op on a label that makes it easy to attach a GDB breakpoint
at specific locations in your program.
Say you have the following brainfuck program and you want to know
exactly where you are landing after the [<] loop:
+ > + > + >
++++++++++
++++++++++
++++++++++
++++++++++
++++++++++
++++++++++
++++++++++ >

(0) > + > + > + > +

[<]

<

.
By placing a $ symbol after the [<] line and attaching a GDB breakpoint
to BF_DEBUGGING_BREAK, we can thoroughly examine the program state at
that moment:
systemf$ gdb ./bin/systemf
...
Reading symbols from ./bin/systemf...done.
(gdb) break BF_DEBUGGING_BREAK
Breakpoint 1 at 0x4002ef: file src/systemf.asm, line 197.
(gdb) run examples/breakpoint_helper.bf
Starting program: ~/systemf/bin/systemf examples/breakpoint_helper.bf

Breakpoint 1, BF_DEBUGGING_BREAK () at src/systemf.asm:197
197       nop
(gdb) info reg r15              #  <-- The interpreter position in the source file (by char)
r15            0xb3     179
(gdb) info reg r13              #  <-- A pointer to the current cell in the program
r13            0x619700 6395648
(gdb) x/32ub &tape              #  <-- View program tape state (be sure to view in "ub" mode)
0x6196fc <tape>:        1       1       1       70      0       1       1       1
0x619704:       1       0       0       0       0       0       0       0
0x61970c:       0       0       0       0       0       0       0       0
0x619714:       0       0       0       0       0       0       0       0
In debugging syscalls it is often useful to view the register states immediately before
calling. To do this simply drop a breakpoint toward the end of the sysCallExecute label
and examine the register state in GDB with info registers


