All Projects → loony-bean → textplots-rs

loony-bean / textplots-rs

Licence: other
Terminal plotting library for Rust

Programming Languages

rust
11053 projects
shell
77523 projects

Projects that are alternatives of or similar to textplots-rs

trase
📊 A lightweight plotting library
Stars: ✭ 75 (-36.44%)
Mutual labels:  plotting
pitchplots
Plotting library for note distributions in different representations of tonal space
Stars: ✭ 17 (-85.59%)
Mutual labels:  plotting
spacegrids
Analyze spatial Netcdf data: "Numpy on grids" (Python module)
Stars: ✭ 14 (-88.14%)
Mutual labels:  plotting
expyplot
Matplotlib for Elixir
Stars: ✭ 27 (-77.12%)
Mutual labels:  plotting
pyx
Repository of PyX, a Python package for the creation of PostScript, PDF, and SVG files.
Stars: ✭ 71 (-39.83%)
Mutual labels:  plotting
AlphaPlot
📈 Application for statistical analysis and data visualization which can generate different types of publication quality 2D and 3D plots with extensive visual customization.
Stars: ✭ 140 (+18.64%)
Mutual labels:  plotting
BeautifulMakie
https://lazarusa.github.io/BeautifulMakie/
Stars: ✭ 281 (+138.14%)
Mutual labels:  plotting
CircuitPython-online-IDE
CircuitPython online IDE
Stars: ✭ 15 (-87.29%)
Mutual labels:  plotting
ggshakeR
An analysis and visualization R package that works with publicly available soccer data
Stars: ✭ 69 (-41.53%)
Mutual labels:  plotting
geneview
Genomics data visualization in Python by using matplotlib.
Stars: ✭ 38 (-67.8%)
Mutual labels:  plotting
trame
Trame let you weave various components and technologies into a Web Application solely written in Python.
Stars: ✭ 50 (-57.63%)
Mutual labels:  plotting
SciPlot-PyQt
A Matplotlib-wrapped user-interface for creating and editing publication-ready images and plots
Stars: ✭ 32 (-72.88%)
Mutual labels:  plotting
napari-clusters-plotter
A plugin to use with napari for clustering objects according to their properties.
Stars: ✭ 18 (-84.75%)
Mutual labels:  plotting
svg plot
Plot data in SVG format using C++ (header only) library .
Stars: ✭ 20 (-83.05%)
Mutual labels:  plotting
cplot
🌈 Plot complex functions
Stars: ✭ 75 (-36.44%)
Mutual labels:  plotting
planetMagFields
Routines to plot magnetic fields of planets in our solar system
Stars: ✭ 27 (-77.12%)
Mutual labels:  plotting
sr graph
A simple, one-file, header-only, C++ utility for graphs, curves and histograms.
Stars: ✭ 67 (-43.22%)
Mutual labels:  plotting
microfilm
Creating figures and animations for multi-channel images with a focus on microscopy.
Stars: ✭ 22 (-81.36%)
Mutual labels:  plotting
pyjuque
⚡ Open Source Algorithmic Trading Bot for Python.
Stars: ✭ 318 (+169.49%)
Mutual labels:  plotting
EEGEdu
Interactive Brain Playground - Browser based tutorials on EEG with webbluetooth and muse
Stars: ✭ 91 (-22.88%)
Mutual labels:  plotting

textplots Crates.io

Terminal plotting library for using in Rust CLI applications. Should work well in any unicode terminal with monospaced font.

It is inspired by TextPlots.jl which is inspired by Drawille.

Currently it features only drawing line charts on Braille canvas, but could be extended to support other canvas and chart types just like UnicodePlots.jl or another cool terminal plotting library.

Contributions are very much welcome!

Usage

Using as a library

use textplots::{Chart, Plot, Shape};

fn main() {
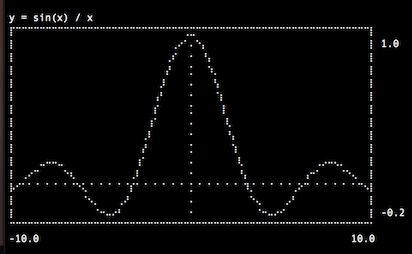
    println!("y = sin(x) / x");

    Chart::default()
        .lineplot(&Shape::Continuous(Box::new(|x| x.sin() / x)))
        .display();
}

Using as a binary

$ textplots '10*x + x^2 + 10*sin(x)*abs(x)' --xmin=-20 --xmax=20

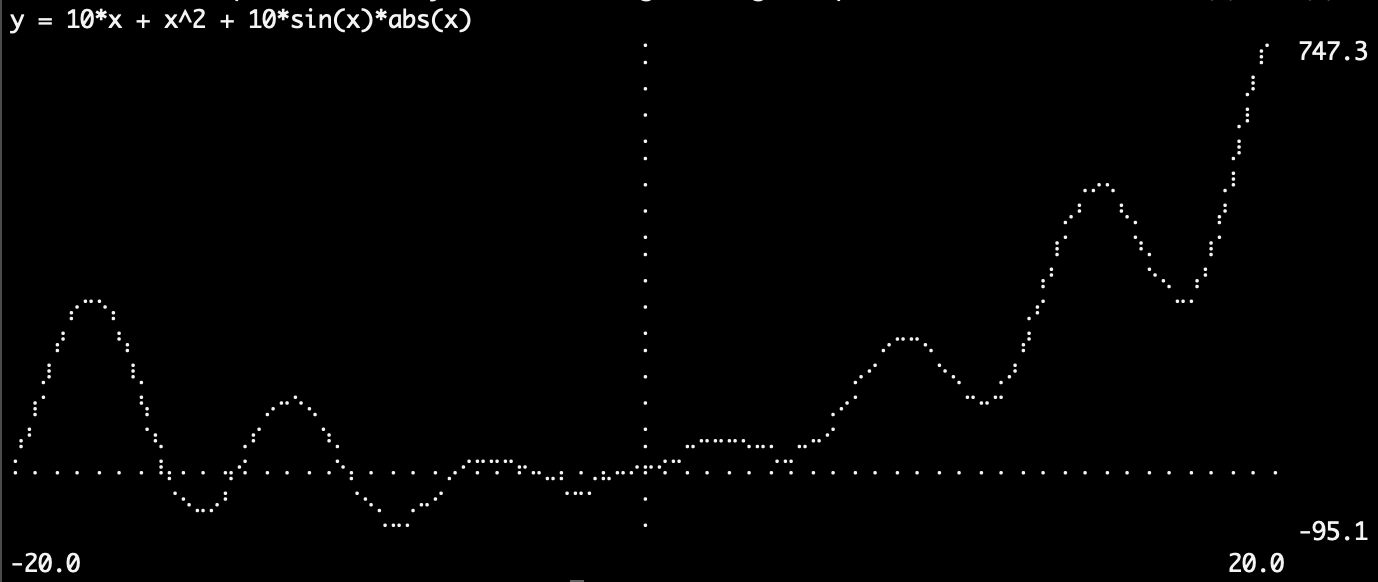
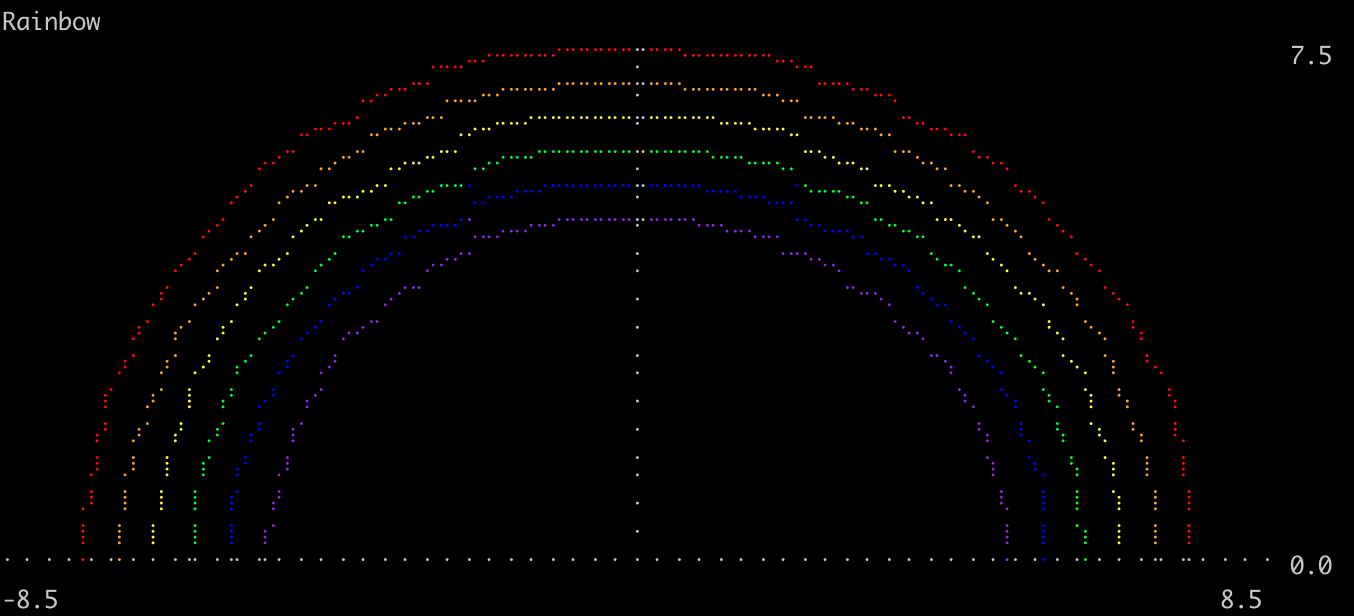
Bonus! Colored plots (see examples)

Note that the project description data, including the texts, logos, images, and/or trademarks, for each open source project belongs to its rightful owner. If you wish to add or remove any projects, please contact us at [email protected].