All Projects → sni → Thruk

sni / Thruk

Licence: other
Thruk is a multibackend monitoring webinterface for Naemon, Nagios, Icinga and Shinken using the Livestatus API.

Programming Languages

perl
6916 projects

Projects that are alternatives of or similar to Thruk

Check docker
Nagios plugin to check docker containers
Stars: ✭ 113 (-68.35%)
Mutual labels:  monitoring, nagios, icinga
Sakuli
Sakuli is an end-2-end testing and monitoring tool for web sites and common UIs with multiple monitoring integrations
Stars: ✭ 115 (-67.79%)
Mutual labels:  monitoring, nagios, icinga
Thola
Tool for monitoring and provisioning network devices (mainly using SNMP) - monitoring check plugin
Stars: ✭ 179 (-49.86%)
Mutual labels:  monitoring, nagios, icinga
check netscaler
A Nagios Plugin written in Perl for the Citrix ADC (formerly Citrix NetScaler). It uses the NetScaler NITRO API.
Stars: ✭ 36 (-89.92%)
Mutual labels:  nagios, icinga
Wgcloud
linux运维监控工具,支持系统信息,内存,cpu,温度,磁盘空间及IO,硬盘smart,系统负载,网络流量等监控,API接口,大屏展示,拓扑图,进程监控,端口监控,docker监控,文件防篡改,日志监控,数据可视化,web ssh,堡垒机,指令下发批量执行,linux面板,探针,故障告警
Stars: ✭ 2,669 (+647.62%)
Mutual labels:  monitoring, nagios
Icingaweb2 Module Grafana
Grafana module for Icinga Web 2 (supports InfluxDB & Graphite)
Stars: ✭ 190 (-46.78%)
Mutual labels:  monitoring, icinga
check-ssl
Check the expiration date of your ssl-cert with bash (implemented for Nagios/Icinga)
Stars: ✭ 14 (-96.08%)
Mutual labels:  nagios, icinga
nagmapReborn
Nagmap Reborn - Standalone integration with some server monitoring systems providing a user-friendly interface through geographic visualization.
Stars: ✭ 19 (-94.68%)
Mutual labels:  nagios, icinga
Awesome Monitoring
INFRASTRUCTURE、OPERATION SYSTEM and APPLICATION monitoring tools for Operations.
Stars: ✭ 356 (-0.28%)
Mutual labels:  monitoring, nagios
grafana-pnp-datasource
PNP4Nagios/RRD Datasource for Grafana
Stars: ✭ 27 (-92.44%)
Mutual labels:  nagios, icinga
nagiosplugin
A Python class library which helps with writing Nagios (Icinga) compatible plugins.
Stars: ✭ 19 (-94.68%)
Mutual labels:  nagios, icinga
nagios-plugins-openshift
Nagios/Icinga 2 Plugins for monitoring OpenShift clusters
Stars: ✭ 24 (-93.28%)
Mutual labels:  nagios, icinga
Icinga2
Icinga is a monitoring system which checks the availability of your network resources, notifies users of outages, and generates performance data for reporting.
Stars: ✭ 1,670 (+367.79%)
Mutual labels:  monitoring, icinga
Nagios Plugins Rabbitmq
A set of nagios checks for RabbitMQ using the management interface
Stars: ✭ 194 (-45.66%)
Mutual labels:  monitoring, nagios
Nagstamon
Nagios status monitor for your desktop.
Stars: ✭ 270 (-24.37%)
Mutual labels:  nagios, icinga
check clever tanken
Benzinpreis-Monitoring mit Icinga 2 || Kraftstoffmonitoring
Stars: ✭ 21 (-94.12%)
Mutual labels:  nagios, icinga
Icingaweb2
A lightweight and extensible web interface to keep an eye on your environment. Analyse problems and act on them.
Stars: ✭ 665 (+86.27%)
Mutual labels:  monitoring, icinga
Openitcockpit
openITCOCKPIT is an Open Source system monitoring tool built for different monitoring engines like Nagios, Naemon and Prometheus.
Stars: ✭ 108 (-69.75%)
Mutual labels:  monitoring, nagios
Monitoring-Livestatus
Livestatus Perl API to access runtime data from Nagios, Naemon, Icinga and Shinken.
Stars: ✭ 26 (-92.72%)
Mutual labels:  nagios, icinga
lmd
Livestatus Multitool Daemon - Create livestatus federation from multiple sources
Stars: ✭ 38 (-89.36%)
Mutual labels:  nagios, icinga

Thruk - Monitoring Webinterface

Thruk is a multibackend monitoring webinterface which currently supports Naemon, Icinga, Shinken and Nagios as backend using the Livestatus API. It is designed to be a 'dropin' replacement and covers the original features plus adds additional enhancements for large installations, increased usability and many usefull addons.

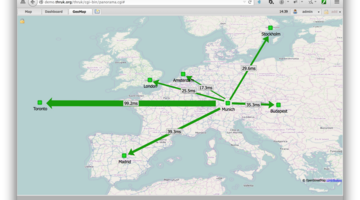
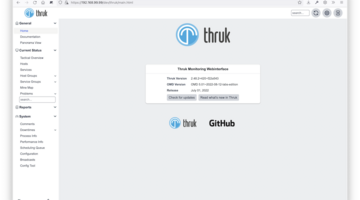
Thruk Startpage Thruk Panorama See more screenshots...

Documentation

All documentation is under docs/

Support

Main Features / Advantages

  • Multiple backends
  • Faster while using less CPU
  • Displays live data, no delay between core and GUI
  • Clusterable, can be clustered over hosts
  • Business Process Addon
  • Advanced status filters
  • Extended logfile search
  • Multiple themes included
  • Excel export for status and logfiles
  • Adjustable side menu
  • Full expanded plugin commandline for easy testing
  • Save searches in personal bookmarks
  • Config Tool included
  • Mobile interface included
  • SLA Reports in PDF format
  • Recurring Downtimes
  • Fully Featured Dashboard
  • Independant from monitoring core, can be installed on remote host
  • Easy to extend with plugins

License

Thruk is Copyright (c) 2009-2019 by Sven Nierlein and others. This is free software; you can redistribute it and/or modify it under the same terms as the Perl5 programming language system itself:

a) the "Artistic License 1.0" as published by The Perl Foundation http://dev.perl.org/licenses/artistic.html

b) the GNU General Public License as published by the Free Software Foundation; either version 1 http://www.gnu.org/licenses/gpl-1.0.html or (at your option) any later version

SPDX-License-Identifier: Artistic-1.0-Perl OR GPL-1.0-or-later

Vendor specific libraries below ./root/thruk/vendor/ may have different licenes. See THANKS file for details.

Note that the project description data, including the texts, logos, images, and/or trademarks, for each open source project belongs to its rightful owner. If you wish to add or remove any projects, please contact us at [email protected].