All Projects → DavidBuchanan314 → trumpogram

DavidBuchanan314 / trumpogram

Licence: MIT License
The World, according to Donald Trump

Programming Languages

python
139335 projects - #7 most used programming language
shell
77523 projects

Labels

Projects that are alternatives of or similar to trumpogram

vioplot
Development version of vioplot R package (CRAN maintainer)
Stars: ✭ 25 (+56.25%)
Mutual labels:  dataviz
gephi-tutorials
Open and collaborative tutorials for Gephi
Stars: ✭ 97 (+506.25%)
Mutual labels:  dataviz
dataviz
Course materials for Kieran Healy's rstudio::conf 2020 data visualization workshop
Stars: ✭ 75 (+368.75%)
Mutual labels:  dataviz
monopticon
Monitor ethernet traffic in real time with a 3D backend.
Stars: ✭ 57 (+256.25%)
Mutual labels:  dataviz
gosling.js
Grammar of Scalable Linked Interactive Nucleotide Graphics
Stars: ✭ 89 (+456.25%)
Mutual labels:  dataviz
d3-gridding
grids for rapid D3 charts mockups
Stars: ✭ 100 (+525%)
Mutual labels:  dataviz
gunfunded
Analyzing the gun lobby’s funding of Congress.
Stars: ✭ 32 (+100%)
Mutual labels:  dataviz
reusable-d3-charts
Reusable charts built with D3. Built on Web standards, fully customisable.
Stars: ✭ 33 (+106.25%)
Mutual labels:  dataviz
scholia
Wikidata-based scholarly profiles
Stars: ✭ 166 (+937.5%)
Mutual labels:  dataviz
react-d3-integration
An example on how to integrate D3 into React
Stars: ✭ 14 (-12.5%)
Mutual labels:  dataviz
ee extra
A ninja python package that unifies the Google Earth Engine ecosystem.
Stars: ✭ 42 (+162.5%)
Mutual labels:  dataviz
o-fish-web
Web application for the Officer's Fishery Information Sharing Hub (O-FISH). The web app allows agencies to gain insights from the aggregated information gathered during a routine vessel inspection (submitted via the web app).
Stars: ✭ 29 (+81.25%)
Mutual labels:  dataviz
2021 course dev-rougier
NumFocus Academy - Matplotlib (beginner)
Stars: ✭ 54 (+237.5%)
Mutual labels:  dataviz
leafmap
A Python package for interactive mapping and geospatial analysis with minimal coding in a Jupyter environment
Stars: ✭ 1,299 (+8018.75%)
Mutual labels:  dataviz
awesome-tools
Open-source list of awesome data visualization tools (e.g., charting libraries) for software developers 📊📈
Stars: ✭ 47 (+193.75%)
Mutual labels:  dataviz
dash-lollapalooza-brasil-2018
🎟Using Plotly to visualize data from Lollapalooza
Stars: ✭ 23 (+43.75%)
Mutual labels:  dataviz
sass-graph-viz
Draw a visual graph of Sass dependencies
Stars: ✭ 21 (+31.25%)
Mutual labels:  dataviz
hotmap
WebGL Heatmap Viewer for Big Data and Bioinformatics
Stars: ✭ 13 (-18.75%)
Mutual labels:  dataviz
covid-19
Current and historical coronavirus covid-19 confirmed, recovered, deaths and active case counts segmented by country and region. Includes csv, json and sqlite data along with an interactive website explorer.
Stars: ✭ 15 (-6.25%)
Mutual labels:  dataviz
angular-fusioncharts
Angular Component for FusionCharts JavaScript Charting Library
Stars: ✭ 53 (+231.25%)
Mutual labels:  dataviz

trumpogram

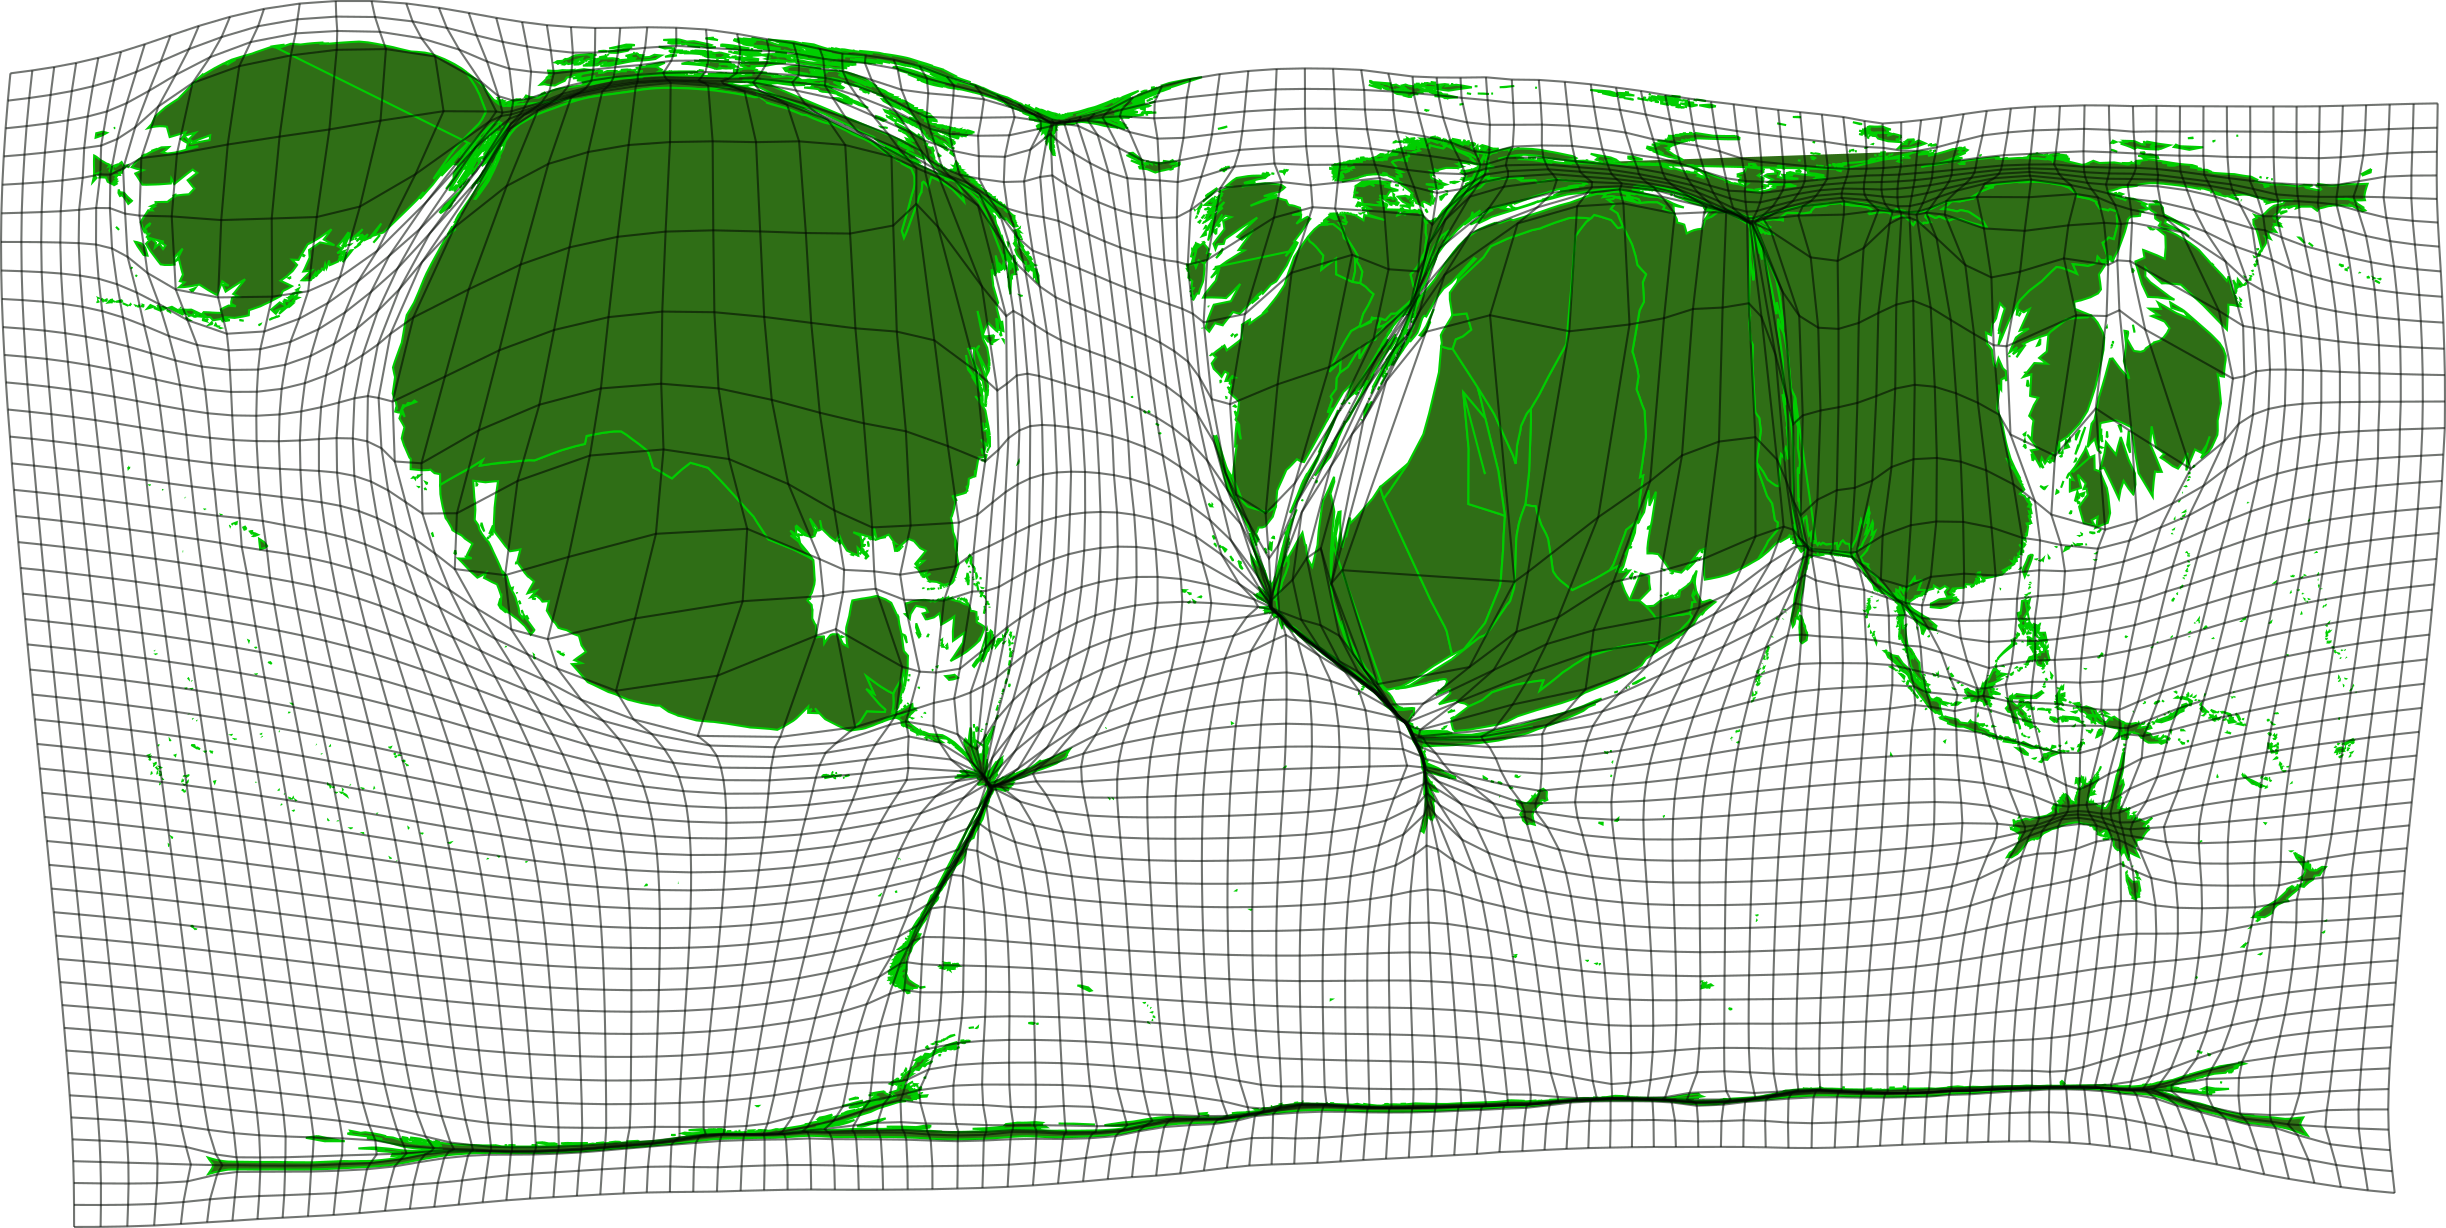
The World, according to Donald Trump. Each country's size is approximately proportional to the number of times that it was mentioned in Trump's tweets and campaign speeches.

Final Output

Output Map Image

About

Inspired by this tweet: https://twitter.com/SwiftOnSecurity/status/832074664193249281

There isn't much to this project, just plugging a few existing tools together.

The identification of place names is performed using the spacy python library, so any issues in this area aren't my problem :P. I used spacy to output a list of GPEs and NORPs (Geo-Political Entities, Nationalities Or Religious/Political Groups). The script then resolves "synonyms", and generates a column of quantities, corresponding to the countries in the geographical data.

Note: Mentions of individual US states are not included in the US total. Otherwise it would probably be way too big...

Corpus

The corpus for this project was obtained from multiple sources (I might add more):

Mapping

I obtained the map data from thematicmapping.org I generated the final map using the ScapeToad tool.

Note that the project description data, including the texts, logos, images, and/or trademarks, for each open source project belongs to its rightful owner. If you wish to add or remove any projects, please contact us at [email protected].