Planning Domain Description Language Support


![]()
This extension makes VS Code a great place for modeling planning domains.
This extension brings PDDL to the family of first-class languages with the level of support on par with c#, python or javascript. It aims to help the novice and empower the expert by following features:
- planning domain modeling
- planning domain validation by number of regression or scalability test cases
- planning solution industrializing by problem file generation from templates
- plan validation
Extension is activated on any .pddl files (commonly holding domain or problem definitions) or selected PDDL commands to configure parser and planner.
Getting started
Creating PDDL files and running the planner
Simplest way to get started is to:
- open a blank folder in VS Code using File > Open Folder...,
- create two blank files using File > New File named
domain.pddlandproblem.pddl, both files will show up in the Explorer pane, open them side by side in the editor, - open the domain.pddl file and type
domain. The auto-completion suggests to insert the entire structure of the domain file. Use the Tab and Enter keys to skip through the placeholders and make your selections. - open the problem.pddl file and type
problem. The auto-completion suggests to insert the entire structure of the problem file. Make sure that the(domain name)here matches the name selected in the domain file. - When prompted to install the VAL (i.e. Validator) tools, follow the instructions. This will bring a PDDL parser and plan validation utilities to your experience.
- When you are ready to run the planner on your domain and problem files, invoke the planner via context menu on one of the file text content or editor tab, or via the Alt + P shortcut. The planning.domains solver will be used, so do not send any confidential PDDL code.
- Configure your own PDDL planner by following instructions.
Explore VS Code PDDL show-cases
To exercise the features of this PDDL Extension, clone this vscode-pddl-samples repository and open the folder in VS Code. Follow the instructions and explanations in the readme.
You can copy the following URL to your browser's address bar and open it, it will let you select where you want to clone the repo onto your local storage and opens it for you in VS Code - all automated:
vscode://vscode.git/clone?url=https%3A%2F%2Fgithub.com%2Fjan-dolejsi%2Fvscode-pddl-samples
Starting from existing PDDL models
Open editor.planning.domains in your browser, select Import from the menu and browse the catalog of all the International Planning Competition benchmarks. Or find more examples here.
To get back from the online editor to VS Code, save your files into a session and click "Open offline".
Features
Snippets
Following snippets are supported if you start typing following prefix
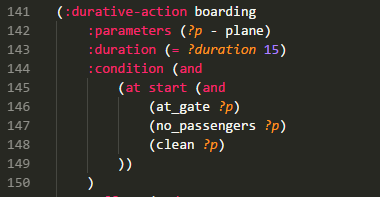
domain: creates a domain skeletonaction: instantaneous actionaction-durative: durative actionproblem: creates a problem skeleton
Syntax highlighting
Commonly used PDDL keywords are highlighted.
Hover, go to definition and find all references
Similar to other programing languages, you can hover over a PDDL predicate, function or type and see the definition. If some comments are placed on the same line, they are also displayed while hovering. The code comments may include markdown syntax.
You can jump to definition of predicates and functions in two ways: Ctrl+click or Right-click > Go to Definition menu.
You can also right click on such symbol and select Find All References.
Jump to Symbol e.g. predicate/function/action
Use the VS Code keyboard shortcut Ctrl + Shift + O to open up the symbol listing. That lists all predicates, functions and actions in the domain file. That way you may review the full list of actions in a concise way and jump to their declaration.
Global predicate/function/type/parameter renaming
Put cursor into a predicate, function or type name and press F2 to rename its appearances in the domain file and all associated problem files currently open in the editor.
It is also possible to rename a ?<parameter> name within a parametrised scope e.g. action/process/effect/derived predicate or function.
Auto-completion
When typing in the domain or problem file characters such as (, : or ?, Visual Studio Code pops up the suggested keywords or names of predicates/functions/parameters or other PDDL language constructs.
Some PDDL constructs are supported with smart snippets, which are aware of where you are in the document and what is in your model:
Syntactic errors
PDDL parser can be configured to run in the background and draw attention to syntactic errors, so you can fix them before running the planner. This dramatically shortens the time you need to come up with a valid PDDL.
To learn more about how to configure the extension to work with one of the parsers available or even your own, read this wiki page.
Auto-fixing PDDL parser warning
The VAL PDDL parser produces some warnings, that could be automatically fixed with a code action. Code actions are presented in the user interface by a light bulb. For example missing requirements could be automatically inserted:
Undeclared predicates and functions may also be automatically declared:
Model visualization
A "View" code lens is displayed above selected PDDL sections such as :init section of problem files. Clicking it will open a graphical representation of the initial state for easy review.
So far object properties and relationships are displayed in a tabular form and a directed graph is available to visualize 2D-symmetric predicates or functions i.e. predicates or functions whose first two arguments are of the same type.
For example predicate (path ?from ?to) or function (distance ?a ?b) will be visualized on a graph.
Run the planner and visualize plans
The planner can be invoked in the context of a currently edited PDDL file. There are two ways how to do that via the user interface.
- Type
Ctrl + Shift + PorF1and type plan to filter the list of available commands. The PDDL: Run the planner and visualize the plan command should be visible. - Right click on the PDDL file and select PDDL: Run the planner and visualize the plan
- Alternatively you can set up a keyboard shortcut such as
Alt + Pto be associated with the above command (see VS Code documentation for that)
There are multiple scenarios supported:
- if command is invoked on the domain file,
- and if single corresponding problem file exists in the same directory, the planner will run without asking further questions
- and if multiple corresponding problem files exist in the same directory, the list of applicable problem files will appear and the user will select one.
- if command is invoked on a problem file, the domain file (if located in the same folder) will be selected automatically (as long as it is unique).
To invoke the planner on domain/problem pair that are located in different directories, multi-select them both on the File Explorer tree and select the PDDL: Run the planner and visualize the plan option from the context menu.
Domain, problem and plan/happenings files correspond to each other, if:
- they have the same domain name i.e.
(domain name)and - they are located in the same folder.
Control+click on action names in .plan files to jump to the action definition in the domain file.
If one of the rules above is not satisfied, the editor will not naturally associate your files to each other. In that case it shows a validation error suggesting to apply a Quick Fix, which lets you find the corresponding domain/problem file from following scopes:
- suggested files, if multiple candidates were found
- currently open files in the editor
- other files in the workspace
- any other file selectable from the computer storage
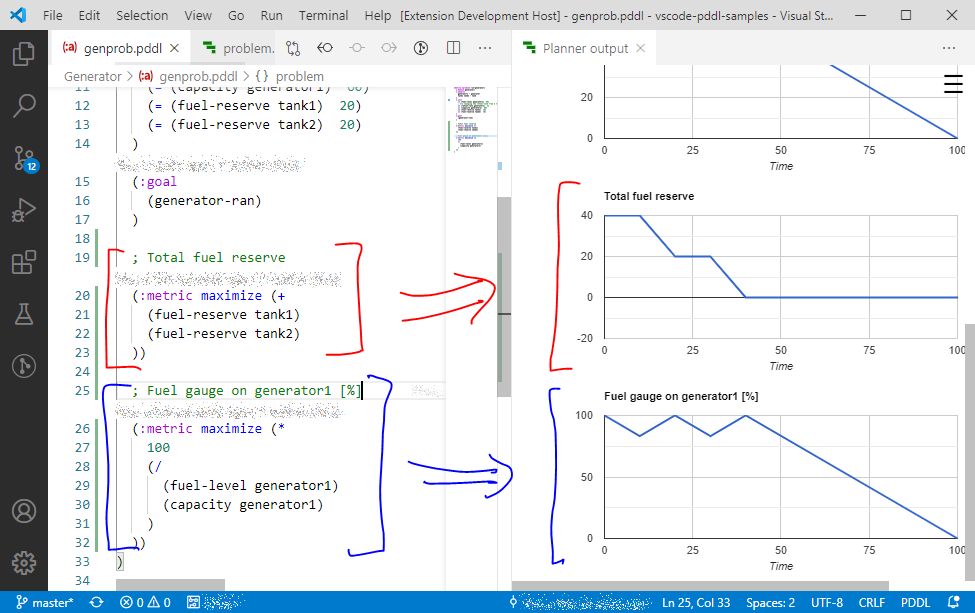
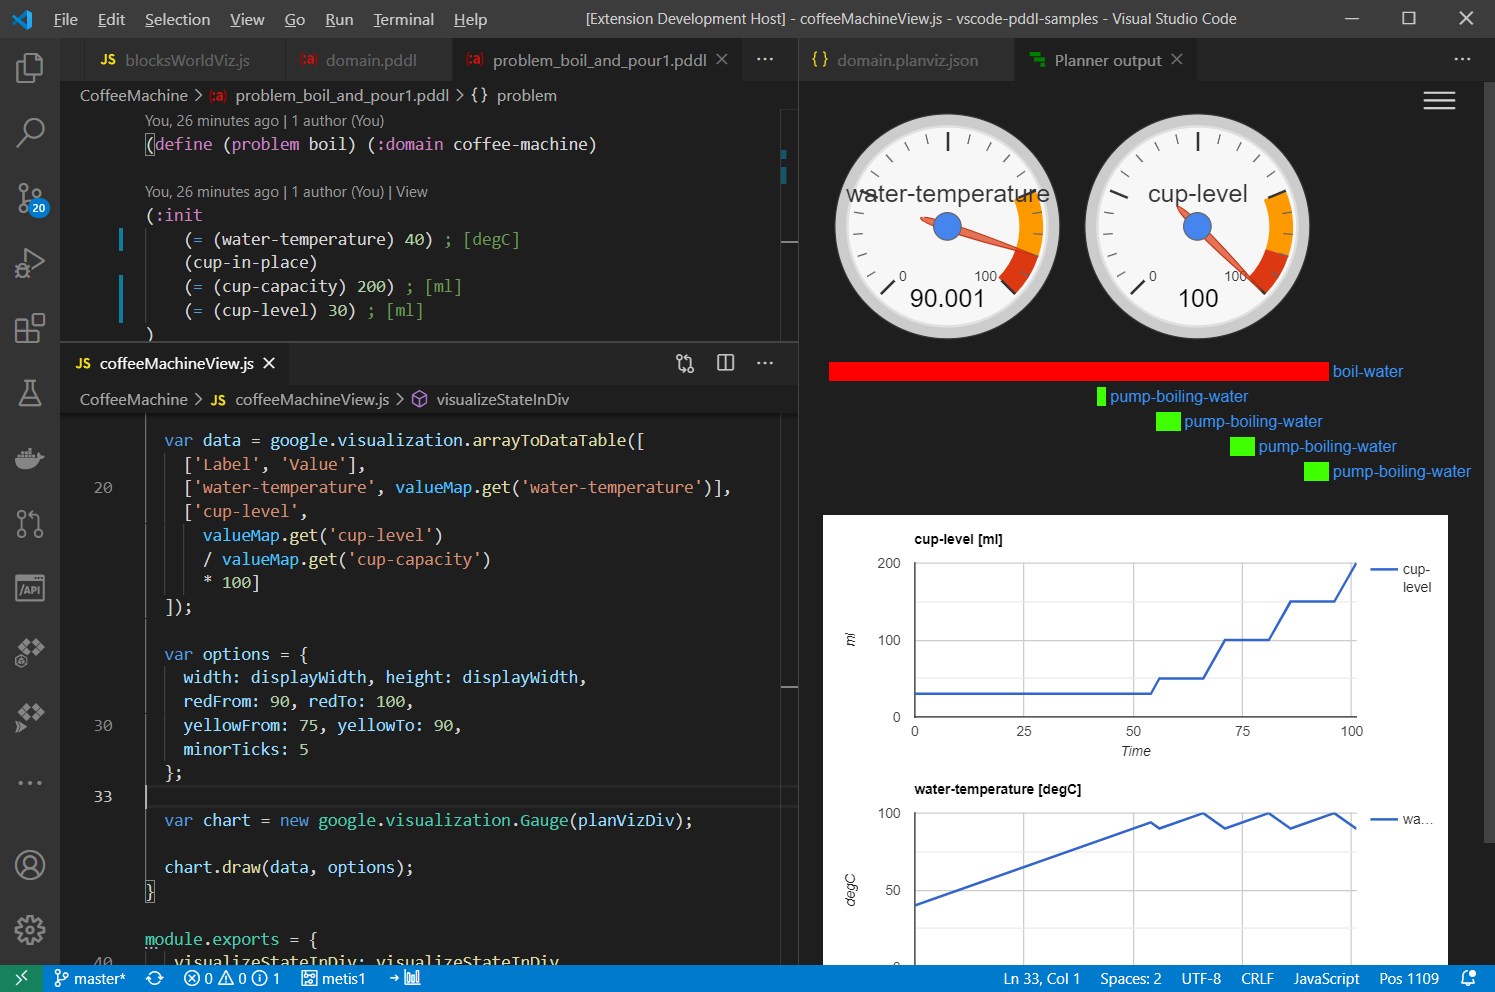
Line plots for multiple metric expressions
If your planner supports multiple (:metric ...) expressions in the problem file (VAL actually does),
you can use it to get some ad-hoc expressions displayed on a line plot below the plan.
This is very useful, to debug numerically-rich domains.
Running the planner interactively
See configuration setting pddlPlanner.executionTarget to select where is the planner executable started. You can either direct planner executable output to a Terminal window instead of the Output window. This can be configured on the Overview page.
The Terminal option is useful when the planner takes keyboard input while executing. In case of the Terminal, the plan(s) are not visualized. Planner could be stopped by Ctrl+C (or equivalent).
The planner output can be re-directed between the three destinations, including the interactive Terminal window, simply using a button in the stats bar:
Hide actions from plan visualization
Plan visualization details may be fine-tuned using an additional file <domain>.planviz.json, where <domain> refers to the domain file name without the .pddl extension, placed into the same folder as the domain file. Following syntax is supported:
{
    "excludeActions": [
        "action-to-be-hidden",
        "^prefix_",
        "suffix$"
    ]
}
The entries may use regular expression pattern. Note that backslashes in the regex must be doubled up to comply with JSON syntax.
Excluding actions from swim-lane plan visualization by configuring selected parameters to be ignored
It is now possible to exclude selected action parameters from swim-lane plan visualization. This is useful for action parameters, which are just marginally involved in the action conditions, and displaying such action in the swim-lane of the given object makes the diagram confusing. To configure this, add ignoreActionParameters into the _domain_.planviz.json file, where domain matches your domain file name. This example will exclude ?to and ?from parameters of any action starting with move. It also exclude any parameter with name ending with the _reserved suffix:
{
    "ignoreActionParameters": [
        {
            "action": "^move",
            "parameterPattern": "^(to|from)$"
        },
        {
            "action": ".+",
            "parameterPattern": "_reserved$"
        }
    ]
}
Custom domain-specific plan visualization
To study the files used in the above example, see blocksworld.planviz.json ...
{
    "customVisualization": "blocksWorldViz.js"
}
... and blocksWorldViz.js.
function visualizePlanHtml(plan, width) {
   const height = 250;
   return `...`; // your plan visualization logic goes here
}
module.exports = {
   visualizePlanHtml: visualizePlanHtml,
};
If the final state of the plan is more appropriate for visualization (as oppose to the plan itself), the visualization logic may look this way:
/**
 * Populates the `planVizDiv` element with the plan visualization of the `finalState`.
 * @param {HTMLDivElement} planVizDiv host element on the page
 * @param {Plan} plan plan to be visualized
 * @param {{variableName: string, value: number | boolean}[]} finalState final state of the `plan`
 * @param {number} displayWidth desired width in pixels
 */
function visualizeStateInDiv(planVizDiv, plan, finalState, displayWidth) {
  for (const v of finalState) {
    console.log(`${v.variableName}: ${v.value}`);
  }

  const valueMap = new Map(finalState.map(i => [i.variableName, i.value]));

  // print certain value
  console.log(valueMap.get('predicate1 obj2 obj3'));
}

module.exports = {
   visualizeStateInDiv: visualizeStateInDiv
};
The above example merely prints the final state values to the browser console.
See full example that uses a charting component coffeeMachineView.js.
To see all the options for plan visualization as HTML/DOM/SVG, see the function signatures here: CustomVisualization.ts.
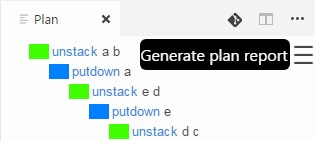
Generate plan report
Plan visualization displays a menu symbol ☰ in the top-right corner, which shows applicable commands. For example the PDDL: Generate plan report, which opens the plan report generated into a self-contained HTML file that you can save and share/email.
Exporting plan to a file
The Planner Output plan visualization pane displays a menu symbol ☰ in the top-right corner. One of the options is Export as .plan file. When this option is selected, the file name and location can be specified.
Plan file visualization
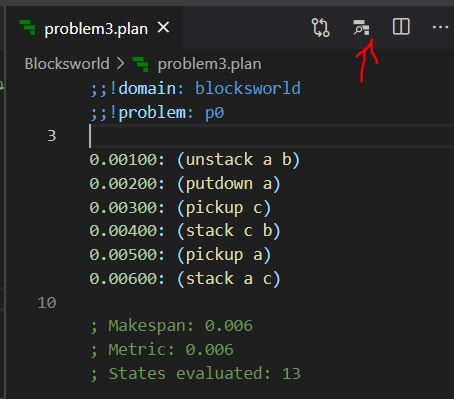
Right-clicking on any .plan file offers PDDL: Preview plan command to visualize the plan. However, the plan must start with the meta data lines linking it to a domain and problem names:
;;!domain: domain-name
;;!problem: problem-name
Plan preview command is available in the editor title bar when a .plan file is focussed.
Planning with command-line switches
When using a planner executable, further command-line options may be specified.
Auto-completion snippets for symmetric and sequential initialization
Creating a realistic problem files to test the domain may be tedious. Here are several ways to make it substantially faster:
Initializing a sequence of symmetric relationships.
Initializing a symmetric relationships.
Regression testing of PDDL domains
The PDDL Tests explorer tree lists all configured test cases and supports single test execution as well as a bulk test execution.
If no tests are present in the workspace, a button shows up suggesting test creation for currently open domain and problem(s).
It is also possible to add test case based on recent call to the planning engine from the hamburger menu on the plan preview pane.
To add a test case, create a file named *.ptest.json anywhere in the workspace. This is a simple example:
{
    "defaultDomain": "StripsRover.pddl",
    "defaultOptions": "",
    "cases": [
        {"problem": "pfile1"},
        {"problem": "pfile2"},
        {"problem": "pfile3"}
    ]
}
Use other JSON properties like expectedPlans to define the test assertion or options to specify command-line options to use.
Interesting by-product of this feature is that it can be used to give effective demos. Prepare a specific <name>.ptest.json for your planned demo. Right click on each test and select the Open PDDL domain and test problem and both files open side-by-side in the editor. Show the code and run the planner. Then move to the next test case - demo.
All tests under a given directory may be executed by right clicking on the folder and selecting the run all command. All tests in the workspace may be executed by clicking the Run all button in the PDDL TESTS pane's toolbar.
Problem file generation
In order to test the PDDL domain model and its scalability, it is useful to be able to generate realistic problem files from real data. However, as the PDDL model is under development, so is the structure of the problem files. Those test problem file quickly get out of date and are pain to maintain by hand. There are multiple ways how to generate problem files now. Simplest is to use one of the supported templating libraries, which are powerful enough to satisfy great number of use cases. If that is not sufficient (e.g. data needs to be retrieved from a database, cloud service and heavily manipulated), you can invoke any script or program by specifying the command-line call. Such program, however, must accept the templated problem file on its standard input and provide the actual PDDL via its standard output.
There are several templating options supported out of the box:
But there is a wealth of templating libraries, including Razor see RazorTemplates, which is popular in asp.net, or T4.
Nunjucks and Jinja2 are two very similar templating engines, but differ in some important details. Nunjucks runs natively in Javascript and the file generation will not cause perceivable delays, while Jinja2 needs to invoke Python and will slow down your development process somewhat.
For the ultimate flexibility, here is how to configure a Python script to do a custom pre-processing of the problem file:
{
    "defaultDomain": "domain.pddl",
    "defaultProblem": "problem_template.pddl",
    "defaultOptions": "",
    "cases": [
        {
            "label": "Case #1",
            "preProcess": {
                "kind": "nunjucks",
                "data": "case1_data.json"
            }
        },
        {
            "label": "Case #1.1",
            "preProcess": {
                "kind": "jinja2",
                "data": "case1_data.json"
            }
        },
        {
            "label": "Case #2",
            "preProcess": {
                "kind": "command",
                "command": "myprogram.exe",
                "args": [
                    "case2_data.json",
                    "some_switch",
                    42
                ]
            }
        },
        {
            "label": "Case #3",
            "preProcess": {
                "kind": "python",
                "script": "../scripts/populate_template.py",
                "args": [
                    "case3_data.json"
                ]
            }
        }
    ]
)
Note that if you are referring to other files such as Python scripts or JSON data files in the .ptest.json, you may use relative path i.e. relative to the path, where the .ptest.json file is located as that is the runtime context in which the pre-processor will be executed.
The templated problem file and the problem file generated using the pre-processed PDDL test case may be open side-by-side and used as a live preview of the code generation.
Problem generation via a Python script
This is what happens if you set "kind": "python": Before executing the test, the extension runs the populate_transform.py script using the python command, pipes the problem_template.pddl onto it and reads the PDDL output of the script. The script uses the data from the configured .json file in this case, but as this is basically a command-line argument, you could refer to a database table just as well.
If you have multiple python installations (e.g. 2.7, 3.5), there are several ways how to indicate which one you want to use:
- python executable is in the %path%
- you are using the Python extension to select the python runtime
- you simply configure the python executable path via the
python.pythonPathsetting property
Normalized plan comparison
Plans from different planners are hard to compare due to different formatting of the output. Normalized diff re-formats the plan, removes all extra lines or comments, orders simultaneous actions alphabetically, shifts plan times (by a convention plans start at time epsilon) and opens the Diff window. Open file explorer pane, select two .plan files, right-click and select PDDL: Normalize and compare 2 plans.
If the valstep utility (experimental feature) is configured, the diff also includes the final state values. This is useful when you want to check that the plan leads to the exact same goal state despite some minor differences in the action sequence (e.g. different permutations or redundant actions).
Plan final state evaluation
The PDDL: Normalize and evaluate plan command exposes in isolation the transformation used by the PDDL: Normalize and compare 2 plans command. In addition, this is a live preview, which evaluates your plan changes on-the-fly.
Plan validation
A .plan file can be generated using an option in the Plan Visualization menu (☰), or using a PDDL: Export plan to a file... command.
All .plan files have a context menu option PDDL: Validate plan, which requires the Validate executable path to be configured in the pddl.validatorPath setting. See VAL for more details.
Sometimes it is more convenient to create a desired plan by hand and using the Validate tool to find out what is wrong in the domain model. While manually modifying the .plan file, all parsing and validation problems are displayed in the Problems panel of VS Code as long as a corresponding problem and domain files are located in the same folder and the Validate executable location is configured via the pddl.validatorPath setting.
Plan happenings validation
A context menu option in .plan file PDDL: Convert plan to happenings... supports export to a .happenings file. This shows the exact temporal sequence of action starts and ends.
This notation is more convenient when checking temporal plans for correctness.
Control+click on action names in .plan or .happenings files to jump to the action definition in the domain file.
This is the syntax supported by the preview:
;;!domain: airport-ground-operations
;;!problem: _1plane

; timed initial fluent
1.000: (= (available_fuel-truck truck1) 1000)
; timed initial literal
5.000: set (final-approach p1)
5.001: start (land p1 rw1)
5.100: unset (final-approach p1)
7.001: end (land p1 rw1)

; re-occurring actions
10.001: start (land p1 rw1) #2
12.001: end (land p1 rw1) #2
All first occurrences of happenings are #1 implicitly. Labeling the first occurrence as #1 is optional.
Instructions start and end label durative span actions. Instructions set and unset label timed-initial literals (TILs). Instruction (= (function) value) is for timed-initial fluents (TIFs).
To convert .happenings back to .plan, right click on the happenings file and select the PDDL: Convert happenings to plan... command.
Plan Happenings effect evaluation
Plan happenings (.happenings) files may be executed and action effects listed as decorations in the code editor.
For this to work, the setting pddl.valStepPath must be set with the location of the ValStep utility, which is currently not distributed with the extension.
Plan Happenings -> domain completeness test suite auto-generation
To test robustness of your planning model, you can auto-generate a "plan-resume" re-planning test suite. Open a .happenings file and select PDDL: Execute plan and generate plan-resume test cases from the context menu. This command executes the happenings and evaluates all intermediate states in the course of the plan. Then it generates a problem file for each of those states (treating them as new initial states) and the same goal. The command then also summarizes all those new problem files into a new test manifest named after the problem file <problem_file_name>_re-planning.ptest.json, which you can open in the Test Explorer and run as a test suite. You get to select the folder for all the generated files. This way you can test whether your domain model includes actions to recover from possible plan failures. You can then manually edit those generated problem files to model actual plan failure modes.
For this to work, the setting pddl.valStepPath must be set to the location of the ValStep utility, which is currently not distributed with the extension. There is a known issue with time-initial literals and fluents - they are not re-included into the generated problem files.
Search Debugging
Search Debugging is the ultimate AI Planning educational tool and a powerful search debugger tool at the same time. It explains how the heuristic function guides the search and at the same time it can be used to understand why the planner has hard time finding the plan for given planning problem and where does the domain model need to be tightened.
Start the Search Debugger using the PDDL: Start search debugger command. Stop it by the PDDL: Stop search debugger or pressing the cell phone signal icon. While the search debugger is active, it listens to the planner messages and visualizes the progress of the plan search in several ways:
- line plot of state heuristic value and estimate of makespan
- search tree
- best-state-so-far is visualized in terms of planhead, helpful actions and relaxed plan.
When the search stops, the states may be navigated and explored in three ways:
- using keyboard up, down, left, right buttons to navigate states in the search tree
- using keyboard shift+left and shift+right to navigate all states in order of discovery as layed out on the line plot
- by clicking on helpful actions to jump to the child state that expands that action (if actually created)
While the Search Debugger is active, any planning PDDL: Run the planner and display the plan requests are instrumented to send search progress info to the Search Debugger. This is achieved by appending a switch to the command line options. The switch may be configured using the pddlSearchDebugger.plannerCommandLine setting.
The search debugger may be enabled/disabled by clicking on the bug-like icon in the status bar. For even smoother experience, the execution target setting may be switched to Search debugger too to keep the Search debugger window in the forefront.
The search debugger may be enabled/disabled by clicking on the bug-like icon in the status bar.
If the planner outputs even more detailed log for every state, the log file could be synchronously navigated (scrolled to the same state). Select the log file that corresponds to the search being debugged by pressing the 🗎 icon. The log entry that corresponds to the state is matched using the regular expression pattern configurable by the pddlSearchDebugger.stateLogPattern setting.
Following keyboard shortcuts are available to navigate or manipulate the search tree view:
- Typing a number using 0-9 selects the state with the matching Order ID.
- Change shape of a state to highlight states of interest using:
- b: box,
- d: diamond,
- s: star,
- t: triangle,
- h: hexagon,
- q: square,
- e: ellipse (default)
- Toggle auto-fitting of the tree to the viewport using f to avoid losing focus, while search is progressing
- Fit the entire tree into the viewport by F
Dead-end states are visualized with brown color. Tree branches(s) leading to goal state(s) are painted in green color.
The Search Debugger may now be configured (see the pddlSearchDebugger.stateIdPattern configuration setting) with a pattern to parse the state ID.
The visualization then respects the IDs assigned by the planner rather than using its own numbering scheme
(which is used if the received state ID does not respect the pattern).
Both tree nodes and edges now show an informative tooltip when mouse hover-over.
To participate in this visual search debugging the planning engine must implement a HTTP client. An example of what data is expected may be found in the mock search.
Block folding in :init section of the problem file
For large problem files, it is convenient to be able to fold blocks of statements between ;;( and ;;) comments lines.
Planning.Domains integration
Browsing the Planning.Domains PDDL collection
The file explorer side bar includes a tree displaying the Planning.Domains PDDL collection. The domain, problem and plan files are downloaded and displayed as read-only files and the planner may be invoked on them as usual.
Planning.Domains sessions
The online Planning.Domains editor has a concept of a session. Session Details pane shows links to open the session online / offline. The offline links are handled by VS Code, if installed.
There are two ways to get started:
- Using a command:
- PDDL: Download Planning.domains session and pasting the Session Unique ID
- By navigating to this URL in your favorite web browser:
- vscode://jan-dolejsi.pddl/planning.domains/session/readOnlyHash or
- vscode://jan-dolejsi.pddl/planning.domains/session/edit/readWriteHash.
The session files are downloaded into a selected workspace folder and may be interacted with via the Source Control pane.
Planning.Domains Editor Sessions use plug-ins that save their own configuration.
The solver plugin's configuration (i.e. the URL of the solver service) is now replicated into the workspace folder's settings. This is stored in .vscode/settings.json file:
{
    "pddl.planners": [
        {
            "kind": "SERVICE_SYNC",
            "url": "http://localhost:12345/solve",
            "title": "http://localhost:12345/solve",
            "canConfigure": true
        }
    ]
}
When local session changes are committed back to the server, the solver URL is not included.
Session files may be deleted, renamed as well as added. The Source Control pane shows the diff as usual. To open Source Control select the View > SCM menu.
The Source Control pane has icons for:
- uploading changes to Planning.Domains,
- discarding local changes and
- checking if a new version of the session is available.
The [...] menu contains more options:
- Session may be duplicated (as a new writable session), which is useful when the session was open as read-only.
- Session may be open in the default browser,
- Session may be shared via email, if default email client is installed to handle the
mailto:protocol, or - Session may be used as a template to generate entire classroom of sessions, while emailing every student a link to theri session using the PDDL: Generate Planning.Domains classroom sessions from this template... command.
Using the duplicate session and share via email commands, a teacher can create a session for everyone in the classroom and monitor progress of all students from VS Code.
The command PDDL: Generate Planning.Domains classroom sessions from this template... automate the duplication of this session into any number of student sessions. A prompt pops up to submit student names and/or email addresses in a semi-colon separated list. If email address is included, the default email client pops up with a prepared message for each student. When all sessions are created, a dedicated VS Code workspace is created for the classroom and VS Code automatically opens it.
Gamifying PDDL trainings
Include a .ptest.json file into the template session, create classroom using the , open the Test Explorer (View > Open View ... > Test > PDDL TESTS) and click the Run All button in the toolbar. This runs the test cases from all the student sessions and displays the pass/fail results.
First student with passing tests wins ... a diploma :-!
Working with multiple-sessions in VS Code
The support for multiple sessions or even the entire classroom of sessions per student is built using the VS Code Workspace Folders facility. Each workspace folder in this case is its own Source Control root. The Source Control panel lets you select the session you want to interact with and the status bar starts from the left with a version indicator pertaining to the selected (or first) workspace folder.
The status bar of VS Code shows the state of the session. If multiple session folders are included in the VS Code workspace, the session of interest may be selected using the top part of the Source Control pane.
This is what the different symbols in the status bar mean:
- cloud download icon - shows if a new version of the session is available for download
- repository icon - helps distinguishing Planning.Domain sessions from other types of source control e.g. Git
- pencil icon - is displayed if the session is in read/write mode
- time info - how long ago was the currently checked-out version saved to the server (clicking it opens up the list of versions to select)
- dot icon - is displayed if the session was modified locally
- two circular arrows icon - when clicked, VS Code checks whether a new version of the session(s) is available on the server.
Known Issues
See unfixed issues and submit new ones here.
Release Notes
See CHANGELOG.
Source
For more information
- See other useful keyboard shortcuts for working with PDDL in VS Code.
- Read more about PDDL
Credits
Icons made by Pixel perfect from www.flaticon.com is licensed by CC 3.0 BY.
Development of this extension was supported by Schlumberger. Visit careers.slb.com.
Enjoy!