treosh / Web Vitals Reporter
Programming Languages
Labels
Projects that are alternatives of or similar to Web Vitals Reporter
web-vitals-reporter
Report Web Vitals to your API with one POST request per session.
The web-vitals library is excellent at accurately measuring Web Vitals. But it has no opinion on how to report metrics from a browser to your analytics. It may result in multiple API calls, session tracking, and lost metrics. The web-vitals-reporter makes Web Vitals collecting as simple as sending one POST request.
Features:
- Report Web Vitals with one request per session (no tracking);
- Associate useful device information like the number of
cpus,memorysize, andconnectiontype; - Report custom front end metrics;
- Handle edge-cases like multiple CLS calls, round values, and
sendBeaconfallback; - It's a tiny (800 bytes) library without external dependencies.
Usage
① Report Core Web Vitals and device information to an API endpoint:
import { getCLS, getFID, getLCP } from 'web-vitals'
import { createApiReporter, getDeviceInfo } from 'web-vitals-reporter'

// Init report callback with information about the browser.
const sendToAnalytics = createApiReporter('/analytics', { initial: getDeviceInfo() })

// Setup web-vitals
getLCP(sendToAnalytics)
getFID(sendToAnalytics)
getCLS(sendToAnalytics)

// Receive `POST /analytics` at the end of the session:
{
  id: '1591874402350-8969370227936',
  cpus: 8,
  memory: 8,
  connection: {rtt: 100, downlink: 5, effectiveType: '4g'},
  LCP: 1487,
  FID: 6,
  CLS: 1.5602,
  duration: 4560 // session duration
}
② Measure performance with Next.js:
import { createApiReporter } from 'web-vitals-reporter'

// init reporter
const report = createApiReporter('/analytics')

// export `reportWebVitals` custom function
export function reportWebVitals(metric) {
  if (metric.label === 'web-vitals') {
    report(metric)
  } else {
    report({ name: metric.name, value: metric.value })
  }
}

// or just, `report` supports custom metrics:
export { report as reportWebVitals }
③ Load and report Web Vitals using a <script> tag:
<script defer src="https://unpkg.com/web-vitals"></script>
<script defer src="https://unpkg.com/web-vitals-reporter"></script>
<script>
  addEventListener('DOMContentLoaded', function () {
    var sendToAnalytics = webVitalsReporter.createApiReporter('/analytics')
    webVitals.getCLS(sendToAnalytics)
    webVitals.getFID(sendToAnalytics)
    webVitals.getLCP(sendToAnalytics)
  })
</script>
API
createApiReporter(url, [options])
Create a report function that accepts Web Vitals' Metric object.
At the end of the session, it sends collected data to the url using a POST request.
It accepts any { name: string, value: number } object, making it a useful tool for reporting any metric to the API using the one-request-per-session pattern.
options.initial
Use initial to add extra context to the result object.
By default web-vitals-reporter only adds id and session duration. It's possible to rewrite id with the initial object.
import { getFID } from 'web-vitals'
import { createApiReporter, getDeviceInfo } from 'web-vitals-reporter'

const report = createApiReporter('/analytics', {
  initial: { id: 'custom-id', cpus: getDeviceInfo().cpus },
})

getFID(report)

// reported body:
{
  id: 'custom-id',
  cpus: 8,
  FID: 24,
  duration: 4560 // session duration
}
options.onSend(url, result)
By default web-vitals-reporter uses sendBeacon and fallbacks to XMLHttpRequest.
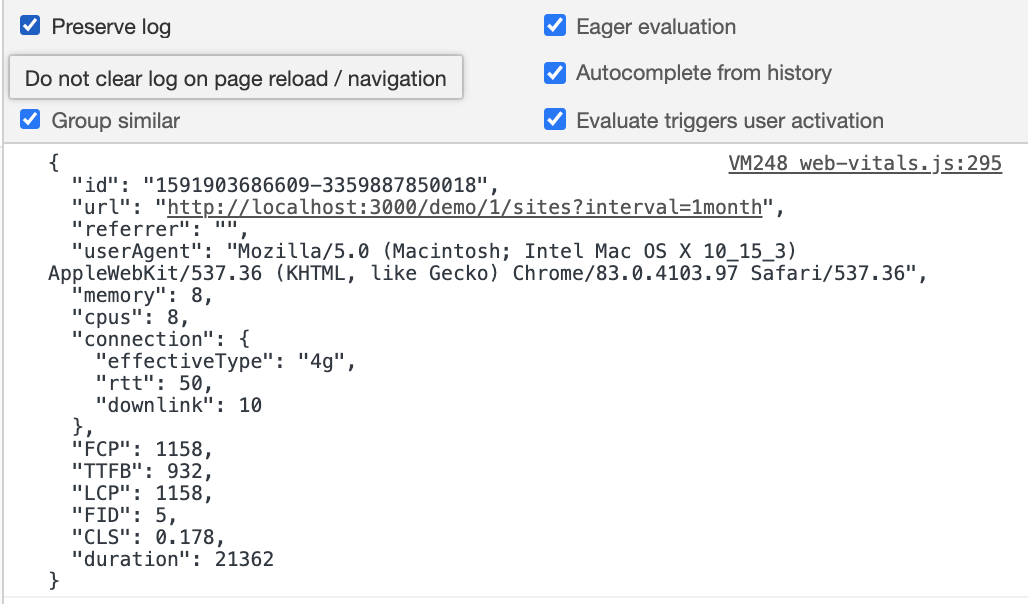
Use onSend to implement a custom request logic, like logging data in development, or adding extra headers with window.fetch.
import { createApiReporter } from 'web-vitals-reporter'

// detect Lighthouse using an `userAgent`
const isLighthouse = Boolean(navigator.userAgent.match('Chrome-Lighthouse'))

// exclude `localhost`
const isLocalhost = location.origin.includes('localhost')

// don't send results to API when a page tested with Lighthouse
const report = createApiReporter('/analytics', {
  onSend:
    isLighthouse || isLocalhost
      ? (url, result) => {
          console.log(JSON.stringify(result, null, '  '))
        }
      : null,
})
To see output in the console, set Preserve log option and refresh the page.
options.mapMetric(metric, result)
By default web-vitals-reporter only rounds metric.value for known Web Vitals (code).
Use mapMetric to implement a custom metric mapping. For example:
import { getCLS, getFID, getLCP } from 'web-vitals'
import { createApiReporter } from 'web-vitals-reporter'

const report = createApiReporter('/analytics', {
  mapMetric: (metric) => {
    switch (metric.name) {
      // capture LCP element and its size
      case 'LCP': {
        const entry = metric.entries[metric.entries.length - 1] // use the last
        return {
          largestContentfulPaint: metric.value,
          largestContentfulElement: getCssSelector(entry.element), // custom helper
          largestContentfulElementSize: entry.size,
        }
      }

      // capture cumulative/largest/total layout shift
      case 'CLS': {
        return {
          cumulativeLayoutShift: metric.value,
          largestLayoutShift: Math.max(...metric.entries.map((e) => e.value)),
          totalLayoutShifts: metric.entries.length,
        }
      }

      // report more information about first input
      case 'FID': {
        const entry = metric.entries[0]
        return {
          firstInputDelay: metric.value,
          firstInputName: entry.name,
          firstInputTime: entry.startTime,
        }
      }

      // default name –> value mapping
      default:
        return { [metric.name]: metric.value }
    }
  },
})

getLCP(report)
getFID(report)
getCLS(report)
options.beforeSend(result)
Use beforeSend to modify the final result before it's sent to the server. Note: The method should be synchronous because it's fired at the end of the session when the tab is closed.
Example, compute metric score to pass Core Web Vitals thresholds:
import { getCLS, getFID, getLCP } from 'web-vitals'
import { createApiReporter } from 'web-vitals-reporter'

const report = createApiReporter('/analytics', {
  beforeSend: (result) => {
    const { LCP, FID, CLS } = result
    if (!LCP || !FID || !CLS) return // Core Web Vitals are not supported

    // return extra attributes to merge into the final result
    return {
      LCPScore: LCP < 2500 ? 'good' : LCP < 4500 ? 'needs improvement' : 'poor'
      FIDScore: FID < 100 ? 'good' : FID < 300 ? 'needs improvement' : 'poor'
      CLSScore: CLS < 0.1 ? 'good' : CLS < 0.25 ? 'needs improvement' : 'poor'
    }
  },
})

getLCP(report)
getFID(report)
getCLS(report)

// Receive `POST /analytics` at the end of the session with:
{
  id: '1591874402350-8969370227936',
  LCP: 1487,
  LCPScore: 'good',
  FID: 106,
  FIDScore: 'needs improvement'
  CLS: 1.5602,
  CLSScore: 'poor'
}
getDeviceInfo()
A helper that returns device information (connection type, memory size, or the number of CPU cores). Use these data to add dimensions to your analytics.
import { getDeviceInfo } from 'web-vitals-reporter'
console.log(getDeviceInfo())

// printed in console:
{
  "url": "https://treo.sh/",
  "referrer": "https://github.com/",
  "userAgent": "Mozilla/5.0 ...",
  "cpus": 8,
  "memory": 8,
  "connection": { "rtt": 100, "downlink": 5, "effectiveType": "4g" }
}
Return types:
{
  // The page URL from `location.href`.
  url?: string,

  // The referrer value from `document.referrer`.
  // It's useful to detect unique visits, without cookies or fingerprinting
  // https://docs.simpleanalytics.com/uniques
  referrer?: string,

  // The value of `navigator.userAgent` for browser detection
  userAgent?: string,

  // An approximate amount of device memory in gigabytes:
  // https://developer.mozilla.org/en-US/docs/Web/API/Navigator/deviceMemory
  memory?: number,

  // The number of CPU cores:
  // https://developer.mozilla.org/en-US/docs/Web/API/NavigatorConcurrentHardware/hardwareConcurrency
  cpus?: number,

  // The network information:
  // https://developer.mozilla.org/en-US/docs/Web/API/NetworkInformation
  connection?: {
    effectiveType: string,
    rtt: number,
    downlink: number,
  },
}
Credits
Sponsored by Treo.sh - Page speed monitoring made simple.
![]()

![]()