All Projects → everettjf → Appletrace

everettjf / Appletrace

Licence: mit
🍎Objective C Method Tracing Call Chart

Programming Languages

c
50402 projects - #5 most used programming language

Projects that are alternatives of or similar to Appletrace

Hiper
🚀 A statistical analysis tool for performance testing
Stars: ✭ 2,667 (+316.07%)
Mutual labels:  analysis, performance
Pcp
Performance Co-Pilot
Stars: ✭ 716 (+11.7%)
Mutual labels:  analysis, performance
Wallace Cli
Pretty CSS analytics on the CLI
Stars: ✭ 281 (-56.16%)
Mutual labels:  analysis, performance
Timemory
Modular C++ Toolkit for Performance Analysis and Logging. Profiling API and Tools for C, C++, CUDA, Fortran, and Python. The C++ template API is essentially a framework to creating tools: it is designed to provide a unifying interface for recording various performance measurements alongside data logging and interfaces to other tools.
Stars: ✭ 192 (-70.05%)
Mutual labels:  analysis, performance
Perfolizer
Performance analysis toolkit
Stars: ✭ 298 (-53.51%)
Mutual labels:  analysis, performance
Awesome Pagespeed Metrics
⚡Metrics to help understand page speed and user experience
Stars: ✭ 585 (-8.74%)
Mutual labels:  performance
Dll
Fast Deep Learning Library (DLL) for C++ (ANNs, CNNs, RBMs, DBNs...)
Stars: ✭ 605 (-5.62%)
Mutual labels:  performance
Chillout
Reduce CPU usage by non-blocking async loop and psychologically speed up in JavaScript
Stars: ✭ 565 (-11.86%)
Mutual labels:  performance
Prosopite
🔍 Rails N+1 queries auto-detection with zero false positives / false negatives
Stars: ✭ 555 (-13.42%)
Mutual labels:  performance
Web Frameworks
Which is the fastest web framework?
Stars: ✭ 6,125 (+855.54%)
Mutual labels:  performance
Pydis
A redis clone in Python 3 to disprove some falsehoods about performance.
Stars: ✭ 623 (-2.81%)
Mutual labels:  performance
Youku Sdk Tool Woodpecker
In-app-debug tool for iOS
Stars: ✭ 600 (-6.4%)
Mutual labels:  performance
Ngx Quicklink
Quicklink prefetching strategy for the Angular router
Stars: ✭ 586 (-8.58%)
Mutual labels:  performance
Seccubus
Easy automated vulnerability scanning, reporting and analysis
Stars: ✭ 615 (-4.06%)
Mutual labels:  analysis
Phan
Phan is a static analyzer for PHP. Phan prefers to avoid false-positives and attempts to prove incorrectness rather than correctness.
Stars: ✭ 5,194 (+710.3%)
Mutual labels:  analysis
Perf Tooling
List of performance analysis, monitoring and optimization tools
Stars: ✭ 625 (-2.5%)
Mutual labels:  performance
Swagger Stats
API Observability. Trace API calls and Monitor API performance, health and usage statistics in Node.js Microservices.
Stars: ✭ 559 (-12.79%)
Mutual labels:  performance
Yappi
Yet Another Python Profiler, but this time thread&coroutine&greenlet aware.
Stars: ✭ 595 (-7.18%)
Mutual labels:  performance
Grassmarlin
Provides situational awareness of Industrial Control Systems (ICS) and Supervisory Control and Data Acquisition (SCADA) networks in support of network security assessments. #nsacyber
Stars: ✭ 621 (-3.12%)
Mutual labels:  analysis
React Virtual List
Super simple virtualized list React component
Stars: ✭ 597 (-6.86%)
Mutual labels:  performance

AppleTrace

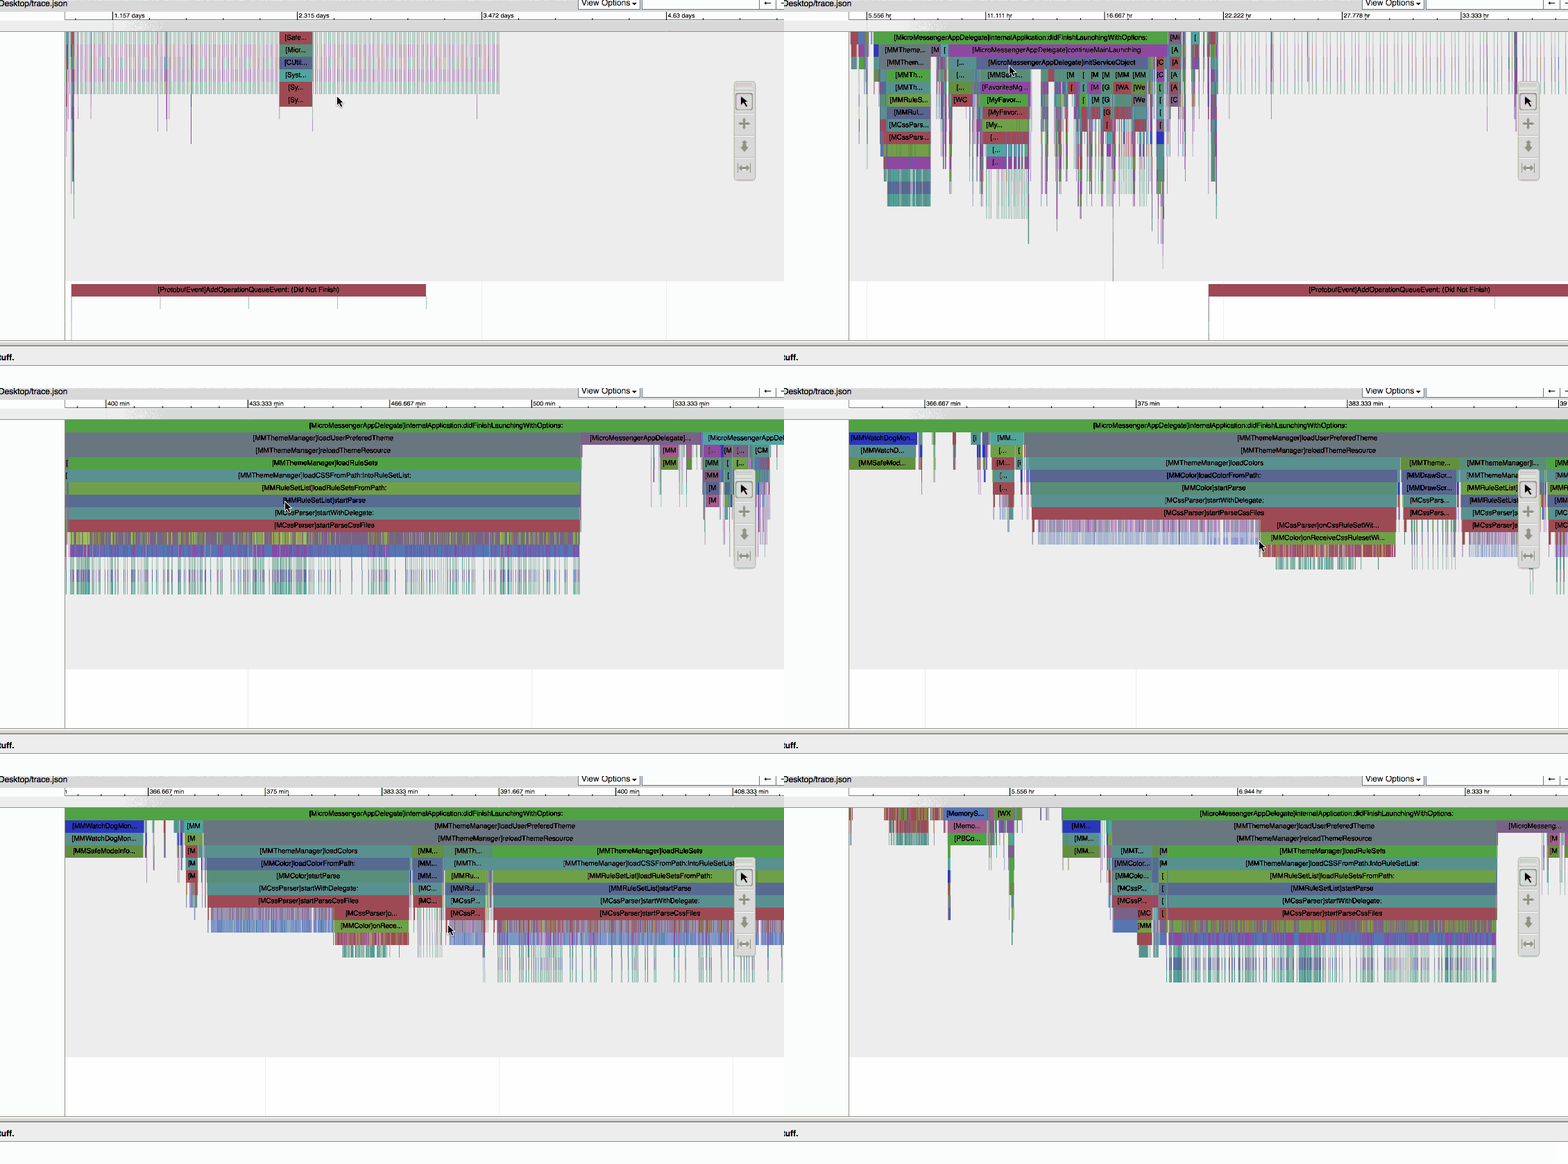
AppleTrace is developed for analyzing app's performance on iOS.

>> I have developed a replacement called Messier which is much easier to use. :)

logo

appletrace

Feature

  1. User-defined trace section.
  2. Trace Objective C methods.

FAQ

Go to Wiki

Clone

git clone https://github.com/everettjf/AppleTrace.git

For stable release , please refer to Releases

Usage

  1. Produce trace data.
  2. Copy from app's sandbox directory.
  3. Merge (all) trace data files into one file trace.json. (There may be more than 1 trace file.)
  4. Generate trace.html based on trace.json.

See below for more detail.

1. Produce

Until now , there are 2 ways for generating trace data.

(1) Manual set section.

Call APTBeginSection at the beginning of method ,and APTEndSection at the end of method. For Objective C method (whether instance method or class method), there are APTBegin and APTEnd macro for easy coding.

void anyKindsOfMethod{
    APTBeginSection("process");
    // some code
    APTEndSection("process");
}

- (void)anyObjectiveCMethod{
    APTBegin;
    // some code
    APTEnd;
}

Sample app is sample/ManualSectionDemo.

(2) Dynamic library hooking all objc_msgSend.

Hooking all objc_msgSend methods (based on HookZz). This only support arm64 under debugger ( lldb).

Sample app is sample/TraceAllMsgDemo.

2. Copy

Using any kinds of method, copy <app's sandbox>/Library/appletracedata out of Simulator/RealDevice.

appletracedata

3. Merge

Merge/Preprocess the appletracedata.

python merge.py -d <appletracedata directory>

This will produce trace.json in appletracedata directory.

NOW !!!, you could drop trace.json into Chrome's chrome://tracing. Or if you want to generate a html result, continue to the 4th step.

4. Generate

Run sh get_catapult.sh to get catapult source.

Then generate trace.html using catapult.

python catapult/tracing/bin/trace2html appletracedata/trace.json --output=appletracedata/trace.html
open trace.html

trace.html only support Chrome

SampleData

Open sampledata/trace.html using Chrome.

Thanks

  1. HookZz : https://github.com/jmpews/HookZz
  2. catapult : https://github.com/catapult-project/catapult

Group

欢迎关注微信订阅号,更多有趣的性能优化点点滴滴。

fun

Note that the project description data, including the texts, logos, images, and/or trademarks, for each open source project belongs to its rightful owner. If you wish to add or remove any projects, please contact us at [email protected].