Arrhythmia Classification through Characteristics Extraction with Discrete Wavelet Transform & Supervised Training
⚠️ This is a continuation of another project, developed to Digital Signal Processing College Final Work. In here it's added another four feature characteristics and MATLAB is used as a classifier engine altogether with WEKA. Consider seeing the DSP repository if you want a smaller version of this project.
This work covers cardiac arrhythmia classification through extraction of heart waves characteristics using discrete wavelet transform to filter the signal and machine learning supervised training to classify the exported characteristics with classes/true labels.
The goal was to classify at least two arrhythmia through some extracted characteristics with Weka and MATLAB.
SOFTWARES IN USE
LIBRARIES IN USE
This directory contains the entire MIT-BIH Arrhythmia Database. About half (25 of 48 complete records, and reference annotation files for all 48 records) of this database has been freely available here since PhysioNet's inception in September 1999. The 23 remaining signal files, which had been available only on the MIT-BIH Arrhythmia Database CD-ROM, were posted here in February 2005.
The recordings were digitized at 360 samples per second per channel with 11-bit resolution over a 10 mV range. Two or more cardiologists independently annotated each record; disagreements were resolved to obtain the computer-readable reference annotations for each beat (approximately 110,000 annotations in all) included with the database.
This example shows how to use wavelets to analyze electrocardiogram (ECG) signals. ECG signals are frequently nonstationary meaning that their frequency content changes over time. These changes are the events of interest.
Wavelets decompose signals into time-varying frequency (scale) components. Because signal features are often localized in time and frequency, analysis and estimation are easier when working with sparser (reduced) representations.
The QRS complex consists of three deflections in the ECG waveform. The QRS complex reflects the depolarization of the right and left ventricles and is the most prominent feature of the human ECG.
This function reads a pair of files (RECORDm.mat and RECORDm.info) generated by 'wfdb2mat' from a PhysioBank record, baseline-corrects and scales the time series contained in the .mat file, and plots them. The baseline-corrected and scaled time series are the rows of matrix 'val', and each column contains simultaneous samples of each time series.
Statistics and Machine Learning Toolbox™ provides functions and apps to describe, analyze, and model data. You can use descriptive statistics and plots for exploratory data analysis, fit probability distributions to data, generate random numbers for Monte Carlo simulations, and perform hypothesis tests. Regression and classification algorithms let you draw inferences from data and build predictive models. The toolbox provides supervised and unsupervised machine learning algorithms, including support vector machines (SVMs), boosted and bagged decision trees, k-nearest neighbor, k-means, k-medoids, hierarchical clustering, Gaussian mixture models, and hidden Markov models. Many of the statistics and machine learning algorithms can be used for computations on data sets that are too big to be stored in memory.
DIGITAL SIGNAL PROCESSING STEPS
There are two MATLAB functions to extract arrhythmia heart waves characteristics: single QRS wave (singleExampleWithDWTsignalPeaksExtraction.m) or multiples QRS waves (extractExampleFeaturesFromEcg). The first one it's necessary to insert the period or time that the features need to be extracted, while the second one multiples arrhythmia features are extracted from QRS waves labels.
Single Extraction Example With DWT signal Peaks (singleExampleWithDWTsignalPeaksExtraction.m)
To test a single extraction, run the following command on MATLAB:
[tmSeg,ecgsig,Fs,sizeEcgSig,timeEcgSig,annotationsEcg,qrsExtracted,tmExtracted,ecgsigTransf,qrsPeaks,locs] = singleExampleWithDWTsignalPeaksExtraction('200m', '../data/200m', 'VT', 0, 7.517, 2706, 0.5, 0.150);
This command will follow these steps:
- Load ECG signal from MIT-BIH database file, extracting signal time vector, signal vector, signal frequency, signal samples size and signal time size (in seconds):
[tmSeg,ecgsig,Fs,sizeEcgSig,timeEcgSig] = loadEcgSignal(filepath);
- Load ECG signal professional annotations, receiving in an object the time, period and arrhythmia types for each instant:
annotationsEcg = readAnnotations(filepath);
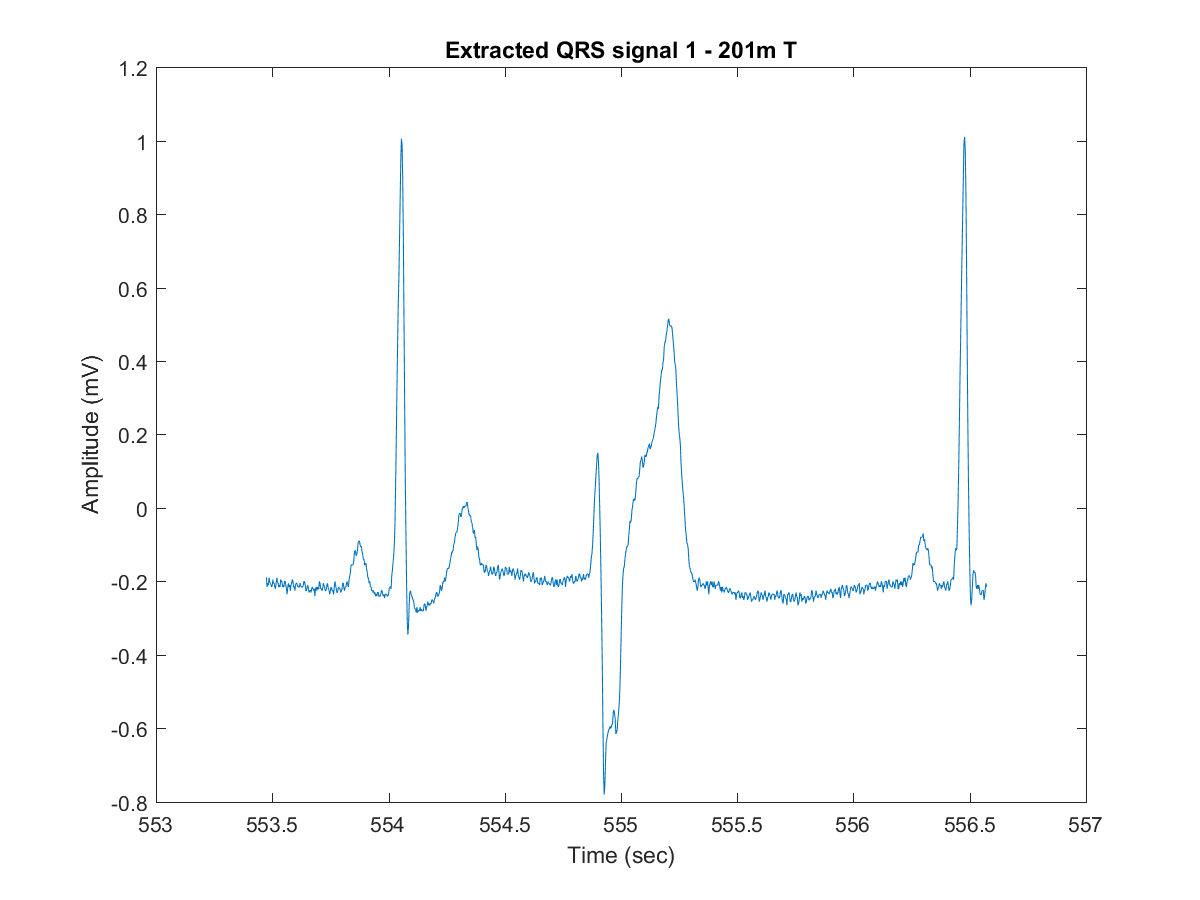
- Extract the QRS wave window in a signal and time vectors, plotting them in the end:
[qrsExtracted, tmExtracted] = plotExtractSingleQRS(minute, seconds, period, sizeEcgSig, timeEcgSig, ecgsig, tmSeg, filename, arrhythmiaType);
- Decompose the windowed-signal into time-varying frequency (scale) components with MODWT (Maximal overlap discrete wavelet transform) and IMODWT (Inverse Maximal overlap discrete wavelet transform) in the chosen scale:
ecgsigTransf = dwtSignal(qrsExtracted, scale);
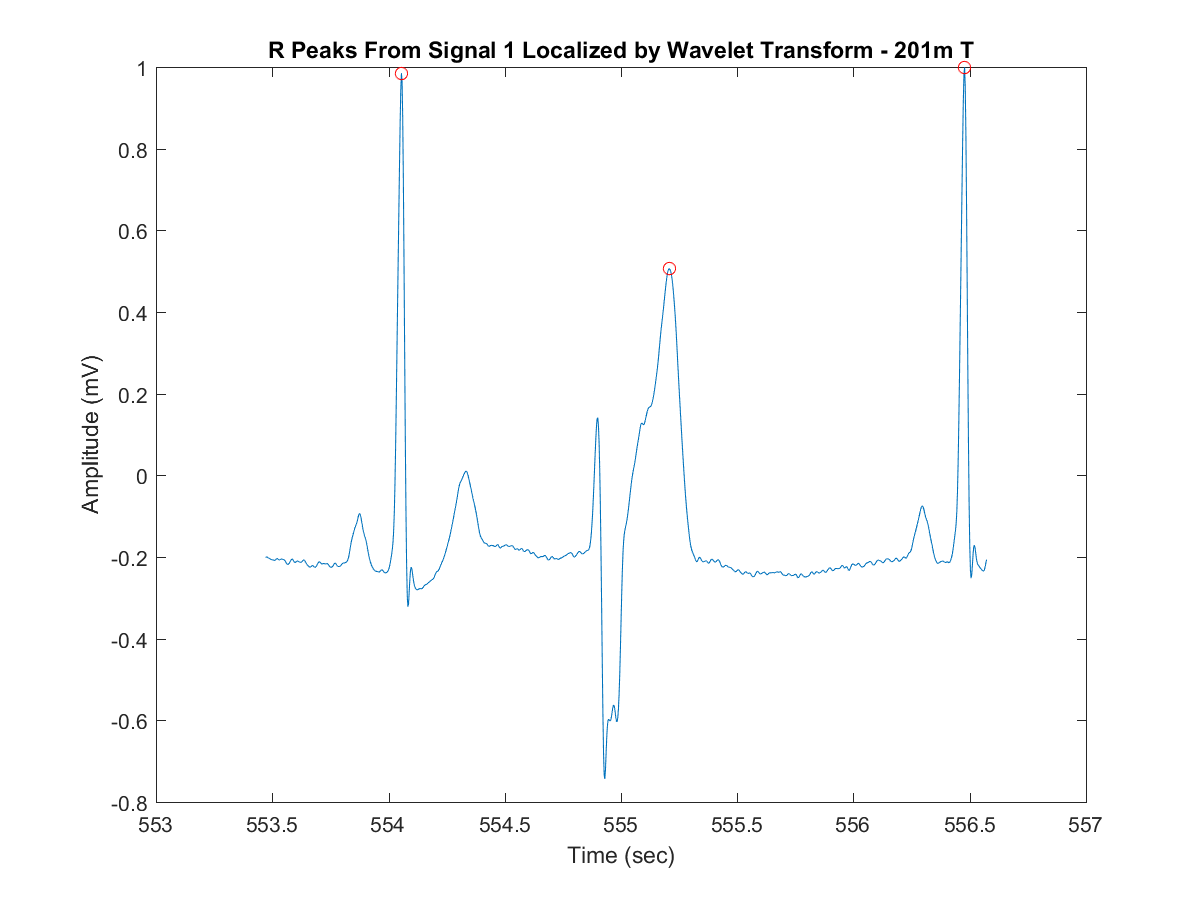
- Extract and plot the peaks amplitude and locations (feature characteristics) on the windowed-signal filtered after the last step:
[qrsPeaks,locs] = plotDWTsignalPeaks(ecgsigTransf, tmExtracted, minPeakHeight, minPeakDistance);
Multiple Extractions Example With DWT signal Peaks (extractExampleFeaturesFromEcg.m)
To test a multiple features extraction, run the following command on MATLAB:
features = extractExampleFeaturesFromEcg('200m', '../data/200m', 'VT', '../data/exported/vt-200m');
This command will follow these steps:
- Load ECG signal from MIT-BIH database file, extracting signal time vector, signal vector, signal frequency, signal samples size and signal time size (in seconds):
[tmSeg,ecgsig,Fs,sizeEcgSig,timeEcgSig] = loadEcgSignal(filepath);
- Read the arrhythmia periods of the chosen arrhythmia type from the professional annotations file. This will result in an object with the time, period and arrhythmia types for each instant:
arrhythmiaPeriods = readArrythmiaPeriods(type, filepath);
- Extract the QRS wave windows in signal and time vectors inside a arrhythmiaMultipleQRS object. This command will also plot and save in /matlab folder a PNG image for each plot - for any arrhythmias cases except Normal Sinus Rhythm (N):
arrhythmiaMultipleQRS = extractMultipleQRS(arrhythmiaPeriods, sizeEcgSig, timeEcgSig, ecgsig, tmSeg, filename, type);
- Decompose the windowed-signal into time-varying frequency (scale) components with MODWT and IMODWT and extract the signal peaks amplitude and locations (feature characteristics). This command will also plot and save in /matlab folder a PNG image for each plot - for any arrhythmias cases except Normal Sinus Rhythm (N):
DWTsignalPeaks = extractDWTsignalPeaks(arrhythmiaMultipleQRS, 0.5, 0.150, filename, type);
- Extract age, sex and medicine intake as feature characteristics:
[age, sex, medicine] = readPatientInfo(filepath)
- Lastly, extract the ECG features from the DWTsignalPeaks to a CSV or to another variable:
features = extractEcgFeatures(DWTsignalPeaks, exportFilename);
Below there are some extractions made accordingly to the arrhythmia availability in each MIT-BIH arrhythmia database file:
features = extractExampleFeaturesFromEcg('100m', '../data/100m', 'N', '../data/exported/N-100m');
features = extractExampleFeaturesFromEcg('101m', '../data/101m', 'N', '../data/exported/N-101m');
features = extractExampleFeaturesFromEcg('106m', '../data/106m', 'B', '../data/exported/B-106m');
features = extractExampleFeaturesFromEcg('106m', '../data/106m', 'T', '../data/exported/T-106m');
features = extractExampleFeaturesFromEcg('106m', '../data/106m', 'VT', '../data/exported/VT-106m');
features = extractExampleFeaturesFromEcg('119m', '../data/119m', 'B', '../data/exported/B-119m');
features = extractExampleFeaturesFromEcg('200m', '../data/200m', 'VT', '../data/exported/VT-200m');
features = extractExampleFeaturesFromEcg('201m', '../data/201m', 'T', '../data/exported/T-201m');
features = extractExampleFeaturesFromEcg('203m', '../data/203m', 'VT', '../data/exported/VT-203m');
features = extractExampleFeaturesFromEcg('205m', '../data/205m', 'VT', '../data/exported/VT-205m');
features = extractExampleFeaturesFromEcg('207m', '../data/207m', 'VT', '../data/exported/VT-207m');
features = extractExampleFeaturesFromEcg('208m', '../data/208m', 'T', '../data/exported/T-208m');
features = extractExampleFeaturesFromEcg('210m', '../data/210m', 'B', '../data/exported/B-210m');
features = extractExampleFeaturesFromEcg('213m', '../data/213m', 'VT', '../data/exported/VT-213m');
features = extractExampleFeaturesFromEcg('214m', '../data/214m', 'VT', '../data/exported/VT-214m');
features = extractExampleFeaturesFromEcg('215m', '../data/215m', 'VT', '../data/exported/VT-215m');
features = extractExampleFeaturesFromEcg('223m', '../data/223m', 'VT', '../data/exported/VT-223m');
features = extractExampleFeaturesFromEcg('233m', '../data/233m', 'VT', '../data/exported/VT-233m');
As seen, there were some files that weren't read, as anothers that some of their arrhythmia couldn't be read. The list of files associated with each arrhythmia analysed is listed below:
Normal Synus Rhythm: All
Ventricular Bigeminy: 106, 119, 210
Ventricular Trigeminy: 106, 119, 201, 208, 210
Ventricular Tachycardia: 106, 200, 203, 205, 207, 210, 213, 214, 215, 223, 233
MACHINE LEARNING STEPS
The supervised training was divided in two softwares: WEKA and MATLAB. While WEKA needs an an ARFF (Attribute-Relation File Format) file converted from the exported CSV, MATLAB needs to convert the CSV to a matrix, which were done with csv2matrix.
There were two main CSV files extracted: all-samples.csv and all-samples-proportion.csv. While the all-samples.csv file has 3672 samples with unproportional Normal Synus quantity, the all-samples-proportion.csv file has 205 proportional samples. With these two files, a 80/20 percentage split was made, spliting each file in training and testing. Most of WEKA and MATLAB tests used the proportional files, using the training files for the 10 folds cross-validation (to obtain average accuracy) and the testing files for test sets.
WEKA TRAINING STEPS
Inside WEKA explorer, open the ARFF file (all-samples-proportion-training.arff) in the preprocess tab:
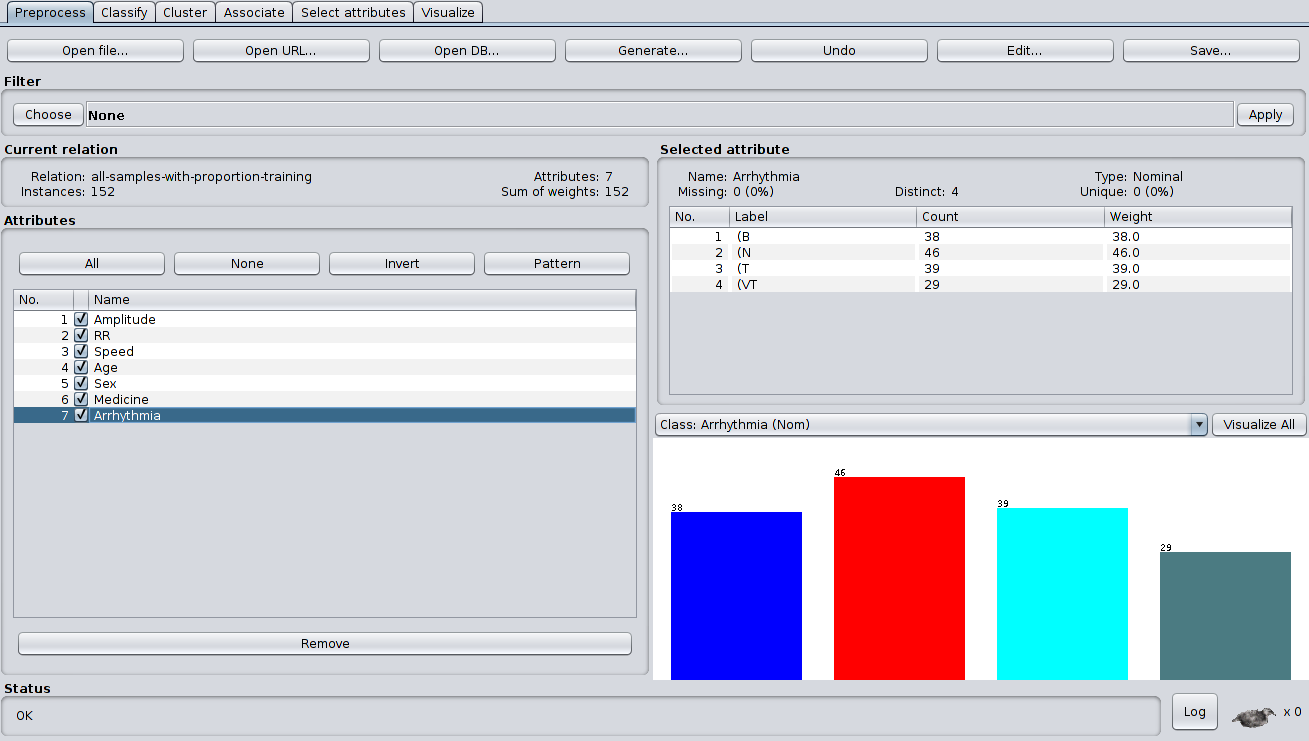
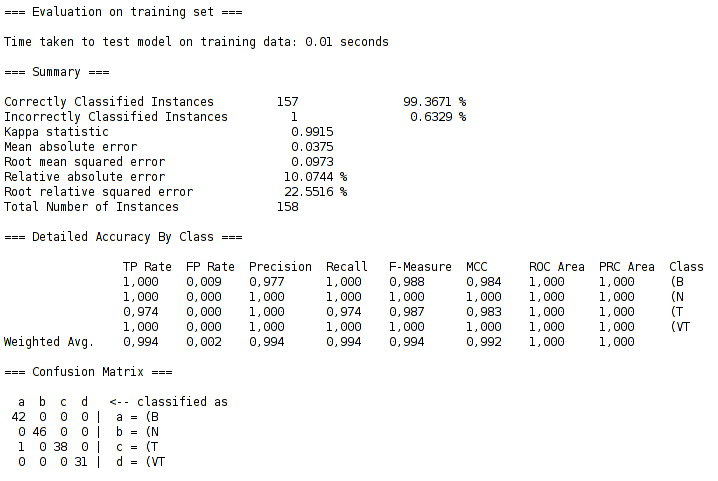
After the file was loaded, the machine learning process can be instantiated with a classifier option (Bayesian Networks, Neural Networks, Trees and others) and a test option. In this project, six supervised classifiers were choosen to test in WEKA (BayesNet, NaiveBayes, MultilayerPerceptron, IBk, J48 and Random Forest) with a percentage split of 80% (80% of the data to training and the 20% rest to testing). The testing results show average accuracy, as well as the confusion matrix, which summarizes the accuracy for each true label class, as the RandomForest results below:
MATLAB TRAINING STEPS
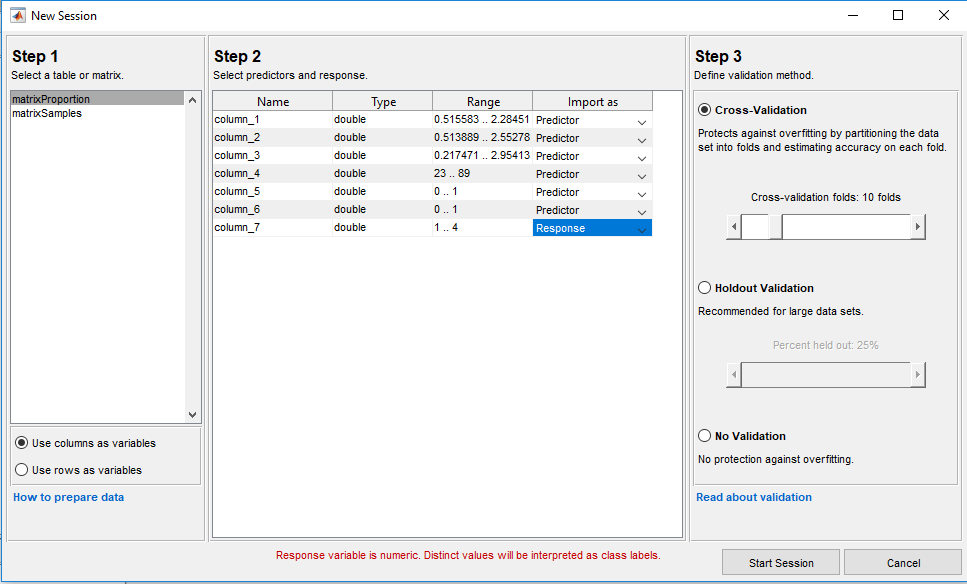
Inside MATLAB R2017b, open the Classification Learner App, with MATLAB Toolstrip or prompt:
classificationLearner
In a new classification session, there are three main steps that needs to be followed:
-
Select a table or matrix, which will be used from the csv2matrix;
-
Select variables as predictors and response (true label);
-
Define validation method, which in this project the cross-validation was used.
After the configuration well established, any classifiers from the toolbox can be selected to train the selected samples. If Parallel Computing Toolbox is installed, MATLAB will provide the option of training all classifiers at the same time, not affecting the final time results. In this project, eighteen supervised classifiers were choosen to test in MATLAB (Complex/Medium/Simple Trees, Fine/Medium/Coarse/Cosine/Cubic/Weighted KNN, Linear/Quadratic/Cubic SVM, Fine/Medium/Coarse Gaussian SVM, Boosted/Bagged Trees and Discriminant Subspace) with a percentage split of 80% (80% of the data to training and the 20% rest to testing). The testing results show average accuracy for each of the used classifier:
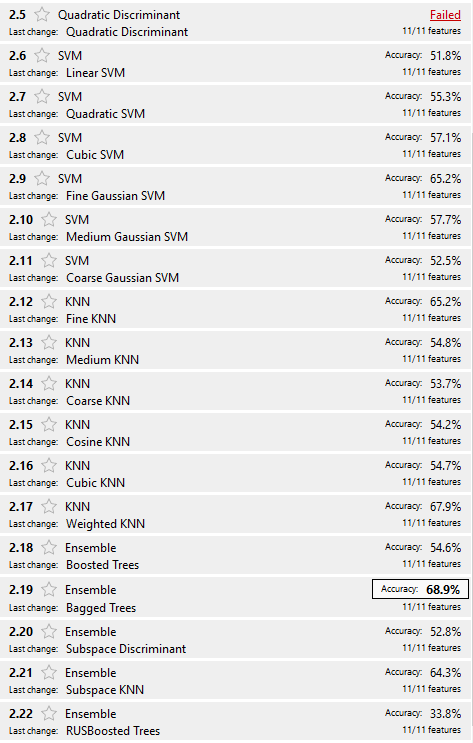
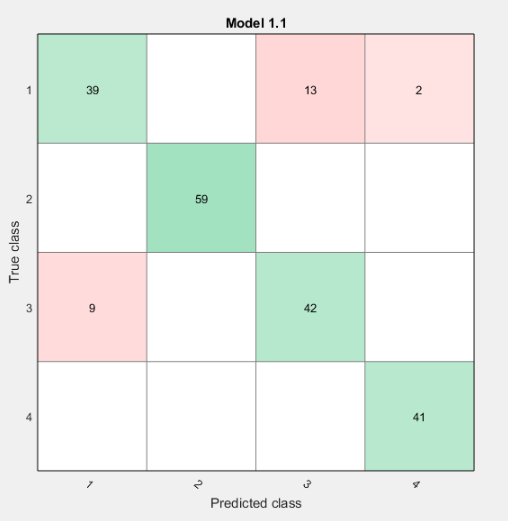
Each classifier can show the confusion matrix, which summarizes the accuracy for each true label class, as the ComplexTrees results below:
With the evaluation test (split instances and confusion matrix) results for each WEKA and MATLAB, the ECG arrhythmia extraction and analysis were well evaluated for the Random Forest and BayesNet algorithms, while for the CoarseKNN and BoostedTrees algorithms the results were the worst ones. All the results can be seen in /Training Data/Results/ folder, and the comparison for each classifier type can be read in more detail in the Final Article.
AUTHORS
This work was developed to an AI undergrad-subject last project. The people involved in the project were:
Student: KAWASAKI, Davi // davishinjik [at] gmail.com
Student: FLAUSINO, Matheus // matheus.negocio [at] gmail.com
Professor: SAITO, Priscila Tiemi Maeda // psaito [at] utfpr.edu.br
CONTACT & FEEDBACKS
Feel free to contact or pull request me to any relevant updates you may enquire:
KAWASAKI, Davi // davishinjik [at] gmail.com