This project is not supported anymore. Feel free to fork and extend it on your own.
Arrhythmia Classification through Characteristics Extraction with Discrete Wavelet Transform & Machine Learning
⚠️ There is a continuation of this project, with more features extracted and supervised learning using MATLAB, developed to my Artificial Intelligence College Final Work. This repository is outdated, with a smaller version of the AI project.
This work covers cardiac arrhythmia classification through extraction of heart waves characteristics using discrete wavelet transform to filter the signal and machine learning to classify the exported characteristics with labels.
The goal was to classify at least two arrhythmia through some extracted characteristics with a data mining software.
SOFTWARES USED
LIBRARIES USED
This directory contains the entire MIT-BIH Arrhythmia Database. About half (25 of 48 complete records, and reference annotation files for all 48 records) of this database has been freely available here since PhysioNet's inception in September 1999. The 23 remaining signal files, which had been available only on the MIT-BIH Arrhythmia Database CD-ROM, were posted here in February 2005.
The recordings were digitized at 360 samples per second per channel with 11-bit resolution over a 10 mV range. Two or more cardiologists independently annotated each record; disagreements were resolved to obtain the computer-readable reference annotations for each beat (approximately 110,000 annotations in all) included with the database.
This example shows how to use wavelets to analyze electrocardiogram (ECG) signals. ECG signals are frequently nonstationary meaning that their frequency content changes over time. These changes are the events of interest.
Wavelets decompose signals into time-varying frequency (scale) components. Because signal features are often localized in time and frequency, analysis and estimation are easier when working with sparser (reduced) representations.
The QRS complex consists of three deflections in the ECG waveform. The QRS complex reflects the depolarization of the right and left ventricles and is the most prominent feature of the human ECG.
This function reads a pair of files (RECORDm.mat and RECORDm.info) generated by 'wfdb2mat' from a PhysioBank record, baseline-corrects and scales the time series contained in the .mat file, and plots them. The baseline-corrected and scaled time series are the rows of matrix 'val', and each column contains simultaneous samples of each time series.
DIGITAL SIGNAL PROCESSING STEPS
There are two MATLAB functions to extract arrhythmia heart waves characteristics: single QRS wave (singleExampleWithDWTsignalPeaksExtraction.m) or multiples QRS waves (extractExampleFeaturesFromEcg). The first one it's necessary to insert the period or time that the features need to be extracted, while the second one multiples arrhythmia features are extracted from QRS waves labels.
Single Extraction Example With DWT signal Peaks (singleExampleWithDWTsignalPeaksExtraction.m)
To test a single extraction, run the following command on MATLAB:
[tmSeg,ecgsig,Fs,sizeEcgSig,timeEcgSig,annotationsEcg,qrsExtracted,tmExtracted,ecgsigTransf,qrsPeaks,locs] = singleExampleWithDWTsignalPeaksExtraction('200m', '../data/200m', 'VT', 0, 7.517, 2706, 0.5, 0.150);
This command will follow these steps:
- Load ECG signal from MIT-BIH database file, extracting signal time vector, signal vector, signal frequency, signal samples size and signal time size (in seconds):
[tmSeg,ecgsig,Fs,sizeEcgSig,timeEcgSig] = loadEcgSignal(filepath);
- Load ECG signal professional annotations, receiving in an object the time, period and arrhythmia types for each instant:
annotationsEcg = readAnnotations(filepath);
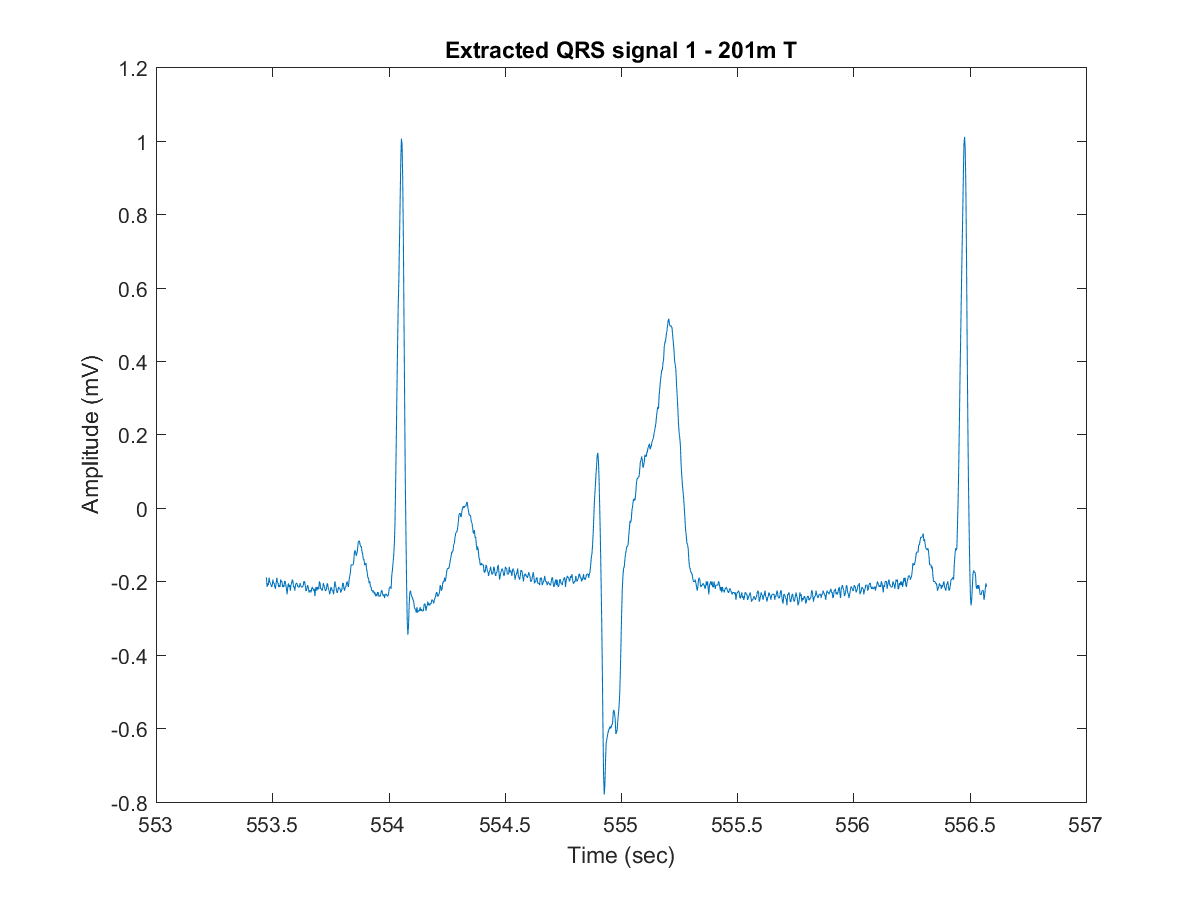
- Extract the QRS wave window in a signal and time vectors, plotting them in the end:
[qrsExtracted, tmExtracted] = plotExtractSingleQRS(minute, seconds, period, sizeEcgSig, timeEcgSig, ecgsig, tmSeg, filename, arrhythmiaType);
- Decompose the windowed-signal into time-varying frequency (scale) components with MODWT (Maximal overlap discrete wavelet transform) and IMODWT (Inverse Maximal overlap discrete wavelet transform) in the chosen scale:
ecgsigTransf = dwtSignal(qrsExtracted, scale);
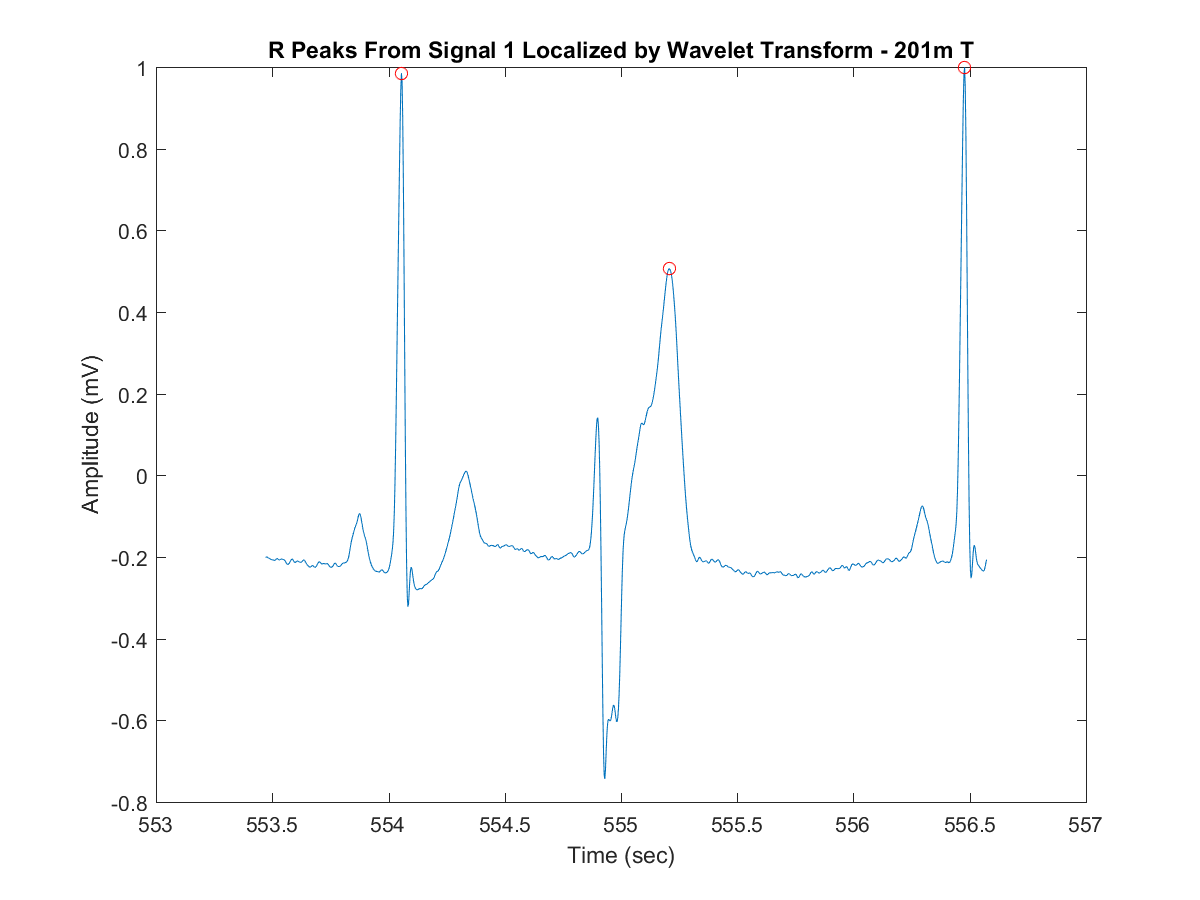
- Extract and plot the peaks amplitude and locations (feature characteristics) on the windowed-signal filtered after the last step:
[qrsPeaks,locs] = plotDWTsignalPeaks(ecgsigTransf, tmExtracted, minPeakHeight, minPeakDistance);
Multiple Extractions Example With DWT signal Peaks (extractExampleFeaturesFromEcg.m)
To test a multiple features extraction, run the following command on MATLAB:
features = extractExampleFeaturesFromEcg('200m', '../data/200m', 'VT', '../data/exported/vt-200m');
This command will follow these steps:
- Load ECG signal from MIT-BIH database file, extracting signal time vector, signal vector, signal frequency, signal samples size and signal time size (in seconds):
[tmSeg,ecgsig,Fs,sizeEcgSig,timeEcgSig] = loadEcgSignal(filepath);
- Read the arrhythmia periods of the chosen arrhythmia type from the professional annotations file. This will result in an object with the time, period and arrhythmia types for each instant:
arrhythmiaPeriods = readArrythmiaPeriods(type, filepath);
- Extract the QRS wave windows in signal and time vectors inside a arrhythmiaMultipleQRS object. This command will also plot and save in /matlab folder a PNG image for each plot - for any arrhythmias cases except Normal Sinus Rhythm (N):
arrhythmiaMultipleQRS = extractMultipleQRS(arrhythmiaPeriods, sizeEcgSig, timeEcgSig, ecgsig, tmSeg, filename, type);
- Decompose the windowed-signal into time-varying frequency (scale) components with MODWT and IMODWT and extract the signal peaks amplitude and locations (feature characteristics). This command will also plot and save in /matlab folder a PNG image for each plot - for any arrhythmias cases except Normal Sinus Rhythm (N):
DWTsignalPeaks = extractDWTsignalPeaks(arrhythmiaMultipleQRS, 0.5, 0.150, filename, type);
- Lastly, extract the ECG features from the DWTsignalPeaks to a CSV or to another variable:
features = extractEcgFeatures(DWTsignalPeaks, exportFilename);
Below there are some extractions made accordingly to the arrhythmia availability in each MIT-BIH arrhythmia database file:
features = extractExampleFeaturesFromEcg('100m', '../data/100m', 'N', '../data/exported/N-100m');
features = extractExampleFeaturesFromEcg('101m', '../data/101m', 'N', '../data/exported/N-101m');
features = extractExampleFeaturesFromEcg('106m', '../data/106m', 'B', '../data/exported/B-106m');
features = extractExampleFeaturesFromEcg('106m', '../data/106m', 'T', '../data/exported/T-106m');
features = extractExampleFeaturesFromEcg('106m', '../data/106m', 'VT', '../data/exported/VT-106m');
features = extractExampleFeaturesFromEcg('119m', '../data/119m', 'B', '../data/exported/B-119m');
features = extractExampleFeaturesFromEcg('200m', '../data/200m', 'VT', '../data/exported/VT-200m');
features = extractExampleFeaturesFromEcg('201m', '../data/201m', 'T', '../data/exported/T-201m');
features = extractExampleFeaturesFromEcg('203m', '../data/203m', 'VT', '../data/exported/VT-203m');
features = extractExampleFeaturesFromEcg('205m', '../data/205m', 'VT', '../data/exported/VT-205m');
features = extractExampleFeaturesFromEcg('207m', '../data/207m', 'VT', '../data/exported/VT-207m');
features = extractExampleFeaturesFromEcg('208m', '../data/208m', 'T', '../data/exported/T-208m');
features = extractExampleFeaturesFromEcg('210m', '../data/210m', 'B', '../data/exported/B-210m');
features = extractExampleFeaturesFromEcg('213m', '../data/213m', 'VT', '../data/exported/VT-213m');
features = extractExampleFeaturesFromEcg('214m', '../data/214m', 'VT', '../data/exported/VT-214m');
features = extractExampleFeaturesFromEcg('215m', '../data/215m', 'VT', '../data/exported/VT-215m');
features = extractExampleFeaturesFromEcg('223m', '../data/223m', 'VT', '../data/exported/VT-223m');
features = extractExampleFeaturesFromEcg('233m', '../data/233m', 'VT', '../data/exported/VT-233m');
As seen, there were some files that weren't read, as anothers that some of their arrhythmia couldn't be read. The list of files associated with each arrhythmia analysed is listed below:
Normal Synus Rhythm: All
Ventricular Bigeminy: 106, 119, 210
Ventricular Trigeminy: 106, 119, 201, 208, 210
Ventricular Tachycardia: 106, 200, 203, 205, 207, 210, 213, 214, 215, 223, 233
MACHINE LEARNING STEPS
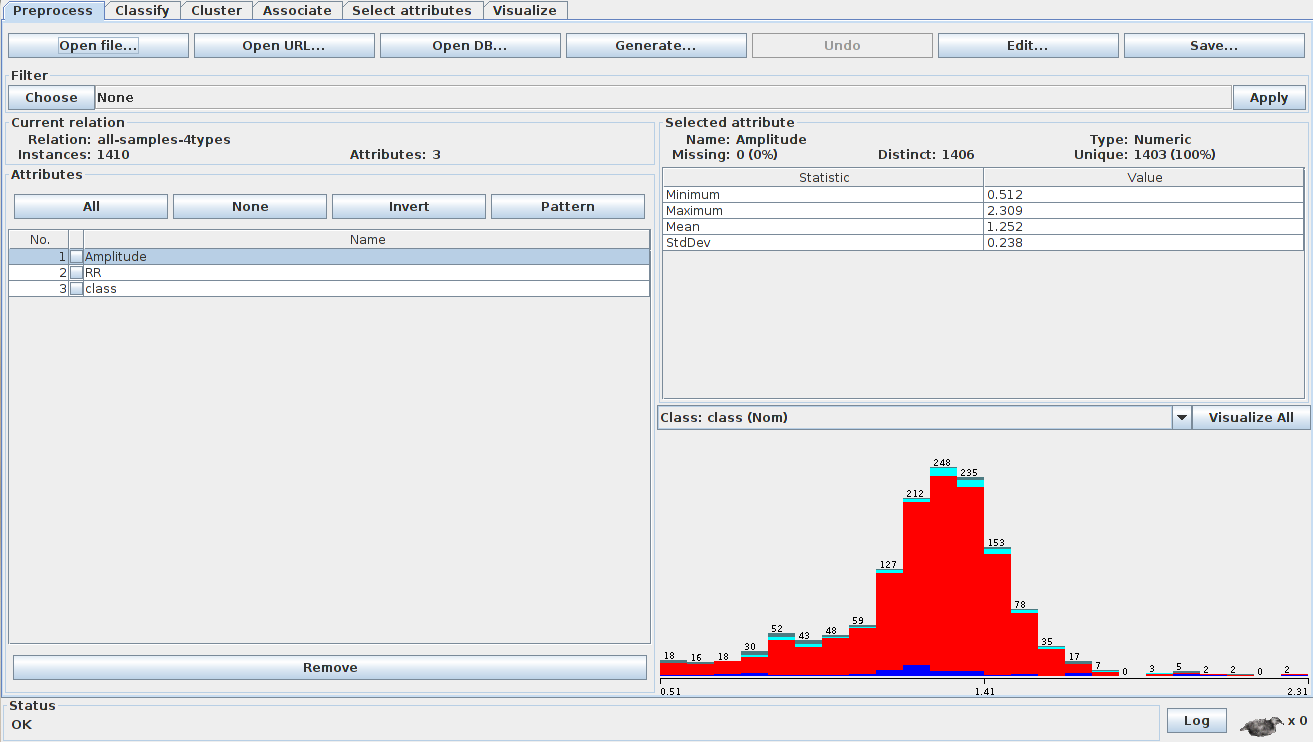
With the features extracted in a CSV, an ARFF (Attribute-Relation File Format) file was constructed to be inputed in WEKA software.
Inside WEKA explorer, open the ARFF file (4types.arff) in the preprocess tab:
After the file was loaded, the machine learning process can be instantiated with a classifier option (Bayesian Networks, Neural Networks, Trees and others) and a test option. In this project, two classifiers were choosen to test (ANN and Random Forest) with a percentage split of 80% (80% of the data to training and the 20% rest to testing):
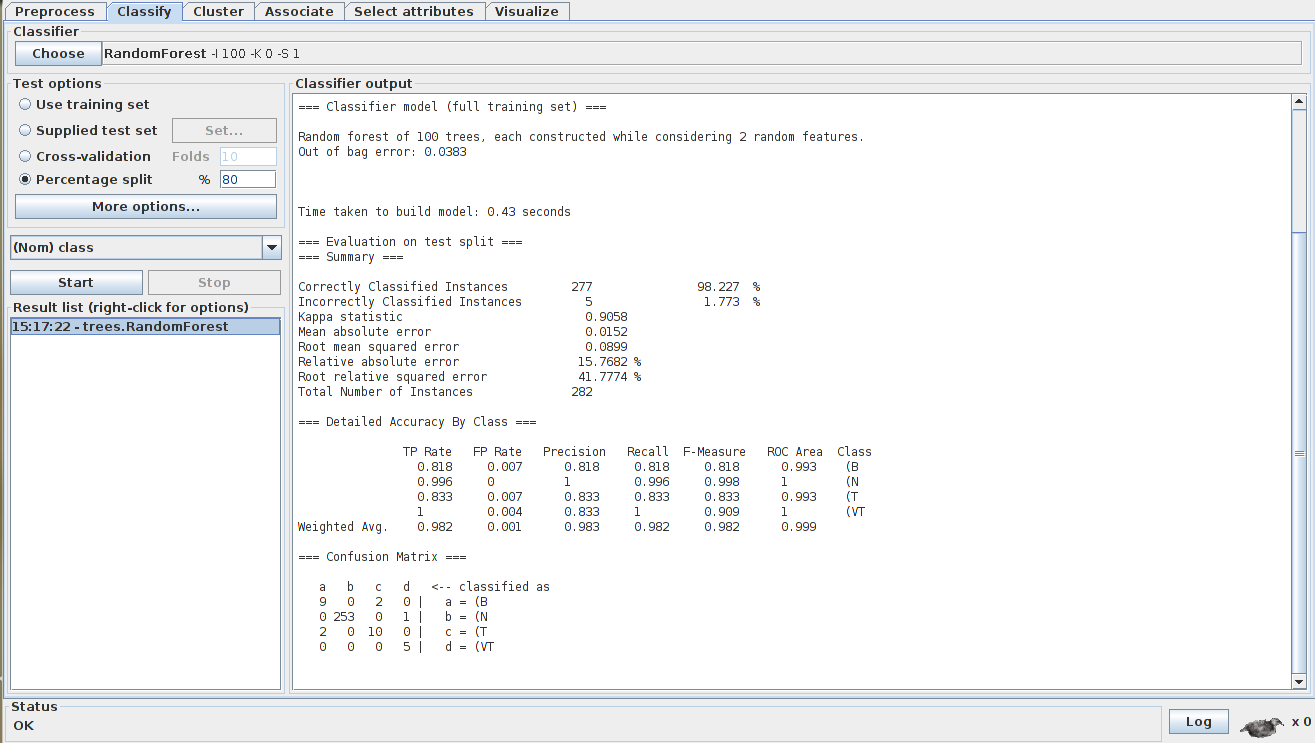
With the test evaluation (split instances and confusion matrix) results, the ECG arrhythmia extraction and analysis were well evaluated for the Random Forest algorithm, while for the ANN algorithm the results weren't quite expected.
AUTHORS
This work was meant to a DSP undergrad-subject last project. The people involved in the project were:
Student: KAWASAKI, Davi
Student: ROZAN, Higor Augusto Bassi
Student: BERTONCINI, João Vitor
Student: ROMANO, Vinicius Drago
Professor: SPATTI, Danilo Hernane