rangle / Augury Labs
Programming Languages
Projects that are alternatives of or similar to Augury Labs
Augury Labs
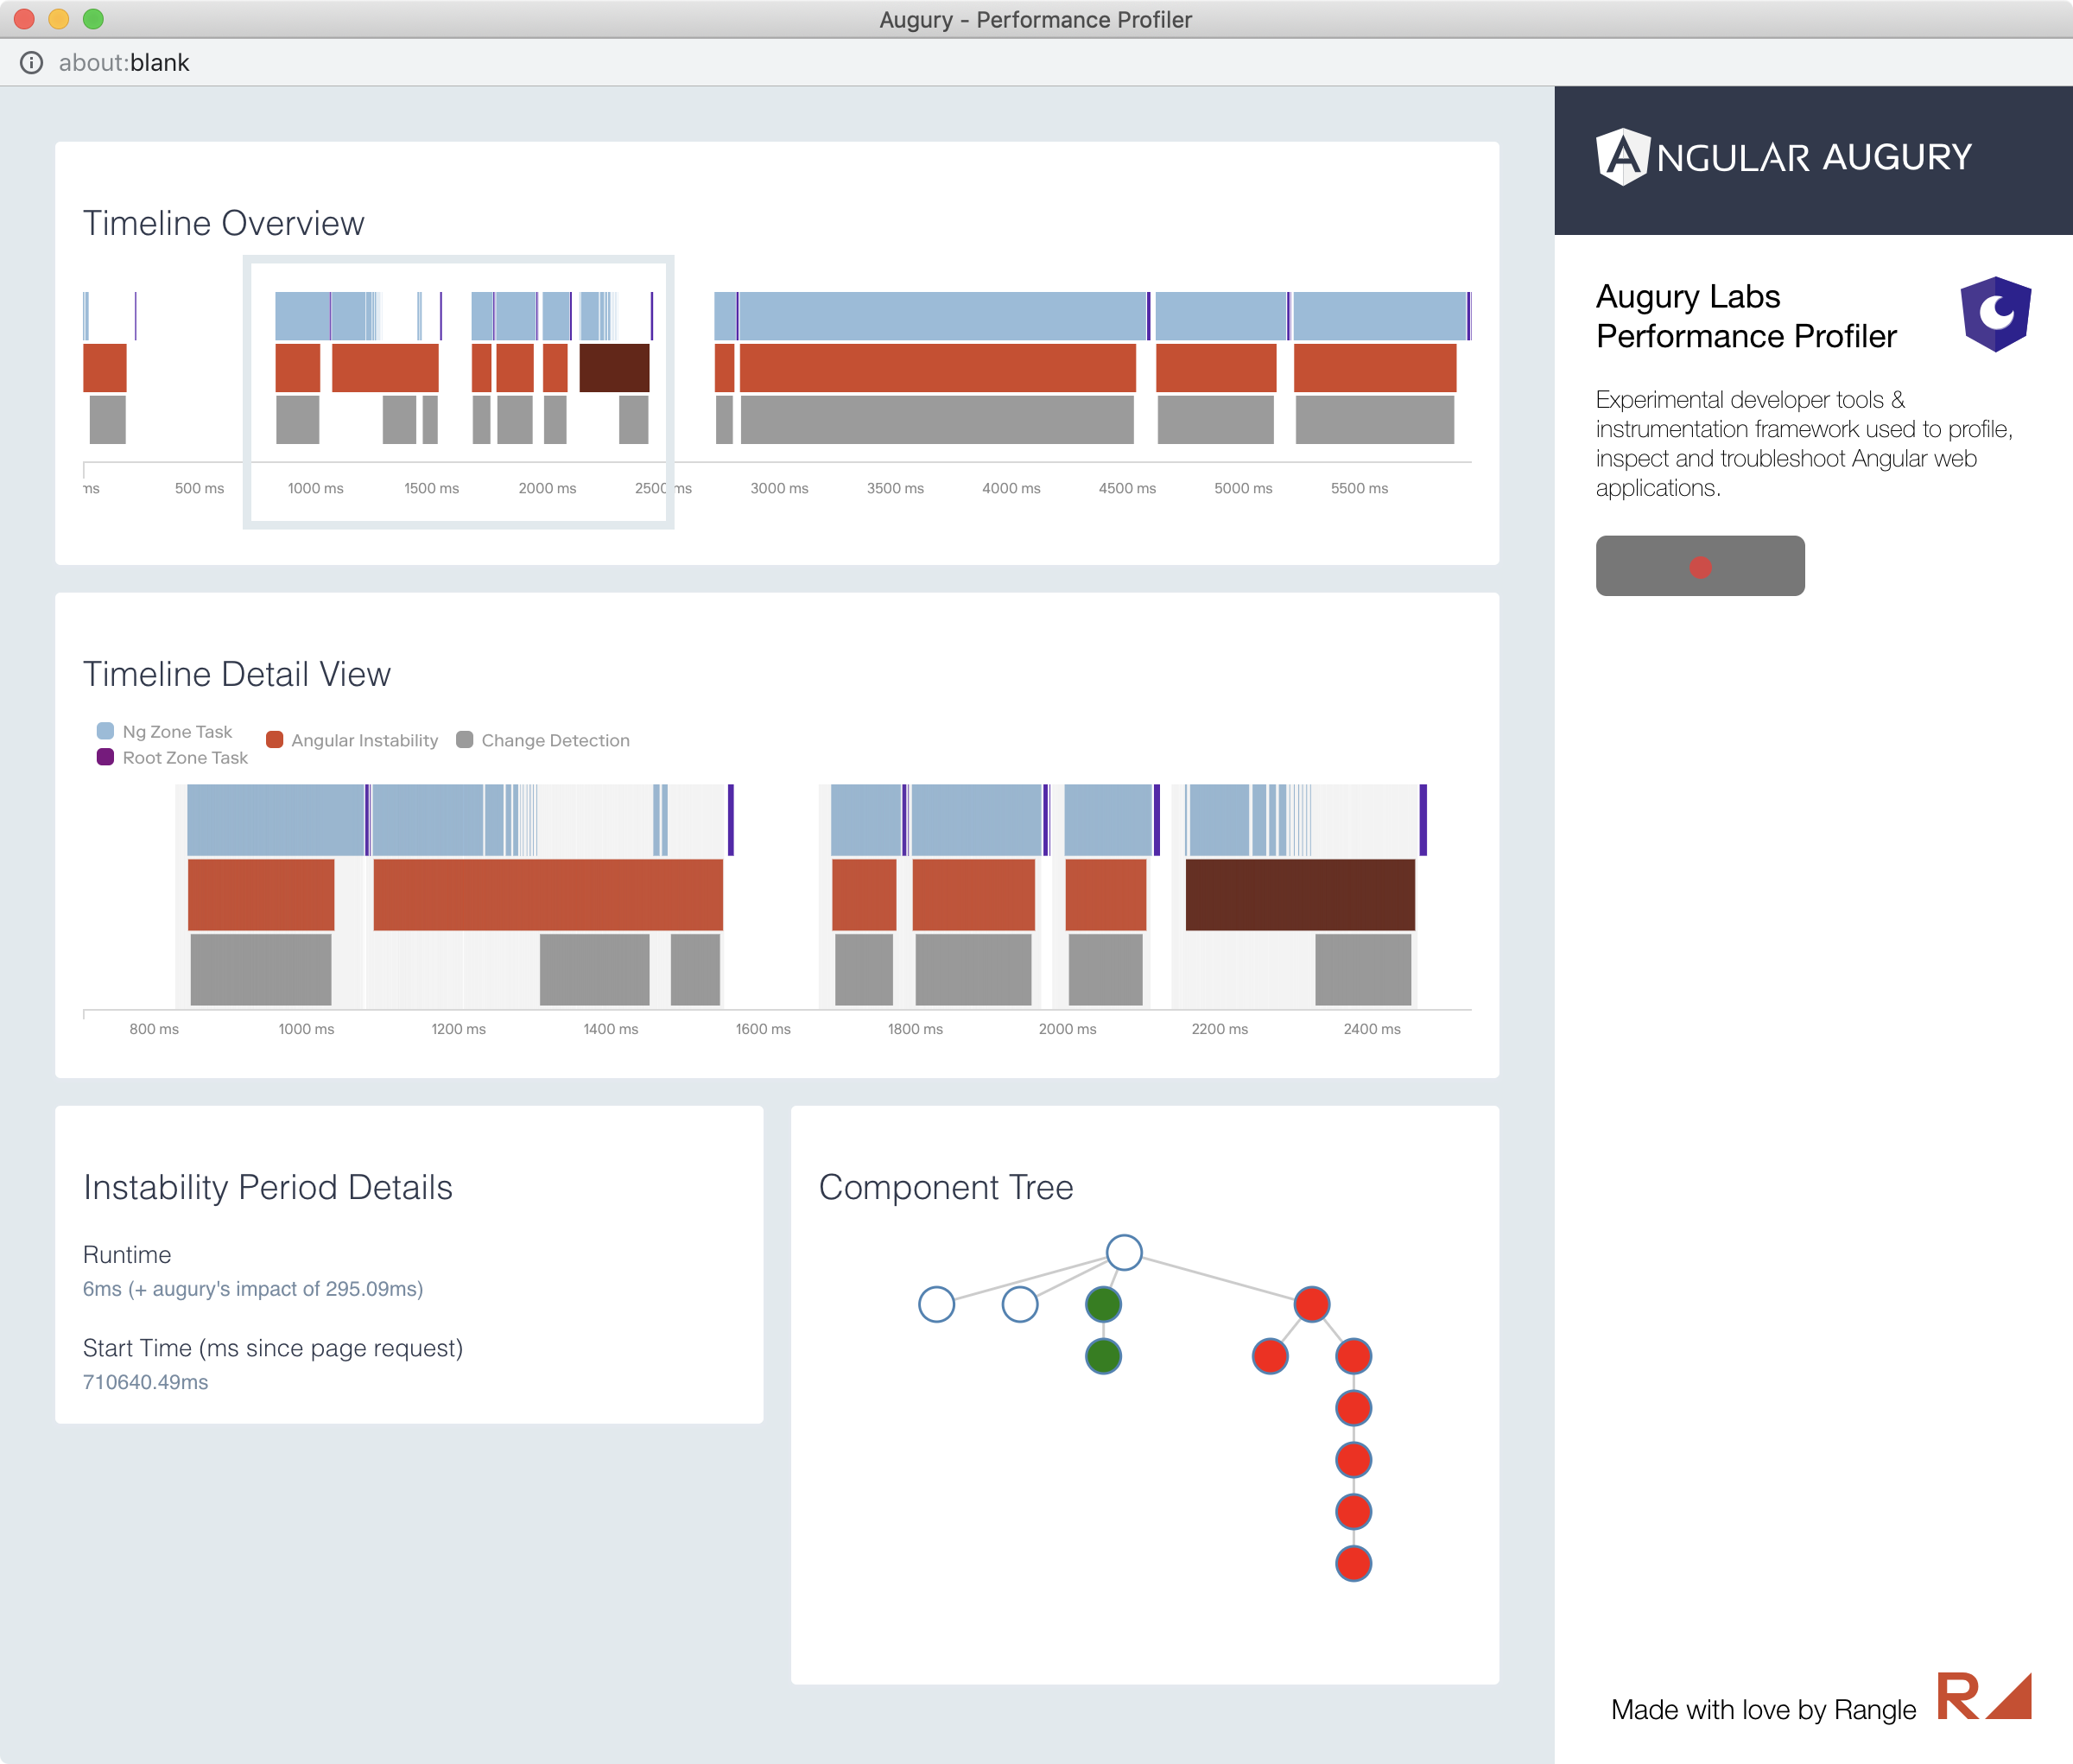
Augury Labs is a project that provides developers with experimental tools and an instrumentation framework used to profile, inspect and troubleshoot Angular applications.
About
Augury Labs is a new instrumentation & inspection framework for Angular
applications that allows for easy installation of specialized developer tools. We have recently
released the Performance Profiler Plugin, which can help you tune the performance of your
applications by providing insights into the following:
- Details of Angular change detection & instability periods
- When zone.js tasks occur and what triggered them
- Component tree details for each instability period (structure, added, removed, etc.)
- When and how long change detection took with a breakdown for individual components
- A detailed timeline to illustrate and explore correlations
After installing and configuring the npm packages, you can run
your app while augury-labs collects raw data about the runtime characteristics of your application.
This raw data is then processed into more meaningful information that you can explore to gain
valuable insights into your applications runtime behaviour.
In the spirit of the Augury DevTool Extension we set out to help Angular developers better understand how their applications are running and provide insights into how they can make them better. Augury labs is a culmination of these idea and distrubted as a set of npm packages & plugin system. We hope you find it useful!
For more information about how this works, please read the architecture guide.
NOTE: This tool is still experimental. Feedback is greatly appreciated 😄
Packages
- @augury/core - The main package responsible for collecting raw data and communicating with registered plugins. Also contains the core bootstrap procedure that injects the instrumentation code into your application.
-
@augury/performance-profiler-plugin -
Opens a popup window dashboard, displaying the execution of your app as a timeline graph,
showing the interaction between
Zone.jstasks, Angular's stability cycles & change detection.
Installation
To setup augury-labs in your application you have two alternatives.
NOTE: The following assumes your application is a standard Angular CLI setup.
Using the Angular CLI ng add command will install the correct dependencies, perform the necessary configuration and execute initialization code.
ng add @augury/schematics
DISCLAIMER: This assumes your application are using the Angular Devkit 6+
To setup and install Augury manually, follow the manual installation.
Guides
Examples
Other Experiments
Here are some other unpublished experimental plugins:
-
Unit Tester - Proof of concept which allows programmatic access
to
@augury/coreto be used ine2etests. This could be used to check for acceptable thresholds of runtime behaviour in specific areas of your application.
Have other ideas? See our CONTRIBUTING guide.
Troubleshooting
If your having trouble running augury-labs, please submit a GitHub Issue.
Known Issues
-
Lazy loaded modules cannot currently be instrumented due to how
augury-labswraps the Angular boostrap process. See GitHub Issue. -
Large component trees can cause some performance issues. We are looking into ways to mitigate this. You can use the start & pause recording buttons on the specific areas you would like to profile. This will help reduce the performance impact to shorter profiling periods.
-
Because the bootstrap code in this
main.augury.tsfile is different from Angular's bootstrap code you may need to tell the Angular CLI builder where is the main module of your application, adding a"entryModule": "./app/app.module#AppModule"to the"angularCompilerOptions"object of your application'stsconfig.jsonfile. Replace the path and name of the module if you changed it from the defaults.
Contributing
We'd love to have your helping hand on augury-labs! See CONTRIBUTING.md for
more information on what we're looking for and how to get started.
License
Augury Labs is open source software licensed as MIT.


