All Projects → pedroj → Bipartite_plots

pedroj / Bipartite_plots

Licence: gpl-3.0
`ggbipart`, an R package for plotting bipartite networks

Projects that are alternatives of or similar to Bipartite plots

pathway-mapper
PathwayMapper: An interactive and collaborative graphical curation tool for cancer pathways
Stars: ✭ 47 (+113.64%)
Mutual labels:  network-visualization
Net Glimpse
1) Real-time visualization of network traffic (Ethernet and Internet), and 2) Streaming of header data from your network interfaces via WebSockets
Stars: ✭ 310 (+1309.09%)
Mutual labels:  network-visualization
Enms
An enterprise-grade vendor-agnostic network automation platform.
Stars: ✭ 595 (+2604.55%)
Mutual labels:  network-visualization
Pyvis
Python package for creating and visualizing interactive network graphs.
Stars: ✭ 277 (+1159.09%)
Mutual labels:  network-visualization
Letsmapyournetwork
Lets Map Your Network enables you to visualise your physical network in form of graph with zero manual error
Stars: ✭ 305 (+1286.36%)
Mutual labels:  network-visualization
Graphpath
Graphpath generates an ASCII network diagram from the route table of a Unix/Linux
Stars: ✭ 321 (+1359.09%)
Mutual labels:  network-visualization
cytoscape.js-context-menus
A Cytoscape.js extension to provide context menu around elements and core instance
Stars: ✭ 63 (+186.36%)
Mutual labels:  network-visualization
Scapy
Scapy: the Python-based interactive packet manipulation program & library. Supports Python 2 & Python 3.
Stars: ✭ 6,932 (+31409.09%)
Mutual labels:  network-visualization
Nxviz
Visualization Package for NetworkX
Stars: ✭ 307 (+1295.45%)
Mutual labels:  network-visualization
Awesome Network Stuff
Resources about network security, including: Proxy/GFW/ReverseProxy/Tunnel/VPN/Tor/I2P, and MiTM/PortKnocking/NetworkSniff/NetworkAnalysis/etc。More than 1700 open source tools for now. Post incoming.
Stars: ✭ 578 (+2527.27%)
Mutual labels:  network-visualization
Cyberscan
CyberScan: Network's Forensics ToolKit
Stars: ✭ 280 (+1172.73%)
Mutual labels:  network-visualization
Netdisco
A web-based network management tool.
Stars: ✭ 291 (+1222.73%)
Mutual labels:  network-visualization
Envizon
network visualization & vulnerability management/reporting
Stars: ✭ 382 (+1636.36%)
Mutual labels:  network-visualization
graph-explorer
Graph Explorer
Stars: ✭ 27 (+22.73%)
Mutual labels:  network-visualization
Tw5 Tiddlymap
Map drawing and topic visualization for your wiki
Stars: ✭ 620 (+2718.18%)
Mutual labels:  network-visualization
CS231n
My solutions for Assignments of CS231n: Convolutional Neural Networks for Visual Recognition
Stars: ✭ 30 (+36.36%)
Mutual labels:  network-visualization
Dash Cytoscape
Interactive network visualization in Python and Dash, powered by Cytoscape.js
Stars: ✭ 309 (+1304.55%)
Mutual labels:  network-visualization
Ggraph
Grammar of Graph Graphics
Stars: ✭ 815 (+3604.55%)
Mutual labels:  network-visualization
Neovis.js
Neo4j + vis.js = neovis.js. Graph visualizations in the browser with data from Neo4j.
Stars: ✭ 748 (+3300%)
Mutual labels:  network-visualization
React D3 Graph
Interactive and configurable graphs with react and d3 effortlessly
Stars: ✭ 541 (+2359.09%)
Mutual labels:  network-visualization

ggbipart: An R package for plotting bipartite networks

Build Status

The ggbipart package includes a series of R functions aimed to plot bipartite networks. Bipartite networks are a special type of network where nodes are of two distinct types or sets, so that connections (links) only exist among nodes of the different sets.

As in other types of network, bipartite structures can be binary (only the presence/absence of the links is mapped) or quantitative (weighted), where the links can have variable importance or weight.

To plot, we start with an adjacency or incidence matrix. I'm using matrices that illustrate ecological interactions among species, such as the mutualistic interactions of animal pollinators and plant flowers. The two sets (modes) of these bipartite networks are animals (pollinators) and plants species.

From any adjacency matrix we can get a network object or an igraph object for plotting and analysis. The main function in the package is bip_ggnet.

Installation

devtools::install_github("pedroj/bipartite_plots")
library(ggbipart)

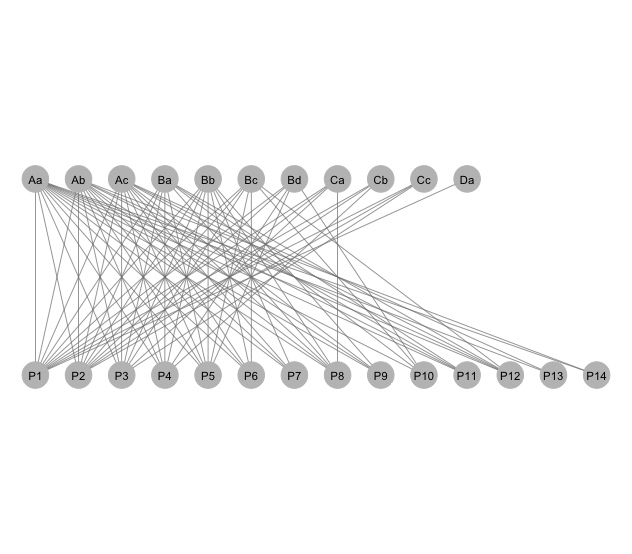
An unweighted, binary network

This graph uses function bip_railway.

# Plot layout coordinates for railway networkplot. Input is the
# adjacency matrix.
#
mymat <- read.delim("./data/data.txt", row.names=1)   # Not run.
g<- bip_railway(mymat, label=T)
g+ coord_flip()

bip_ggnet1

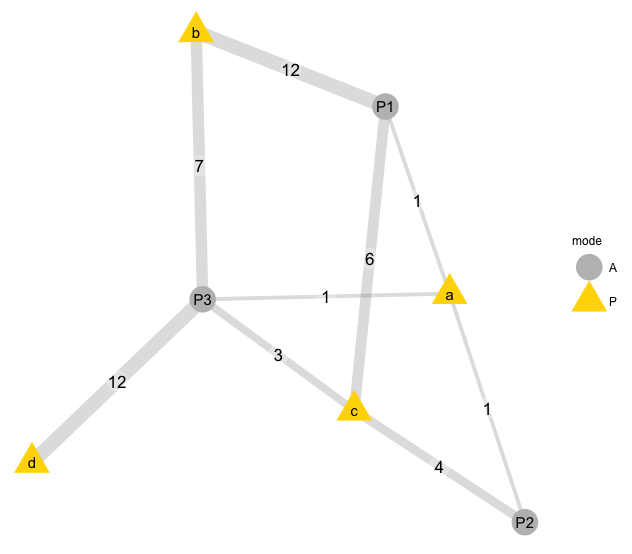
A weighted network with edges labelled

This graph uses function bip_ggnet, with labelled edges.

#-----------------------------------------------------------
# Simple graph prototype for a weighted network.

bip= data.frame(P1= c(1, 12, 6, 0),
                P2= c(1, 0, 4, 0),
                P3= c(1, 7, 3, 12),
     row.names= letters[1:4])
col= c("A"= "grey80", "P"= "gold2")
bip.net<- bip_init_network(as.matrix(bip))

bip_ggnet(bip.net, as.matrix(bip),
       #  color= "mode", palette = col,
          edge.label = "weights",
          label= TRUE)
#-----------------------------------------------------------
#

bip_ggnet1

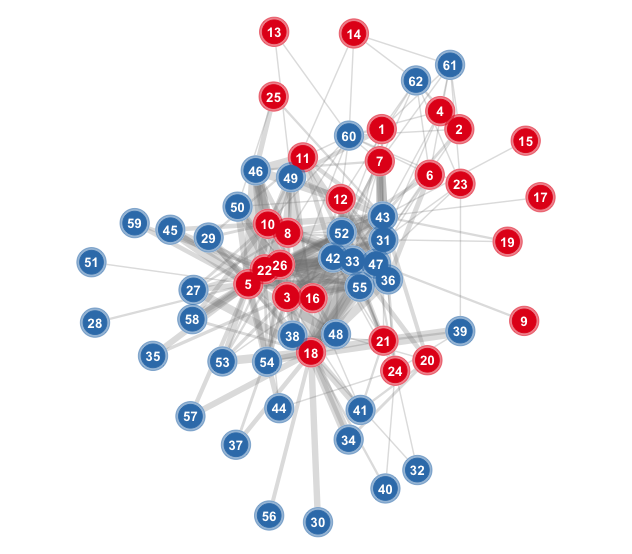
A weighted network with nodes numbered

This graph uses function bip_ggnet, with labelling nodes modified with additional geoms.

#-----------------------------------------------------------
# Numbered nodes
# The Nava de las Correhuelas dataset.
nch<- read.table("./data/sdw01_adj_fru.csv", 
                 header=T, sep=",", row.names=1,
                 dec=".", na.strings="NA")

nums<- as.vector(c(1:sum(dim(nch))))
pp3<- bip_ggnet(nch.net, as.matrix(nch),
          size= 0,
          shape= "mode",
          palette= "Set1",
          color= "mode",
          layout.exp = 0.25) +
          geom_point(aes(color= color), size= 10,
                         color= "white") +
          geom_point(aes(color= color), size= 10,
                         alpha= 0.5) +
          geom_point(aes(color= color), size= 8) +
          geom_text(aes(label= nums),
                        color= "white", size= 3.5,
                        fontface="bold") +
          guides(color= FALSE) +
          theme(legend.position="none")        # Hide legend
pp3
#-----------------------------------------------------------
#

bip_ggnet1

A detailed descripton of all the above code is in my git pages.

Note that the project description data, including the texts, logos, images, and/or trademarks, for each open source project belongs to its rightful owner. If you wish to add or remove any projects, please contact us at [email protected].