Niekes / D3 3d
Programming Languages
Labels
Projects that are alternatives of or similar to D3 3d
d3-3d
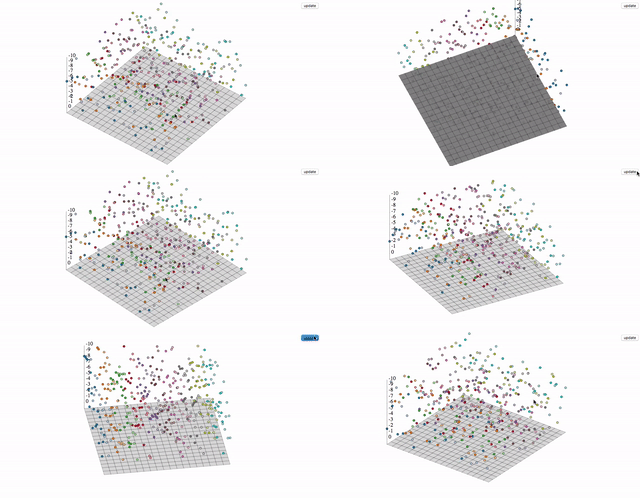
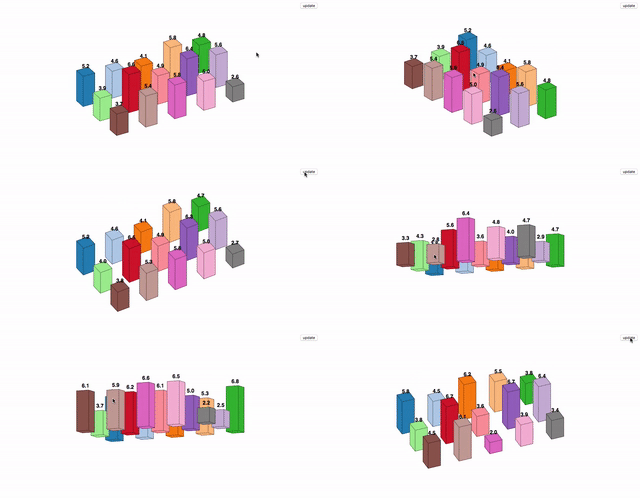
d3-3d is meant for 3d visualizations. d3-3d allows the projection of 3d data onto the screen in the webbrowser. It is specially designed to work with d3.js.
INFO: PLEASE DO NOT WRITE ME ON LINKEDIN, FACEBOOK OR TO MY PRIVATE E-MAIL. USE STACK OVERFLOW OR CREATE AN ISSUE ON GITHUB.
 |
 |
 |
Installing
If you use npm, npm install d3-3d. You can also download the latest release. Otherwise use unpkg to get the latest release. For example:
<script src="https://unpkg.com/d3-3d/build/d3-3d.js"></script>
For a specific version:
<script src="https://unpkg.com/[email protected]/build/d3-3d.js"></script>
For the minified version:
<script src="https://unpkg.com/[email protected]/build/d3-3d.min.js"></script>
Import
ES6:
import { _3d } from 'd3-3d' ;
API Reference
- d3._3d - create a new 3d function object.
- _3d.shape - set the shape.
- _3d.x - set the x accessor.
- _3d.y - set the y accessor.
- _3d.z - set the z accessor.
- _3d.scale - sets the scale for the projected points.
- _3d.rotateX - set the angle for the x rotation.
- _3d.rotateY - set the angle for the y rotation.
- _3d.rotateZ - set the angle for the z rotation.
- _3d.rotateCenter - set the the rotation center.
- _3d.sort - sort the 3d elements by the centroid.
- _3d.draw - draw the 3d elements.
Overview
d3-3d uses the browser's coordinate system and orthographic projection to display your data on the screen. It will calculate the centroid for all elements and the orientation for your polygons. Due to the fact that SVG isn't very 3d compatible d3-3d adds 3d transformations to SVG.
With d3-3d you can easily visualize your 3d data.
var data3D = [ [[0,-1,0],[-1,1,0],[1,1,0]] ];

var triangles3D = d3._3d()
    .scale(100)
    .origin([480, 250])
    .shape('TRIANGLE');

var projectedData = triangles3D(data3D);

init(projectedData);

function init(data){

    var triangles = svg.selectAll('path').data(data);

    // add your logic here...

}
Constructs a new function object with the default settings.
Shapes
Depending on the shape the input data array has to be accordingly to the shape.
-
POINT A point is represented by the
<circle>element. It does not have a draw function because it can be represented as a<circle>. The input data array has to be an array of points where each point has three coordinates which can be accessed via the x, y and z accessors. -
LINE A line is represented by the
<line>element. It does not have a draw function because it can be represented as a<line>. The input data array has to be an array of lines where each line is defined by a start- and an endpoint. -
LINE_STRIP A continuous line is represented by the
<path>element. The input data array has to be an array of points. Every point will be connected to the next point in the input data array. -
TRIANGLE A triangle represented by the
<path>element. The input data array has to be an array of triangles where each triangle is defined by three points in counter-clockwise order. -
PLANE A plane is represented by the
<path>element. The input data array has to be an array of planes where each plane is defined by four points in counter-clockwise order. - GRID A grid is represented by x planes. The input data array has to be an array of points. The shape function aspects the amount of points per row as a second argument. d3-3d will construct planes out of the passed data. NOTE: A grid has to have always the same number of points per row. Otherwise the code will break.
-
SURFACE equivalent to
GRID - CUBE A grid is represented by 4 planes. The input data array has to be an array of cubes where each cube is defined by 8 vertices. To get the orientation and centroid calculation right you should pass in the data like so:
Default: 'POINT'
Sets the shape to shape. If shape is not specified the current shape will be returned.
If shape is specified, sets the shape to the specified shape and returns the d3-3d function object. If shape is not specified, returns the current shape.
var triangles3D = d3._3d().shape('TRIANGLE');
If x is specified, sets the x accessor to the specified function or number and returns the d3-3d function object. If x is not specified, returns the current x accessor, which defaults to:
function x(p) {
    return p[0];
}
This function will be invoked for each point in the input data array.
If y is specified, sets the y accessor to the specified function or number and returns the d3-3d function object. If y is not specified, returns the current y accessor, which defaults to:
function y(p) {
    return p[1];
}
This function will be invoked for each point in the input data array.
If z is specified, sets the z accessor to the specified function or number and returns the d3-3d function object. If z is not specified, returns the current z accessor, which defaults to:
function z(p) {
    return p[2];
}
This function will be invoked for each point in the input data array.
Default: 1
If scale is specified, sets the scale to the specified number and returns the d3-3d function object. If scale is not specified, returns the current scale.
Default: 0
If angle is specified, sets rotateX to the specified number and returns the d3-3d function object. If angle is not specified, returns the current angle.
Default: 0
If angle is specified, sets rotateY to the specified number and returns the d3-3d function object. If angle is not specified, returns the current angle.
Default: 0
If angle is specified, sets rotateZ to the specified number and returns the d3-3d function object. If angle is not specified, returns the current angle.
Default: [0, 0, 0]
If point is specified, sets rotateCenter to the specified point and returns the d3-3d function object. If rotateCenter is not specified, returns the current rotateCenter.
Sorts the elements accordingly to the z coordinate of the calculated centroid.
Constructs a string for the SVG <path> element. Depending on the shape this function will take care how the elements get drawn. For instance, if you choose 'TRIANGLE' d3-3d aspects that you want to draw a triangle with three points and each point has three coordinates. The _3d.draw method will draw a triangle with these three points. If you want to draw a plane, you have to pass in four points and so on.


