dbgbench / Dbgbench.github.io
Programming Languages
Labels
Projects that are alternatives of or similar to Dbgbench.github.io
Summary
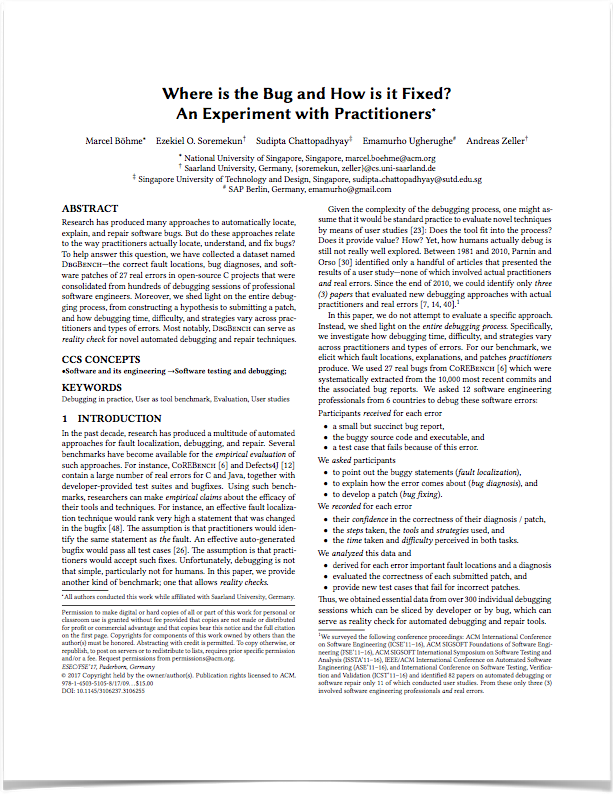
How do professional software engineers debug computer programs? In an experiment with 27 real bugs that existed in several widely used programs, we invited 12 professional software engineers, who together spent one month on localizing, explaining, and fixing these bugs. This did not only allow us to study the various tools and strategies used to debug the same set of errors. We could also determine exactly which statements a developer would localize as faults, how a developer would diagnose and explain an error, and how a developer would fix an error – all of which software engineering researchers seek to automate. Until now, it has been difficult to evaluate the effectiveness and utility of automated debugging techniques without a user study. We publish the collected data, called DBGBENCH, to facilitate the effective evaluation of automated fault localization, diagnosis, and repair techniques w.r.t. the judgement of human experts.
FAQ
Downloads
Data for find
Data for grep
Data on patches
Execute w/ Docker
Use and reproduce
Learn more & Cite us

FAQ
- I am in the ESEC/FSE'17 AEC. How do I navigate this artifact?
- How can I evaluate my automated fault localization technique?
- How can I evaluate my automated bug diagnosis technique?
- How can I evaluate my automated repair technique?
- How do I install the virtual infrastructure?
- How do I use the virtual infrastructure?
- Where do I get more test cases for DBGBench?
- Where do I get more subjects for empirical evaluation of my technique?
- How can I reproduce this study for other subjects or languages?
- How can I contribute? Answer: Create a Pull Request.
- How can I learn more about your research?
- Where does DBGBench come from? Answer: CoREBench.
- How do I cite DBGBench?
DBGBench
In the following we provide the complete list of errors and their average debugging time, difficulty, and patch correctness, with human-generated explanations of the runtime actions leading to the error, and examples of correct and incorrect fixes, sorted according to average debugging time. For each error, we also provide the commit introducing the error, the simplified and original bug report, the fault locations, and the submitted and original patches.
Setup and Infrastructure
-
Download the benchmark summary containing the complete list of errors, their average debugging time, difficulty, and patch correctness, human-generated explanations of the runtime actions leading to the error, and examples of correct and incorrect fixes, sorted according to average debugging time.
-
Download the complete raw data containing for each debugging session (error, participant) the following data:
- Error ID to identify error
- Participant ID to identify participant
- Timestamp to follow participants accross errors
- Fault Locations and Bug diagnosis (Patches here) -- the main artifacts
- Confidence in the correctness of their diagnosis / patch
- Difficulty to diagnose / patch the error
- Time taken to diagnosis / patch the error
- Improvement: What could have helped to reduce the diagnosis / patch time?
- Steps taken to arrive at the diagnosis / patch
- Tools used to arrive at the diagnosis / patch
- Problems if they could not diagnose / patch the error
- Automation: Does he/she believe in automation of diagnosing / patching the error?
- Automation Rationale: Why does the participant believe so?
- Code Familiarity to assess code comprehension of the same code base over time
- Diagnosis Techniques used, such as trace-based, interactive debugging, slicing, ..
- Ensuring Patch Correctness: How did the participant ensure the correctness of the submitted patch?
-
Download the complete cleaned data (i.e., this repository).
-
Download the example questionnaire.
-
Download the Docker virtual infrastructure.
-
Download the tutorial material, including slides, videos, and readme files.
-
Download more test cases for DBGBench.
(Credits: Titcheu Chekam Thierry, Mike Papadakis, Yves Le Traon, and Mark Harman)! -
Read our full paper (@ESEC/FSE'17). Here's how to cite us.
-
Read our extended abstract or poster (@ICSE'17) to find out more about DBGBENCH.
-
Contribute by forking DBGBench and creating a pull request.
GNU Findutils
GNU findutils offers basic file searching utilities to search the systems directories of GNU and Unix-based computers.
| Descriptive Statistics | Benchmark Details |
|---|---|
|
[find.24e2271e] Error Type: Functional Bug Avg. Debugging Time: 13.8 min Explanation: Slightly difficult Patching: Slightly difficult Patch Correctness: 75% |
Regression: Developer Bug Report: Simple, Original Fault Locations: Participants Bug Diagnosis: Participants Patches: Participants Developer Tests: Researcher |
|
[find.dbcb10e9] Error Type: Crash Avg. Debugging Time: 22.9 min Explanation: Slightly difficult Patching: Slightly difficult Patch Correctness: 81% |
Regression: Developer Bug Report: Simple, Original Fault Locations: Participants Bug Diagnosis: Participants Patches: Participants Developer Tests: Researcher |
|
[find.07b941b1] Error Type: Crash Avg. Debugging Time: 23.7 min Explanation: Slightly difficult Patching: Slightly difficult Patch Correctness: 80% |
Regression: Developer Bug Report: Simple, Original Fault Locations: Participants Bug Diagnosis: Participants Patches: Participants Developer Tests: Researcher |
|
[find.c8491c11] Error Type: Crash Avg. Debugging Time: 31.4 min Explanation: Slightly difficult Patching: Slightly difficult Patch Correctness: 54% |
Regression: Developer Bug Report: Simple, Original Fault Locations: Participants Bug Diagnosis: Participants Patches: Participants Developer Tests: Researcher |
|
[find.6e4cecb6] Error Type: Functional Bug Avg. Debugging Time: 38.2 min Explanation: Moderately difficult Patching: Not at all difficult Patch Correctness: 89% |
Regression: Developer Bug Report: Simple, Original Fault Locations: Participants Bug Diagnosis: Participants Patches: Participants Developer Tests: Researcher |
|
[find.091557f6] Error Type: Crash Avg. Debugging Time: 44.8 min Explanation: Slightly difficult Patching: Slightly difficult Patch Correctness: 54% |
Regression: Developer Bug Report: Simple, Original Fault Locations: Participants Bug Diagnosis: Participants Patches: Participants Developer Tests: Researcher |
|
[find.24bf33c0] Error Type: Crash Avg. Debugging Time: 45.1 min Explanation: Moderately difficult Patching: Slightly difficult Patch Correctness: 50% |
Regression: Developer Bug Report: Simple, Original Fault Locations: Participants Bug Diagnosis: Participants Patches: Participants Developer Tests: Researcher |
|
[find.183115d0] Error Type: Resource Leak Avg. Debugging Time: 49.2 min Explanation: Slightly difficult Patching: Slightly difficult Patch Correctness: 83% |
Regression: Developer Bug Report: Simple, Original Fault Locations: Participants Bug Diagnosis: Participants Patches: Participants Developer Tests: Researcher |
|
[find.93623752] Error Type: Functional Bug Avg. Debugging Time: 50.8 min Explanation: Moderately difficult Patching: Slightly difficult Patch Correctness: 92% |
Regression: Developer Bug Report: Simple, Original Fault Locations: Participants Bug Diagnosis: Participants Patches: Participants Developer Tests: Researcher |
|
[find.66c536bb] Error Type: Functional Bug Avg. Debugging Time: 55.5 min Explanation: Moderately difficult Patching: Slightly difficult Patch Correctness: 92% |
Regression: Developer Bug Report: Simple, Original Fault Locations: Participants Bug Diagnosis: Participants Patches: Participants Developer Tests: Researcher |
|
[find.b445af98] Error Type: Functional Bug Avg. Debugging Time: 56.5 min Explanation: Moderately difficult Patching: Slightly difficult Patch Correctness: 50% |
Regression: Developer Bug Report: Simple, Original Fault Locations: Participants Bug Diagnosis: Participants Patches: Participants Developer Tests: Researcher |
|
[find.ff248a20] Error Type: Infinite Loop Avg. Debugging Time: 57.7 min Explanation: Moderately difficult Patching: Moderately difficult Patch Correctness: 40% |
Regression: Developer Bug Report: Simple, Original Fault Locations: Participants Bug Diagnosis: Participants Patches: Participants Developer Tests: Researcher |
|
[find.e6680237] Error Type: Functional Bug Avg. Debugging Time: 76.4 min Explanation: Moderately difficult Patching: Moderately difficult Patch Correctness: 27% |
Regression: Developer Bug Report: Simple, Original Fault Locations: Participants Bug Diagnosis: Participants Patches: Participants Developer Tests: Researcher |
|
[find.e1d0a991] Error Type: Functional Bug Avg. Debugging Time: 88.2 min Explanation: Very difficult Patching: Very difficult Patch Correctness: 17% |
Regression: Developer Bug Report: Simple, Original Fault Locations: Participants Bug Diagnosis: Participants Patches: Participants Developer Tests: Researcher |
GNU Grep
GNU grep is a command-line utility for searching plain-text data sets for lines that match a regular expression.
| Descriptive Statistics | Benchmark Details |
|---|---|
|
[grep.55cf7b6a] Error Type: Functional Bug Avg. Debugging Time: 21.1 min Explanation: Slightly difficult Patching: Not at all difficult Patch Correctness: 91% |
Regression: Developer Bug Report: Simple, Original Fault Locations: Participants Bug Diagnosis: Participants Patches: Participants Developer Tests: Researcher |
|
[grep.54d55bba] Error Type: Crash Avg. Debugging Time: 26.7 min Explanation: Slightly difficult Patching: Slightly difficult Patch Correctness: 69% |
Regression: Developer Bug Report: Simple, Original Fault Locations: Participants Bug Diagnosis: Participants Patches: Participants Developer Tests: Researcher |
|
[grep.9c45c193] Error Type: Functional Bug Avg. Debugging Time: 37.7 min Explanation: Moderately difficult Patching: Slightly difficult Patch Correctness: 83% |
Regression: Developer Bug Report: Simple, Original Fault Locations: Participants Bug Diagnosis: Participants Patches: Participants Developer Tests: Researcher |
|
[grep.5fa8c7c9] Error Type: Infinite Loop Avg. Debugging Time: 38.8 min Explanation: Moderately difficult Patching: Slightly difficult Patch Correctness: 50% |
Regression: Developer Bug Report: Simple, Original Fault Locations: Participants Bug Diagnosis: Participants Patches: Participants Developer Tests: Researcher |
|
[grep.db9d6340] Error Type: Infinite Loop Avg. Debugging Time: 40.6 min Explanation: Slightly difficult Patching: Slightly difficult Patch Correctness: 45% |
Regression: Developer Bug Report: Simple, Original Fault Locations: Participants Bug Diagnosis: Participants Patches: Participants Developer Tests: Researcher |
|
[grep.2be0c659] Error Type: Functional Bug Avg. Debugging Time: 47.2 min Explanation: Moderately difficult Patching: Moderately difficult Patch Correctness: 13% |
Regression: Developer Bug Report: Simple, Original Fault Locations: Participants Bug Diagnosis: Participants Patches: Participants Developer Tests: Researcher |
|
[grep.8f08d8e2] Error Type: Functional Bug Avg. Debugging Time: 48.4 min Explanation: Moderately difficult Patching: Moderately difficult Patch Correctness: 75% |
Regression: Developer Bug Report: Simple, Original Fault Locations: Participants Bug Diagnosis: Participants Patches: Participants Developer Tests: Researcher |
|
[grep.58195fab] Error Type: Functional Bug Avg. Debugging Time: 50.5 min Explanation: Moderately difficult Patching: Slightly difficult Patch Correctness: 82% |
Regression: Developer Bug Report: Simple, Original Fault Locations: Participants Bug Diagnosis: Participants Patches: Participants Developer Tests: Researcher |
|
[grep.c1cb19fe] Error Type: Functional Bug Avg. Debugging Time: 58.4 min Explanation: Very difficult Patching: Slightly difficult Patch Correctness: 71% |
Regression: Developer Bug Report: Simple, Original Fault Locations: Participants Bug Diagnosis: Participants Patches: Participants Developer Tests: Researcher |
|
[grep.7aa698d3] Error Type: Functional Bug Avg. Debugging Time: 59.9 min Explanation: Moderately difficult Patching: Moderately difficult Patch Correctness: 13% |
Regression: Developer Bug Report: Simple, Original Fault Locations: Participants Bug Diagnosis: Participants Patches: Participants Developer Tests: Researcher |
|
[grep.3220317a] Error Type: Crash Avg. Debugging Time: 63.7 min Explanation: Moderately difficult Patching: Moderately difficult Patch Correctness: 20% |
Regression: Developer Bug Report: Simple, Original Fault Locations: Participants Bug Diagnosis: Participants Patches: Participants Developer Tests: Researcher |
|
[grep.3c3bdace] Error Type: Crash Avg. Debugging Time: 64.8 min Explanation: Very difficult Patching: Moderately difficult Patch Correctness: 70% |
Regression: Developer Bug Report: Simple, Original Fault Locations: Participants Bug Diagnosis: Participants Patches: Participants Developer Tests: Researcher |
|
[grep.c96b0f2c] Error Type: Functional Bug Avg. Debugging Time: 67.6 min Explanation: Very difficult Patching: Moderately difficult Patch Correctness: 50% |
Regression: Developer Bug Report: Simple, Original Fault Locations: Participants Bug Diagnosis: Participants Patches: Participants Developer Tests: Researcher |
How to Cite?
@inproceedings{dbgbench,
  author = {B\"{o}hme, Marcel and Soremekun, Ezekiel Olamide and Chattopadhyay, Sudipta and Ugherughe, Emamurho and Zeller, Andreas},
  title = {Where is the Bug and How is it Fixed? An Experiment with Practitioners},
  booktitle = {Proceedings of the 11th Joint meeting of the European Software Engineering Conference and the ACM SIGSOFT Symposium on the Foundations of Software Engineering},
  series = {ESEC/FSE 2017},
  pages = {1-11},
  year = {2017},
}
DBGBench is based on CoREBench, a collection of 70 real regression errors in four open source projects (coreutils, findutils, grep, and make). Since DBGBench reuses and extends many results from CoREBench (e.g., infrastructure, developer bug reports, and developer patches), we recommend that both references be cited.
@inproceedings{corebench,
 author = {B\"{o}hme, Marcel and Roychoudhury, Abhik},
 title = {CoREBench: Studying Complexity of Regression Errors},
 booktitle = {Proceedings of the 23rd ACM/SIGSOFT International Symposium on Software Testing and Analysis},
 series = {ISSTA 2014},
 pages = {105-115},
 year = {2014},
}
Who are we?
This work was initiated at the end of 2014 over lunch when we argued about reasons for the prevailing chasm between research and practice in automated debugging, and the surprising lack of user studies in software engineering at large. Of course then, we set out to get our own hands dirty. Rather than evaluating a specific debugging technique, we wanted to investigate the manual debugging process, and more importantly provide a benchmark that can serve as reality check for any novel debugging technique. It took our team more than two years of carefully planning, preparing, recruiting, and evaluating until we could finally publish the DBGBench paper. Each of the team members was for a large part of the study affiliated with Saarland University, Germany.
- Marcel Böhme, National University of Singapore, Singapore
- Ezekiel Olamide Soremekun, Saarland University, Germany
- Sudipta Chattopadhyay, Singapore University of Technology and Design, Singapore
- Emamurho Ugherughe, SAP Berlin, Germany
- Andreas Zeller, Saarland University, Germany
- Read our full paper (@ESEC/FSE'17) to find out more about DBGBENCH.
- Read our extended abstract or poster (@ICSE'17) to find out more about DBGBENCH.