Log transport and aggregation at scale for Docker containers
The logging stack:
- ElasticSearch Cluster (x3 data nodes)
- ElasticSearch Ingester (used by Logstash indexer)
- ElasticSearch Coordinator (used by Kibana)
- Logstash Indexer
- Redis Broker (used by Logstash shipper and indexer)
- Logstash Shipper (used by Docker engine)
- Kibana
- Docker GELF driver
Clone the repo and run the full stack along with a NGINX container for testing.
$ git clone https://github.com/stefanprodan/dockelk.git
$ cd dockelk
$ bash setup.sh
# wait for Kibana to connect to the cluster
$ docker-compose logs -f kibana
# generate NGINX logs
curl http://localhost
curl http://localhost/404
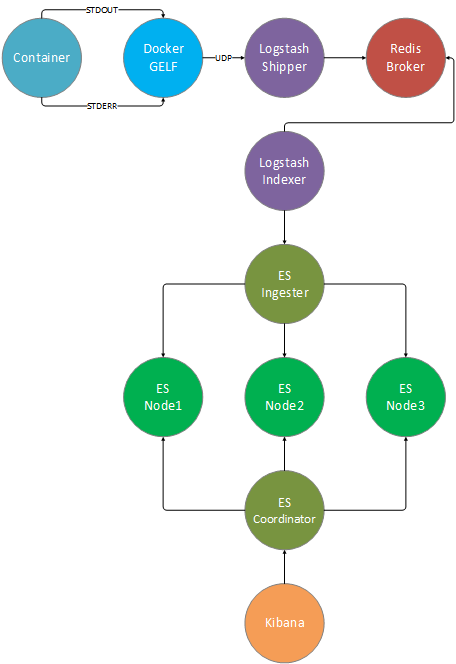
# open Kibana in browser at http://localhost:5601Log transport diagram
Flow: container -> docker gelf -> logstash shipper -> redis broker -> logstash indexer -> elasticsearch ingester -> elasticsearch data cluster -> elasticsearch coordinator -> kibana
Network setup
I've create a dedicated Docker network so each container can have a fix IP.
docker network create --subnet=192.16.0.0/24 elk
In production you should use an internal DNS server and use domain names instead of fix IP addresses. Each service should reside on a dedicated host.
The containers can be started with --net=host to bind directly to the host network to avoiding Docker bridge overhead.
Elasticseach Nodes
All Elasticseach nodes are using the same Docker image that contains the HQ and KOPF management plugins along with a health check command.
Dockerfile
FROM elasticsearch:2.4.3

RUN /usr/share/elasticsearch/bin/plugin install --batch royrusso/elasticsearch-HQ
RUN /usr/share/elasticsearch/bin/plugin install --batch lmenezes/elasticsearch-kopf

COPY docker-healthcheck /usr/local/bin/
RUN chmod +x /usr/local/bin/docker-healthcheck

HEALTHCHECK CMD ["docker-healthcheck"]

COPY config /usr/share/elasticsearch/config
Elasticseach data nodes
The Elasticseach data cluster is made out of 3 nodes. In production you should use a dedicated machine for each node and disable memory swapping.
  elasticsearch-node1:
    build: elasticsearch/
    container_name: elasticsearch-node1
    environment:
      ES_JAVA_OPTS: "-Xmx2g"
      ES_HEAP_SIZE: "1g"
    command: >
        elasticsearch
        --node.name="node1"
        --cluster.name="elk"
        --network.host=0.0.0.0
        --discovery.zen.ping.multicast.enabled=false
        --discovery.zen.ping.unicast.hosts="192.16.0.11,192.16.0.12,192.16.0.13"
        --node.data=true
        --bootstrap.mlockall=true
    ports:
      - "9201:9200"
      - "9301:9300"
    networks:
      default:
        ipv4_address: 192.16.0.11
    restart: unless-stopped

  elasticsearch-node2:
    build: elasticsearch/
    container_name: elasticsearch-node2
    environment:
      ES_JAVA_OPTS: "-Xmx2g"
      ES_HEAP_SIZE: "1g"
    command: >
        elasticsearch
        --node.name="node2"
        --cluster.name="elk"
        --network.host=0.0.0.0
        --discovery.zen.ping.multicast.enabled=false
        --discovery.zen.ping.unicast.hosts="192.16.0.11,192.16.0.12,192.16.0.13"
        --node.data=true
        --bootstrap.mlockall=true
    ports:
      - "9202:9200"
      - "9302:9300"
    networks:
      default:
        ipv4_address: 192.16.0.12
    restart: unless-stopped

  elasticsearch-node3:
    build: elasticsearch/
    container_name: elasticsearch-node3
    environment:
      ES_JAVA_OPTS: "-Xmx2g"
      ES_HEAP_SIZE: "1g"
    command: >
        elasticsearch
        --node.name="node3"
        --cluster.name="elk"
        --network.host=0.0.0.0
        --discovery.zen.ping.multicast.enabled=false
        --discovery.zen.ping.unicast.hosts="192.16.0.11,192.16.0.12,192.16.0.13"
        --node.data=true
        --bootstrap.mlockall=true
    ports:
      - "9203:9200"
      - "9303:9300"
    networks:
      default:
        ipv4_address: 192.16.0.13
    restart: unless-stopped
Elasticseach ingest node
The ingest node acts as a reverse proxy between Logstash Indexer and the Elasticsearch data cluster, when you scale out the data cluster by adding more nodes you don't have to change the Logstash config.
  elasticsearch-ingester:
    build: elasticsearch/
    container_name: elasticsearch-ingester
    command: >
        elasticsearch
        --node.name="ingester"
        --cluster.name="elk"
        --network.host=0.0.0.0
        --discovery.zen.ping.multicast.enabled=false
        --discovery.zen.ping.unicast.hosts="192.16.0.11,192.16.0.12,192.16.0.13"
        --node.master=false
        --node.data=false
        --node.ingest=true
        --bootstrap.mlockall=true
    ports:
      - "9221:9200"
      - "9321:9300"
    networks:
      default:
        ipv4_address: 192.16.0.21
    restart: unless-stopped
Elasticseach coordinator node
The coordinator node acts as a router between Kibana and the Elasticsearch data cluster, his main role is to handle the search reduce phase.
  elasticsearch-coordinator:
    build: elasticsearch/
    container_name: elasticsearch-coordinator
    command: >
        elasticsearch
        --node.name="coordinator"
        --cluster.name="elk"
        --network.host=0.0.0.0
        --discovery.zen.ping.multicast.enabled=false
        --discovery.zen.ping.unicast.hosts="192.16.0.11,192.16.0.12,192.16.0.13"
        --node.master=false
        --node.data=false
        --node.ingest=false
        --bootstrap.mlockall=true
    ports:
      - "9222:9200"
      - "9322:9300"
    networks:
      default:
        ipv4_address: 192.16.0.22
Kibana
The Kibana Docker image contains the yml config file where the Elasticseach coordinator node URL is specified and a startup script that waits for the Elasticseach cluster to be available.
kibana.yml
elasticsearch.url: "http://192.16.0.22:9200"
entrypoint.sh
echo "Stalling for Elasticsearch"
while true; do
    nc -q 1 192.16.0.22 9200 2>/dev/null && break
done

echo "Starting Kibana"
exec kibana
Dockerfile
FROM kibana:4.6.2

RUN apt-get update && apt-get install -y netcat bzip2

COPY config /opt/kibana/config

COPY entrypoint.sh /tmp/entrypoint.sh
RUN chmod +x /tmp/entrypoint.sh

CMD ["/tmp/entrypoint.sh"]
Service definition
  kibana:
    build: kibana/
    container_name: kibana
    ports:
      - "5601:5601"
    restart: unless-stopped
Redis Broker
The Redis Broker acts as a buffer between the Logstash shippers nodes and the Logstash indexer.
The more memory you give to this node the longer you can take offline the Logstash indexer and the Elasticseach cluster for upgrade/maintenance work.
Shutdown the Logstash indexer and monitor Redis memory usage to determine how log does it take for the memory to fill up. Once the memory fills up Redis will OOM and restart.
You can use Redis CLI and run LLEN logstash to determine how many logs your current setup holds.
I've disabled Redis disk persistance to max out the insert speed:
redis.conf
#save 900 1
#save 300 10
#save 60 10000

appendonly no
Dockerfile
FROM redis:3.2.6

COPY config /usr/local/etc/redis
Service definition
  redis-broker:
    build: redis-broker/
    container_name: redis-broker
    ports:
      - "6379:6379"
    networks:
      default:
        ipv4_address: 192.16.0.79
    restart: unless-stopped
Logstash Indexer
The Logstash Indexer node pulls the logs from the Redis broker and pushes them into the Elasticseach cluster via the Elasticseach Ingester node.
logstash.config
input {
  redis {
    host => "192.16.0.79"
	port => 6379
    key => "logstash"
    data_type => "list"
    codec => json
  }
}

output {
	elasticsearch {
		hosts => "192.16.0.21:9200"
	}
}
Dockerfile
FROM logstash:2.4.0-1

COPY config /etc/logstash/conf.d
Service definition
  logstash-indexer:
    build: logstash-indexer/
    container_name: logstash-indexer
    command: -f /etc/logstash/conf.d/
    restart: unless-stopped
Logstash Shipper
The Logstash Shipper node listens on UDP and receives the containers logs from Docker engine via the GELF driver. The incoming logs are proccesed using Logstash filers and pushed to the Redis Broker node. You should deploy a Shipper node on each Docker host you want to collect logs from. In production you can expose the UDP port on the host and configure Docker engine GELF driver to use it.
logstash.config
input {
  gelf {
    type => docker
    port => 12201
  }
}

# filters ...

output {
  redis {
    host => "192.16.0.79"
    port => 6379
    data_type => "list"
    key => "logstash"
    codec => json
  }
}
Dockerfile
FROM logstash:2.4.0-1

COPY config /etc/logstash/conf.d
Service definition
  logstash-shipper:
    build: logstash-shipper/
    container_name: logstash-shipper
    command: -f /etc/logstash/conf.d/
    ports:
      - "12201:12201"
      - "12201:12201/udp"
    networks:
      default:
        ipv4_address: 192.16.0.30
    restart: unless-stopped
Collect NGINX logs
I'm going to use a NGINX container to showcase the logs collection. First you need to forward the NGINX logs to STDOUT and STDERR for Docker GELF to capture them.
Dockerfile
FROM nginx:latest

# forward nginx logs to docker log collector
RUN ln -sf /dev/stdout /var/log/nginx/access.log
RUN ln -sf /dev/stderr /var/log/nginx/error.log
Next you need to run NGINX container with the Docker GELF log driver like so:
  nginx:
    build: nginx/
    container_name: nginx
    ports:
      - "80:80"
      - "443:443"
    restart: unless-stopped
    logging:
      driver: gelf
      options:
        gelf-address: "udp://192.16.0.30:12201"
        tag: "nginx"
In production you will probably don't want to specify the GELF address option for each service. If you expose the Logstash Shipper UDP port on the host you can set the address at the Docker engine level, so all your containers will use GELF as the default logging driver.
Docker Engine GELF config
$ dockerd \
         --log-driver=gelf \
         --log-opt gelf-address=udp://localhost:12201
You can use the GELF tag option to write custom Logstash filers for each service type. Here is an example of how you can target the NGINX logs inside the Logstash Shipper config:
filter {
  if [tag] == "nginx" {
    # nginx access log
    if [level] == 6 {
      grok {
        match => [ "message" , "%{COMBINEDAPACHELOG}+%{GREEDYDATA:extra_fields}"]
        overwrite => [ "message" ]
      }

      date {
        match => [ "timestamp" , "dd/MMM/YYYY:HH:mm:ss Z" ]
        remove_field => [ "timestamp" ]
      }

      useragent {
        source => "agent"
      }

      mutate {
        convert => { "response" =>"integer" }
        convert => { "bytes" =>"integer" }
        convert => { "responsetime" =>"float" }
        rename => { "name" => "browser_name" }
        rename => { "major" => "browser_major" }
        rename => { "minor" => "browser_minor" }
      }
    }
    # nginx error log
    if [level] == 3 {
      grok {
        match => [ "message" , "(?<timestamp>%{YEAR}[./-]%{MONTHNUM}[./-]%{MONTHDAY}[- ]%{TIME}) \[%{LOGLEVEL:severity}\] %{POSINT:pid}#%{NUMBER}: %{GREEDYDATA:errormessage}(?:, client: (?<client>%{IP}|%{HOSTNAME}))(?:, server: %{IPORHOST:server})(?:, request: %{QS:request})?(?:, upstream: \"%{URI:upstream}\")?(?:, host: %{QS:host})?(?:, referrer: \"%{URI:referrer}\")"]
        overwrite => [ "message" ]
      }

      date {
        match => [ "timestamp" , "YYYY/MM/dd HH:mm:ss" ]
        remove_field => [ "timestamp" ]
      }
    }
  }
}
Note that GELF will set the level field to 6 when the input comes from STDOUT and 3 when it's STDERR so you can write different filers based on that.
Using the above filter will result in the following Kibana view:
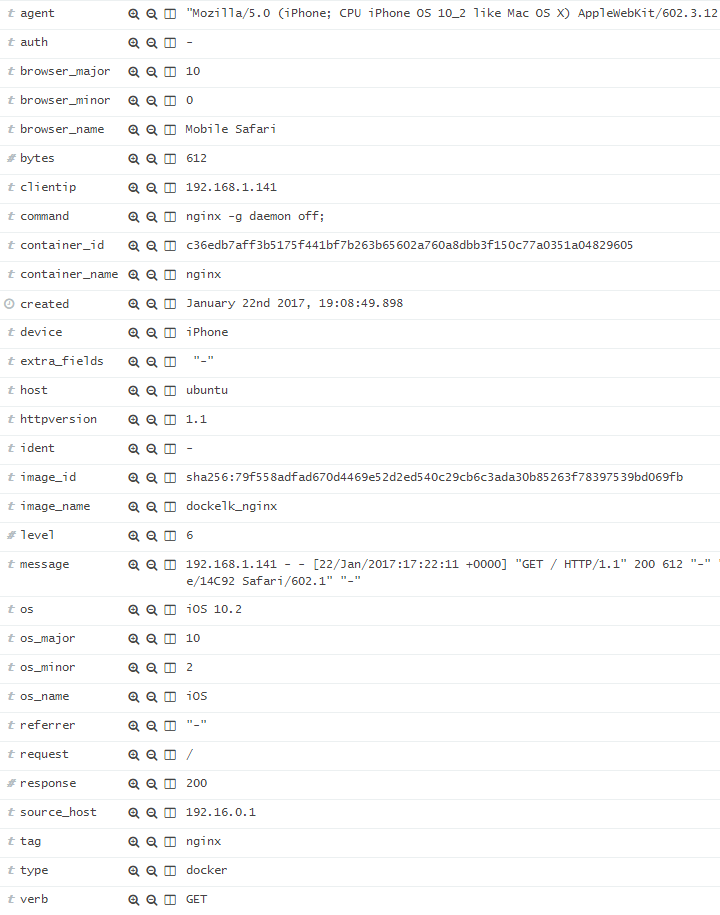
The Logstash Grok filter parses the NGINX access log and extracts the http version, http verb, request path, referrer, response http code, bytes, client IP, device, browser and OS details. With these fields you can turn Kibana into a versatile traffic analytics tool.
The GELF driver adds the image name/id, container name/id and the Docker command used to start the container. These fields could prove useful if you'll want to measure the impact of a new deployment based on logs trending.