speedtest-influxdb:1.1.0
Introduction
Git-Repository to build Docker Container Image to run speedtest with NDT7 Server from mLabs to influxdb. The Implementation is inspired by https://github.com/frdmn/docker-speedtest
Contributing
If you find this image helpfull, so you can see here how you can help:
- Create an new branch and send a pull request with your features and bug fixes
- Help users resolve their issues.
Issues
Before reporting your issue please try updating Docker to the latest version and check if it resolves the issue. Refer to the Docker installation guide for instructions.
If that recommendations do not help then report your issue along with the following information:
- Output of the
docker versionanddocker infocommands - The
docker runcommand ordocker-compose.ymlused to start the image. Mask out the sensitive bits.
Getting started
Installation
Automated builds of the image are available on Dockerhub
docker pull quadstingray/speedtest-influxdb
Alternatively you can build the image yourself.
docker build . --tag 'quadstingray/speedtest-influxdb:dev';Quickstart
docker run -e "HOST=local" quadstingray/speedtest-influxdb:1.1.0Alternatively, you can use the sample docker-compose.yml file to start the container using Docker Compose
Environment Variables
| Variable | Default Value | Informations |
|---|---|---|
| INTERVAL | 3600 | Seconds between import of statistics |
| RETRY_INTERVAL | 300 | Seconds between retry of statistics import |
| HOST | local | host where the speedtest is running for grafana filter |
| SPEEDTEST_SERVER | '' | ndt 7 server. Empty string, means speedtest return server for test |
| INCLUDE_READABLE_OUTPUT | false | Log Speedtest Output to Console |
| RETRY_ZERO_VALUE | false | Retry Speedtest at Zero Values returned |
| SPEEDTEST_DISTANCE_UNIT | K | Unit for Distance Calculation K = Kilometers, N = Nautical Miles other Values = Miles |
| SPEEDTEST_LIST_SERVERS | 'false' | list all available ndt7 servers at the console |
| SPEEDTEST_LIST_KEEP_CONTAINER_RUNNING | 'true' | keep docker container running after listing all ndt7 servers |
| SHOW_EXTERNAL_IP | 'false' | You can activate logging your external Ip to InfluxDb to monitor IP changes. |
| INFLUXDB_USE | 'true' | You can deactivate save speedtest results to influx |
| INFLUXDB_URL | http://influxdb:8086 | Url of your InfluxDb installation |
| INFLUXDB_DB | speedtest | Database at your InfluxDb installation |
| INFLUXDB_USER | DEFAULT | optional user for insert to your InfluxDb |
| INFLUXDB_PWD | DEFAULT | optional password for insert to your InfluxDb |
Removed Variables
- SPEEDTEST_ALGO_TYPE
Environment Variable: SPEEDTEST_SERVER
Per default the server is choosen automatically, but you can set SPEEDTEST_SERVER with the id of your favorite server. If your favorite Server doesn't answer a default search server
is choosen. You can get a list of all available servers by set the evironment variable SPEEDTEST_LIST_SERVERS to true. The list is ordered by country.
...
2021/02/02 09:16:09 County: AU | Location: Sydney | ServerId: syd03 | UplinkSpeed: 10g | Roundrobin: true
2021/02/02 09:16:09 County: AU | Location: Sydney | ServerId: syd02 | UplinkSpeed: 10g | Roundrobin: true
2021/02/02 09:16:09 County: BE | Location: Brussels | ServerId: bru01 | UplinkSpeed: 10g | Roundrobin: true
2021/02/02 09:16:09 County: BE | Location: Brussels | ServerId: bru03 | UplinkSpeed: 10g | Roundrobin: true
2021/02/02 09:16:09 County: BE | Location: Brussels | ServerId: bru05 | UplinkSpeed: 10g | Roundrobin: true
2021/02/02 09:16:09 County: BE | Location: Brussels | ServerId: bru04 | UplinkSpeed: 10g | Roundrobin: true
2021/02/02 09:16:09 County: BE | Location: Brussels | ServerId: bru02 | UplinkSpeed: 10g | Roundrobin: true

...
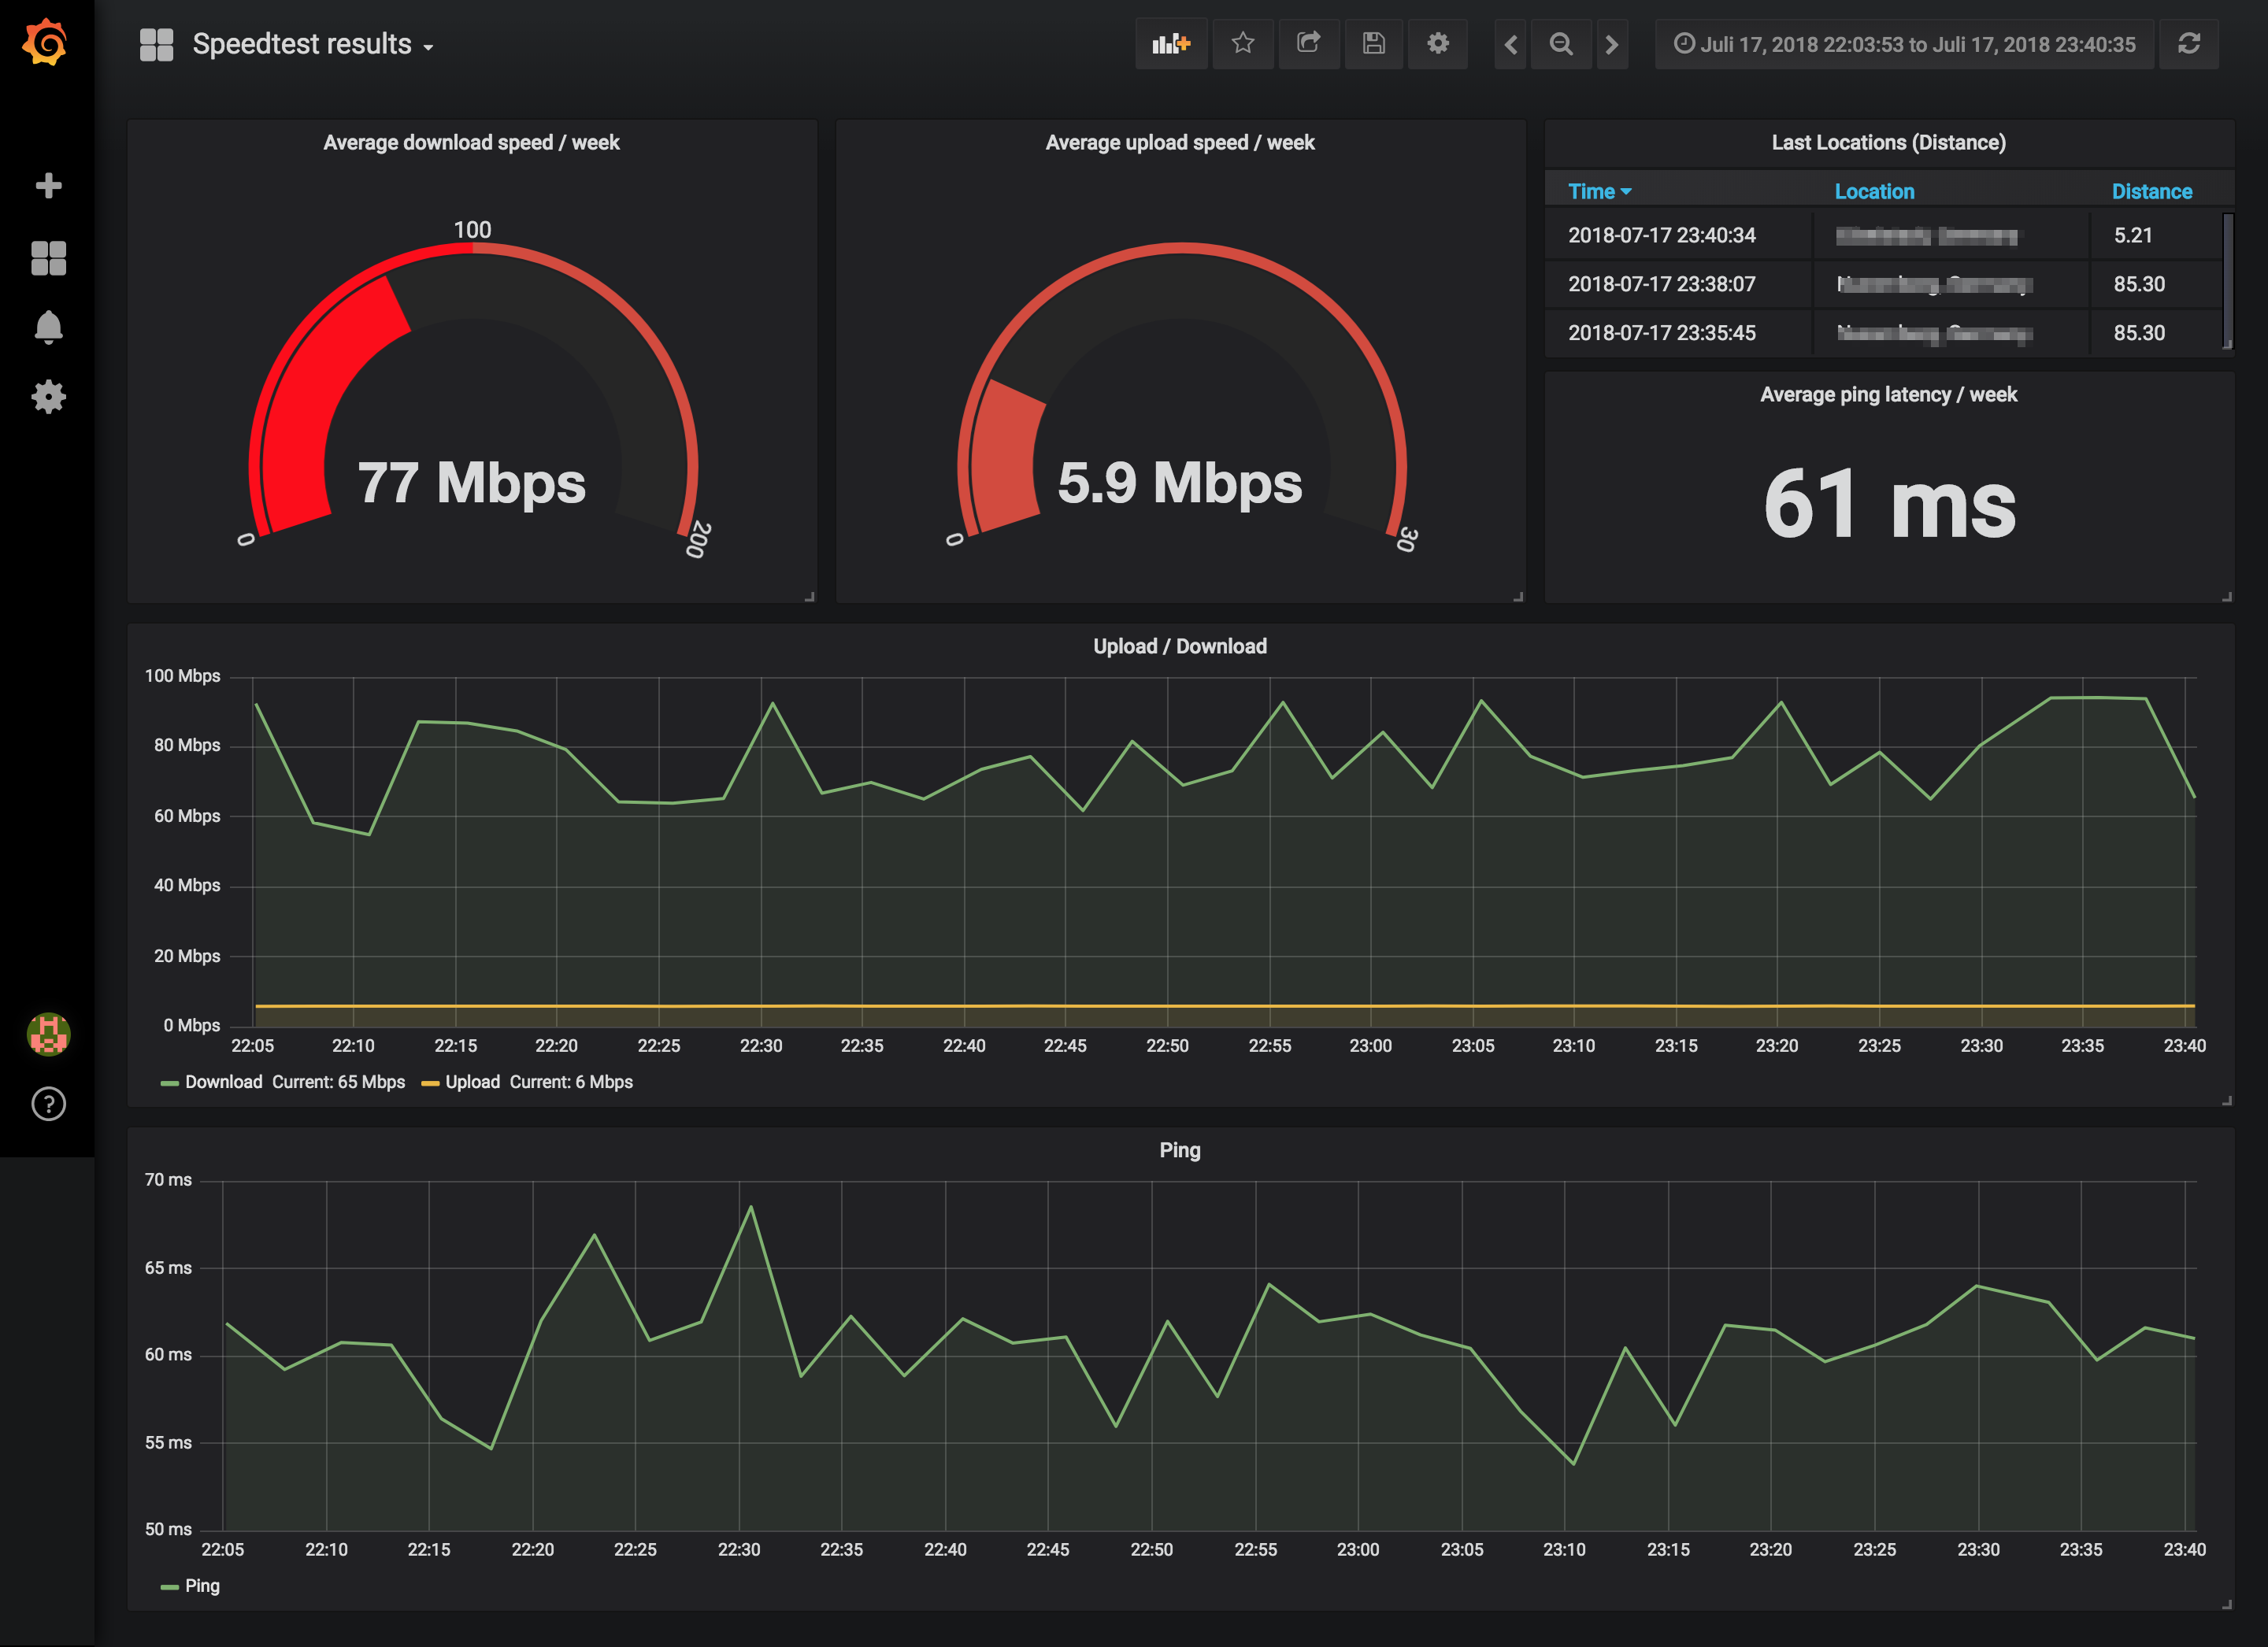
Grafana
There is an sample grafana dashboard at this repository. You can import that to your Grafana installation. speedtest.json
Todo:
- Code Clean Up