dynverse / Dyno
Licence: other
Inferring, interpreting and visualising trajectories using a streamlined set of packages 🦕
Stars: ✭ 93
Programming Languages
r
7636 projects
Labels
Projects that are alternatives of or similar to Dyno
Js Code To Svg Flowchart
js2flowchart - a visualization library to convert any JavaScript code into beautiful SVG flowchart. Learn other’s code. Design your code. Refactor code. Document code. Explain code.
Stars: ✭ 6,290 (+6663.44%)
Mutual labels: visualisation
Pydata Pandas Workshop
Material for my PyData Jupyter & Pandas Workshops, I'm also available for personal in-house trainings on request
Stars: ✭ 65 (-30.11%)
Mutual labels: visualisation
Simd Visualiser
A tool to graphically visualize SIMD code
Stars: ✭ 459 (+393.55%)
Mutual labels: visualisation
Scala Plotly Client
Visualise your data from Scala using Plotly
Stars: ✭ 39 (-58.06%)
Mutual labels: visualisation
Iris
A powerful, format-agnostic, and community-driven Python package for analysing and visualising Earth science data
Stars: ✭ 418 (+349.46%)
Mutual labels: visualisation
Influxgraph
Graphite InfluxDB backend. InfluxDB storage finder / plugin for Graphite API.
Stars: ✭ 87 (-6.45%)
Mutual labels: visualisation
Arkit
JavaScript architecture diagrams and dependency graphs
Stars: ✭ 671 (+621.51%)
Mutual labels: visualisation
Ff meters
Plug and play component to display LED meters for JUCE audio buffers
Stars: ✭ 60 (-35.48%)
Mutual labels: visualisation
React Graph Vis
A react component to render nice graphs using vis.js
Stars: ✭ 629 (+576.34%)
Mutual labels: visualisation
Graphia
A visualisation tool for the creation and analysis of graphs
Stars: ✭ 67 (-27.96%)
Mutual labels: visualisation
Biojs
🔬A library of JavaScript components to represent biological data
Stars: ✭ 438 (+370.97%)
Mutual labels: visualisation
Cytoscape.js
Graph theory (network) library for visualisation and analysis
Stars: ✭ 8,107 (+8617.2%)
Mutual labels: visualisation
Itunes Graphs
A macOS app to visualise your iTunes library as graphs.
Stars: ✭ 42 (-54.84%)
Mutual labels: visualisation
ℹ️ Tutorials ℹ️ Reference
documentation

Inferring trajectories using dyno
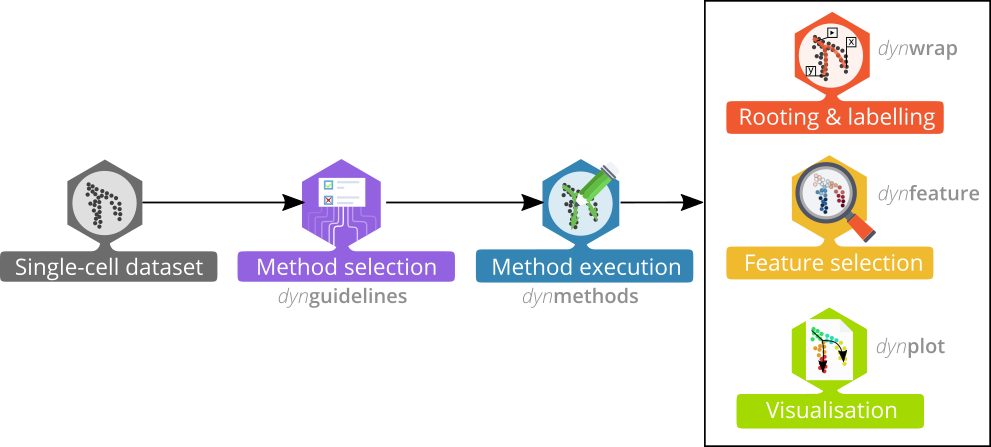
The dyno package offers end-users a complete TI pipeline. It features:
- a uniform interface to 60 TI methods,
- an interactive guideline tool to help the user select the most appropriate method,
- streamlined interpretation and visualisation of trajectories, including colouring by gene expression or clusters, and
- downstream analyses such as the identification of potential marker genes.
For information on how to use dyno, check out the installation instructions, tutorials and documentation at dynverse.org
Latest changes
Check out news(package = "dyno") or NEWS.md for a full list
of changes.
Recent changes in dyno 0.1.1 (06-04-2019)
-
BUGFIX: Fixed example dataset
-
MINOR CHANGE: Bumping version requirement of dynmethods to 1.0.1.
Recent changes in dyno 0.1.0 (29-03-2019)
- Initial beta release of dyno
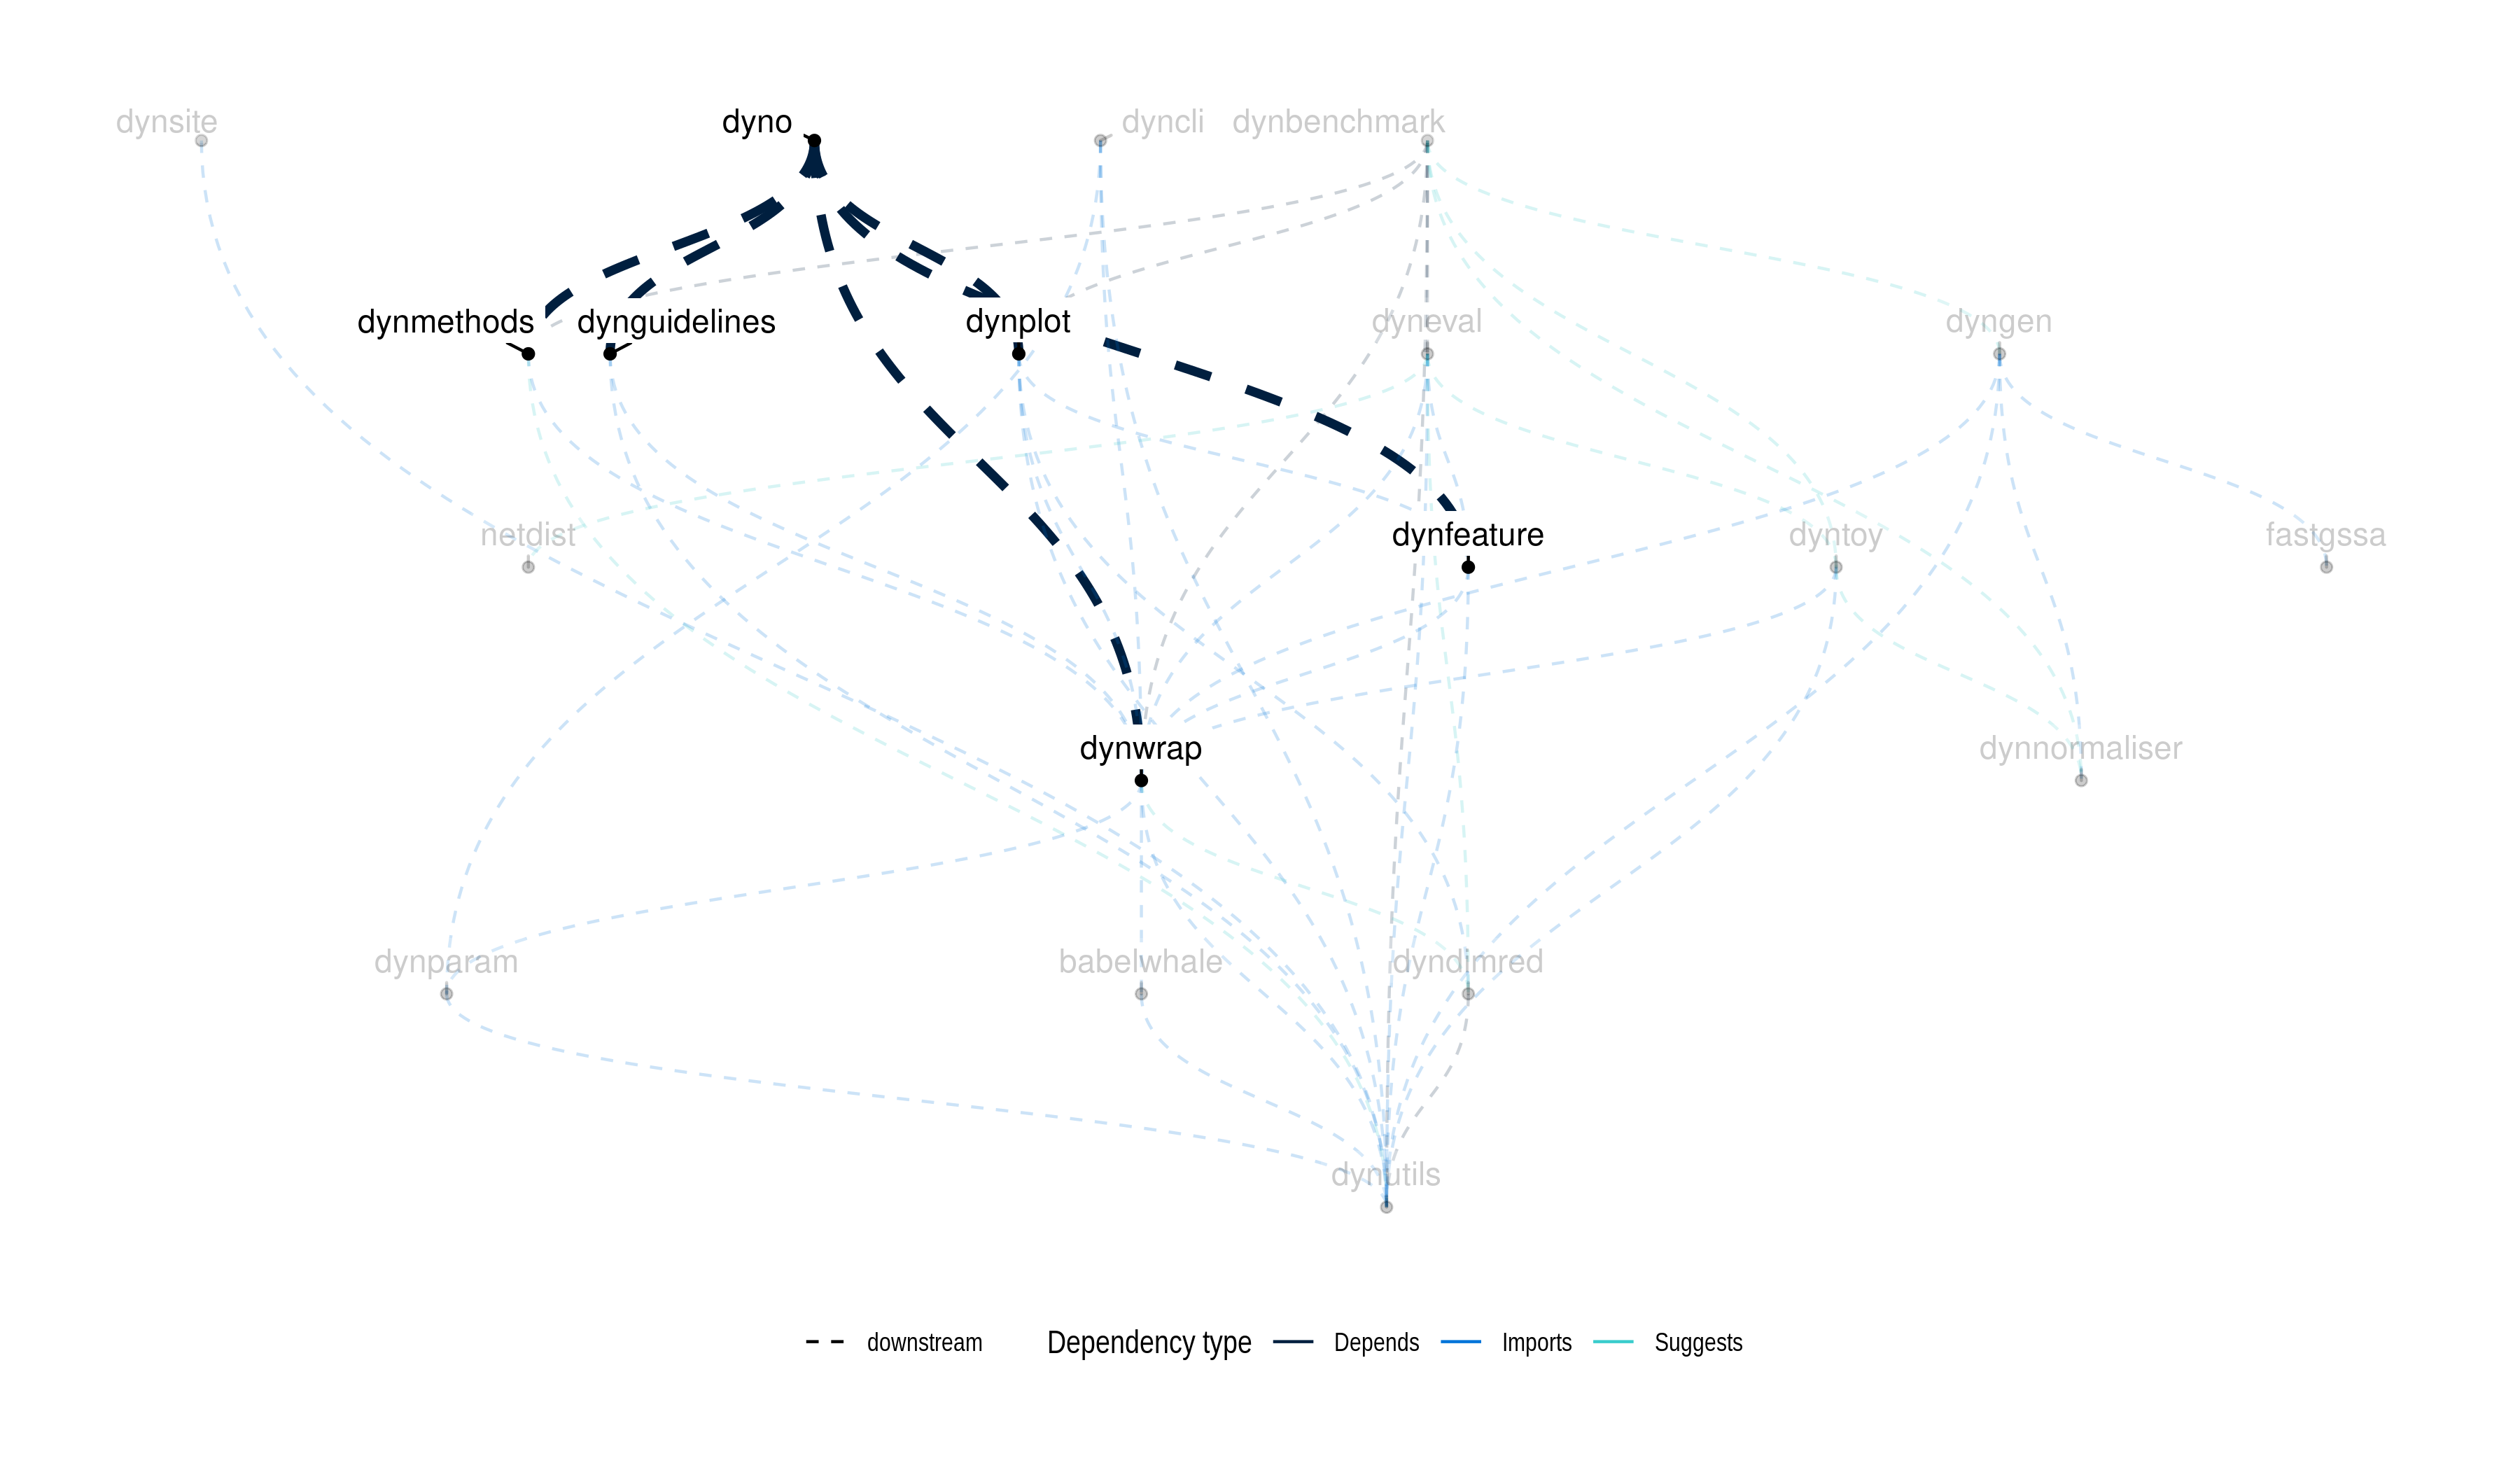
Dynverse dependencies
Note that the project description data, including the texts, logos, images, and/or trademarks,
for each open source project belongs to its rightful owner.
If you wish to add or remove any projects, please contact us at [email protected].


