easy_profiler 


About
Lightweight cross-platform profiler library for c++
You can profile any function in you code. Furthermore this library provide measuring time of any block of code. For example, information for 12 millions of blocks is using less than 300Mb of memory. Working profiler slows your application execution for only 1-2%.

Disabled profiler will not affect your application execution in any way. You can leave it in your Release build and enable it at run-time at any moment during application launch to see what is happening at the moment.
Also the library can capture system's context switch events between threads. Context switch information includes duration, target thread id, thread owner process id, thread owner process name.
You can see the results of measuring in simple GUI application which provides full statistics and renders beautiful time-line.
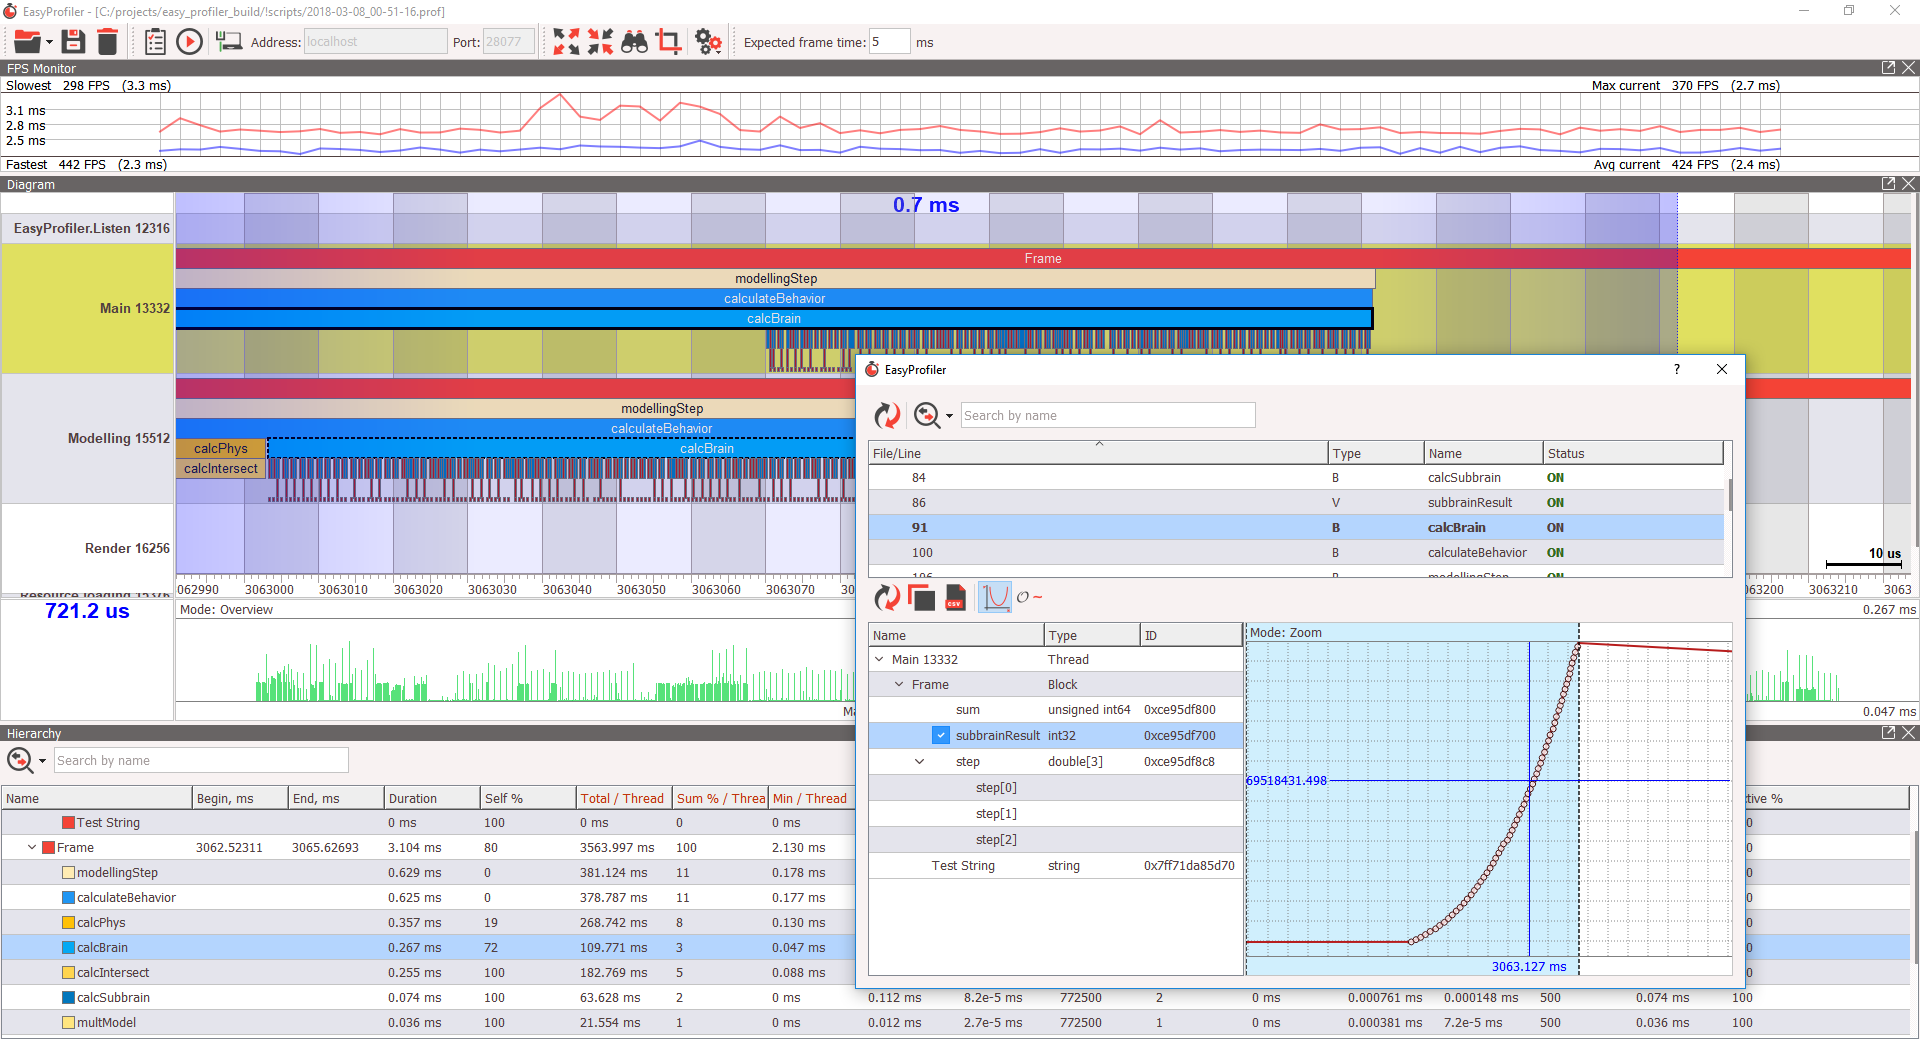
 Profiling CryEngine SDK example
 New UI style in version 2.0
Key features
- Extremely low overhead
- Low additional memory usage
- Cross-platform
- Profiling over network
- Capture thread context-switch events
- Store user variables (both single values and arrays)
- GUI could be connected to an application which is already profiling (so you can profile initialization of your application)
- Monitor main thread fps at real-time in GUI even if profiling is disabled or draw your own HUD/fps-plot directly in your application using data provided by profiler
- Save a snapshot (selected area) of profiled data from file
- Add bookmarks at any place on the timeline
- Configurable timer type with CMakeLists or preprocessor macros
Usage
Integration
General
First of all you can specify path to include directory which contains include/profiler directory and define macro BUILD_WITH_EASY_PROFILER.
For linking with easy_profiler you can specify path to library.
If using CMake
If you are using cmake set CMAKE_PREFIX_PATH to lib/cmake/easy_profiler directory (from release package) and use function find_package(easy_profiler) with target_link_libraries(... easy_profiler).
Example:
project(my_application)

set(SOURCES
    main.cpp
)

# CMAKE_PREFIX_PATH should be set to <easy_profiler-release_dir>/lib/cmake/easy_profiler
find_package(easy_profiler REQUIRED)  # STEP 1 #########################

add_executable(my_application ${SOURCES})

target_link_libraries(my_application easy_profiler)  # STEP 2 ##########
Inserting blocks
Example of usage.
#include <easy/profiler.h>

void foo() {
    EASY_FUNCTION(profiler::colors::Magenta); // Magenta block with name "foo"

    EASY_BLOCK("Calculating sum"); // Begin block with default color == Amber100
    int sum = 0;
    for (int i = 0; i < 10; ++i) {
        EASY_BLOCK("Addition", profiler::colors::Red); // Scoped red block (no EASY_END_BLOCK needed)
        sum += i;
    }
    EASY_END_BLOCK; // End of "Calculating sum" block

    EASY_BLOCK("Calculating multiplication", profiler::colors::Blue500); // Blue block
    int mul = 1;
    for (int i = 1; i < 11; ++i)
        mul *= i;
    //EASY_END_BLOCK; // This is not needed because all blocks are ended on destructor when closing braces met
}

void bar() {
    EASY_FUNCTION(0xfff080aa); // Function block with custom ARGB color
}

void baz() {
    EASY_FUNCTION(); // Function block with default color == Amber100
}
EasyProfiler is using Google Material-Design colors palette, but you can use custom colors in ARGB format (like shown in example above).
The default color is Amber100 (it is used when you do not specify color explicitly).
Storing variables
Example of storing variables:
#include <easy/profiler.h>
#include <easy/arbitrary_value.h> // EASY_VALUE, EASY_ARRAY are defined here

class Object {
    Vector3 m_position; // Let's suppose Vector3 is a struct { float x, y, z; };
    unsigned int  m_id;
public:
    void act() {
        EASY_FUNCTION(profiler::colors::Cyan);

        // Dump variables values
        constexpr auto Size = sizeof(Vector3) / sizeof(float);
        EASY_VALUE("id", m_id);
        EASY_ARRAY("position", &m_position.x, Size, profiler::color::Red);

        // Do something ...
    }

    void loop(uint32_t N) {
        EASY_FUNCTION();
        EASY_VALUE("N", N, EASY_VIN("N")); /* EASY_VIN is used here to ensure
                                            that this value id will always be
                                            the same, because the address of N
                                            can change */
        for (uint32_t i = 0; i < N; ++i) {
            // Do something
        }
    }
};
Collect profiling data
There are two ways to collect profiling data: streaming over network and dumping data to file.
Streaming over network
This is the most preferred and convenient method in many cases.
- (In profiled app) Invoke
profiler::startListen(). This will start new thread to listen28077port for the start-capture-signal from profiler_gui. - (In UI) Connect profiler_gui to your application using
hostnameorIP-address. - (In UI) Press
Start capturebutton in profiler_gui. - (In UI) Press
Stop capturebutton in profiler_gui to stop capturing and wait until profiled data will be passed over network. - (Optional step)(In profiled app) Invoke
profiler::stopListen()to stop listening.
Example:
void main() {
    profiler::startListen();
    /* do work */
}
Dump to file
- (Profiled application) Start capturing by putting
EASY_PROFILER_ENABLEmacro somewhere into the code. - (Profiled application) Dump profiled data to file in any place you want by
profiler::dumpBlocksToFile("test_profile.prof")function.
Example:
void main() {
    EASY_PROFILER_ENABLE;
    /* do work */
    profiler::dumpBlocksToFile("test_profile.prof");
}
Note about thread context-switch events
To capture a thread context-switch events you need:
- On Windows: launch your application "as Administrator"
- On Linux: you can launch special
systemtapscript with root privileges as follow (example on Fedora):
#stap -o /tmp/cs_profiling_info.log scripts/context_switch_logger.stp name APPLICATION_NAMEAPPLICATION_NAME - name of your application
There are some known issues on a linux based systems (for more information see wiki)
Profiling application startup
To profile your application startup (when using network method) add EASY_PROFILER_ENABLE macro into the code together with profiler::startListen().
Example:
void main() {
    EASY_PROFILER_ENABLE;
    profiler::startListen();
    /* do work */
}
This will allow you to collect profiling data before profiler_gui connection. profiler_gui will automatically display capturing dialog window after successful connection to the profiled application.
Build
Prerequisites
- CMake 3.0 or higher
- Compiler with c++11 support
- for Unix systems: compiler with
thread_localsupport is highly recommended: GCC >=4.8, Clang >=3.3
- for Unix systems: compiler with
Additional requirements for GUI:
- Qt 5.3.0 or higher
Linux
$ mkdir build
$ cd build
$ cmake -DCMAKE_BUILD_TYPE="Release" ..
$ make
MacOS
$ mkdir build
$ cd build
$ cmake -DCMAKE_CXX_COMPILER=g++-5 -DCMAKE_C_COMPILER=gcc-5 -DCMAKE_BUILD_TYPE="Release" ..
$ make
Windows
If you are using QtCreator IDE you can just open CMakeLists.txt file in root directory.
If you are using Visual Studio you can generate solution by cmake generator command.
Examples shows how to generate Win64 solution for Visual Studio 2013. To generate for another version use proper cmake generator (-G "name of generator").
Way 1
Specify path to cmake scripts in Qt5 dir (usually in lib/cmake subdir) and execute cmake generator command, for example:
$ mkdir build
$ cd build
$ cmake -DCMAKE_PREFIX_PATH="C:\Qt\5.3\msvc2013_64\lib\cmake" .. -G "Visual Studio 12 2013 Win64"
Way 2
Create system variable "Qt5Widgets_DIR" and set it's value to "[path-to-Qt5-binaries]\lib\cmake\Qt5Widgets". For example, "C:\Qt\5.3\msvc2013_64\lib\cmake\Qt5Widgets". And then run cmake generator as follows:
$ mkdir build
$ cd build
$ cmake .. -G "Visual Studio 12 2013 Win64"
QNX
$ souce $QNX_ENVIRONMENT
$ mkdir build
$ cd build
$ cmake -DCMAKE_TOOLCHAIN_FILE=/path/to/QNXToolchain.cmake ..
For more information and example for QNXToolchain.cmake see this PR
Android
You can build native library for android by using NDK and standalone toolchain. See comment for this PR to get a more detailed instruction.
Status
Branch develop contains all v2.0.0 features and new UI style.
Please, note that .prof file header has changed in v2.0.0:
struct EasyFileHeader {
    uint32_t signature = 0;
    uint32_t version = 0;
    profiler::processid_t pid = 0;
    int64_t cpu_frequency = 0;
    profiler::timestamp_t begin_time = 0;
    profiler::timestamp_t end_time = 0;

    // Changed order of memory_size and blocks_number relative to v1.3.0
    uint64_t memory_size = 0;
    uint64_t descriptors_memory_size = 0;
    uint32_t total_blocks_number = 0;
    uint32_t total_descriptors_number = 0;
};
License
Licensed under either of
- MIT license (mit.lic or http://opensource.org/licenses/MIT)
- Apache License, Version 2.0 (apache.lic or http://www.apache.org/licenses/LICENSE-2.0)
at your option.