vilterp / Elm Tracing Interpreter
Programming Languages
Elm Tracing Interpreter
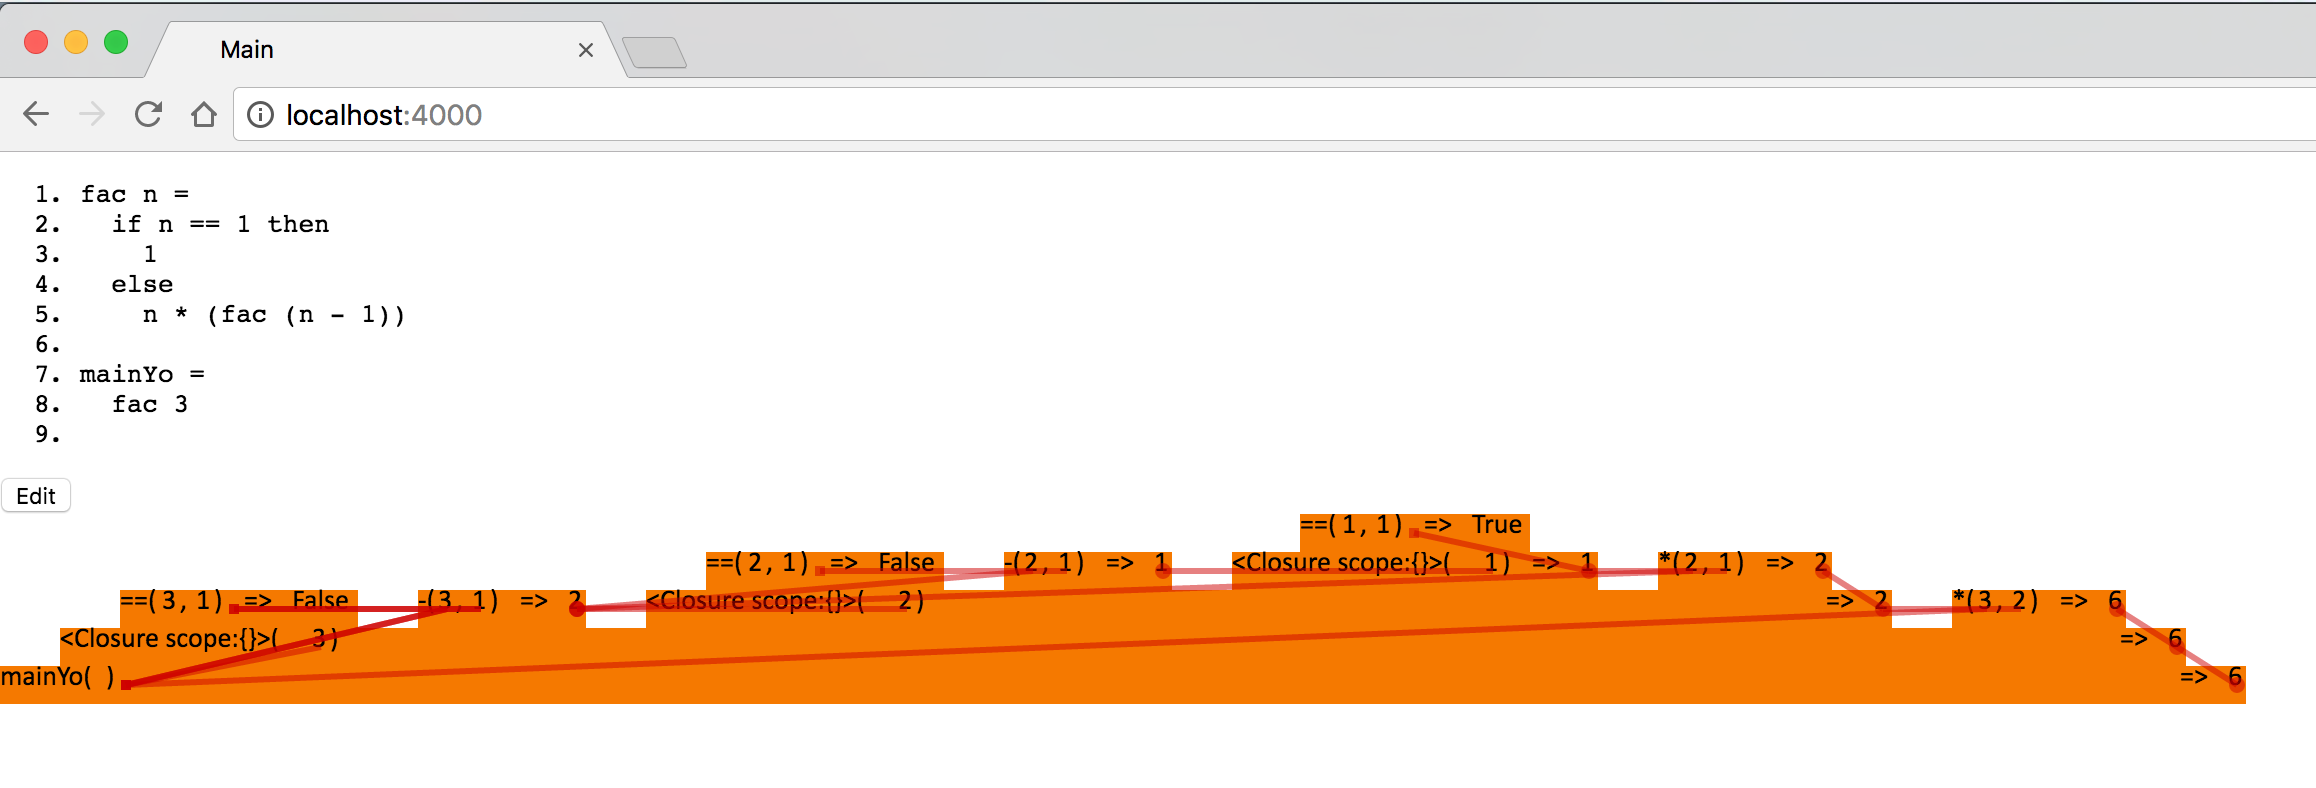
Visualization of computing the factorial of 3: a flame graph with red lines representing the flow of values.
- return values may come from return values of other functions
- arguments may come from return values of prior function calls
- arguments can come from literals, represented as a small square to the right of the arguments of the function in which they were evaluated.
Overview
We love Elm because our code runs without runtime exceptions, but what if you have the wrong output? Even if we know what arguments the misbehaving function was passed to produce the bad output, we still have to start at both ends (the arguments and output) toward some point in between where something went wrong, often by inserting many log statements, recompiling, and re-running.
This project is an attempt to give total knowledge of the execution of an Elm function, so we can track down what went wrong, or just explore.
Build & Run
make deps
make start
And go to localhost:4000.
Note: I've included hacked-compiler/elm-make, which I pre-built from my forks of elm-make and elm-compiler: vilterp/elm-make:json-ast and vilterp/elm-compiler:json-ast. Those are built as the core tools normally are, which is a little more involved.
How it works
Elm source
=(compiler)=> JSON AST
=(tracing interpreter)=> Call Tree w/ TVals
=(elm-diagrams)=> Visualization
Current state, future work
More detail in the Trello.
- interpreter
- doesn't cover ADTs, records, or
caseexpressions yet - doesn't even handle importing Elm code from other modules (almost there); doesn't yet reimplement things in
corethat are implemented with native code
- doesn't cover ADTs, records, or
- visualization
- would like to link the flame graph, value viewer, and source code viewer together a lot more.
- uncurrying: we interpret functions in a curried fashion, but it would be nice to collapse applications of multiple arguments to one stack frame in the visualization; currently this is only done with binary operators.
- general usability & explorability… (i.e. don't show all the red lines at once; enable drilling down and following a thread)
- a nested DAG resembling lemur instead of a flame graph? idk…
Practical challenges
- Upstreaming the JSON AST compiler backend (currently it's not even a flag or anything; always does JSON. "hacking" is really a descriptive word of what I did here)
- How to keep Elm AST types in sync with Haskell types (this may be useful for other projects though)
- How to fit this inside of the time-travelling debugger, or generally make it usable in more places
Prior art
Total-recording debuggers are not a new idea; I can't remember any to cite and am not taking direct inspiration from any of them. The closest thing in my mind is Ravi Chugh's Sketch-n-Sketch (written in Elm, but with its own language), which uses interpreter traces to infer program changes from direct manipulation of graphical program output. (Much more advanced than this!)

