kosho / Flight Track
Logstash config and Kibana dashboard to visualize ADS-B signals. Your own receiver with dump1090 is required.
Stars: ✭ 36
Projects that are alternatives of or similar to Flight Track
microservice-elk
Creating microservice using Spring Boot, Eureka, Zuul, Sleuth, Zipkin and ELK Stack
Stars: ✭ 19 (-47.22%)
Mutual labels: kibana, logstash
WAZUH-OSSEC
WAZUH - The Open Source Security Platform Installation
Stars: ✭ 79 (+119.44%)
Mutual labels: kibana, logstash
synesis lite syslog
Syslog collection with the Elastic Stack.
Stars: ✭ 31 (-13.89%)
Mutual labels: kibana, logstash
eslog tutorial
From Raw Logs to Real Insights - A tutorial for getting started with log analytics using Elastic Stack.
Stars: ✭ 28 (-22.22%)
Mutual labels: kibana, logstash
Sample Spring Microservices
Many samples in different branches that shows how to create microservices with Spring Boot, Spring Cloud, Zipkin, Zuul, Eureka, Hystrix, Kubernetes, Elastic Stack and many more tools
Stars: ✭ 368 (+922.22%)
Mutual labels: logstash, kibana
Elk Docker
Docker configuration for ELK monitoring stack with Curator and Beats data shippers support
Stars: ✭ 342 (+850%)
Mutual labels: logstash, kibana
elk-stack
ELK Stack (Elasticsearch, Logstash & Kibana)
Stars: ✭ 13 (-63.89%)
Mutual labels: kibana, logstash
seahorse
ELKFH - Elastic, Logstash, Kibana, Filebeat and Honeypot (HTTP, HTTPS, SSH, RDP, VNC, Redis, MySQL, MONGO, SMB, LDAP)
Stars: ✭ 31 (-13.89%)
Mutual labels: kibana, logstash
Docker monitoring logging alerting
Docker host and container monitoring, logging and alerting out of the box using cAdvisor, Prometheus, Grafana for monitoring, Elasticsearch, Kibana and Logstash for logging and elastalert and Alertmanager for alerting.
Stars: ✭ 479 (+1230.56%)
Mutual labels: logstash, kibana
skalogs-bundle
Open Source data and event driven real time Monitoring and Analytics Platform
Stars: ✭ 16 (-55.56%)
Mutual labels: kibana, logstash
spring-boot-elk
An sample todo app demonstrating centralised logging using ELK stack
Stars: ✭ 20 (-44.44%)
Mutual labels: kibana, logstash
k8s-elk
Kubernetes ELK - ElasticSearch, Kibana, Logstash, and all the trimmings
Stars: ✭ 37 (+2.78%)
Mutual labels: kibana, logstash
Ansible Elk
📊 Ansible playbook for setting up an ELK/EFK stack and clients.
Stars: ✭ 284 (+688.89%)
Mutual labels: logstash, kibana
Awesome Elasticsearch
A curated list of the most important and useful resources about elasticsearch: articles, videos, blogs, tips and tricks, use cases. All about Elasticsearch!
Stars: ✭ 4,168 (+11477.78%)
Mutual labels: logstash, kibana
Flight Track - ADS-B Signal Visualization with Elastic Stack
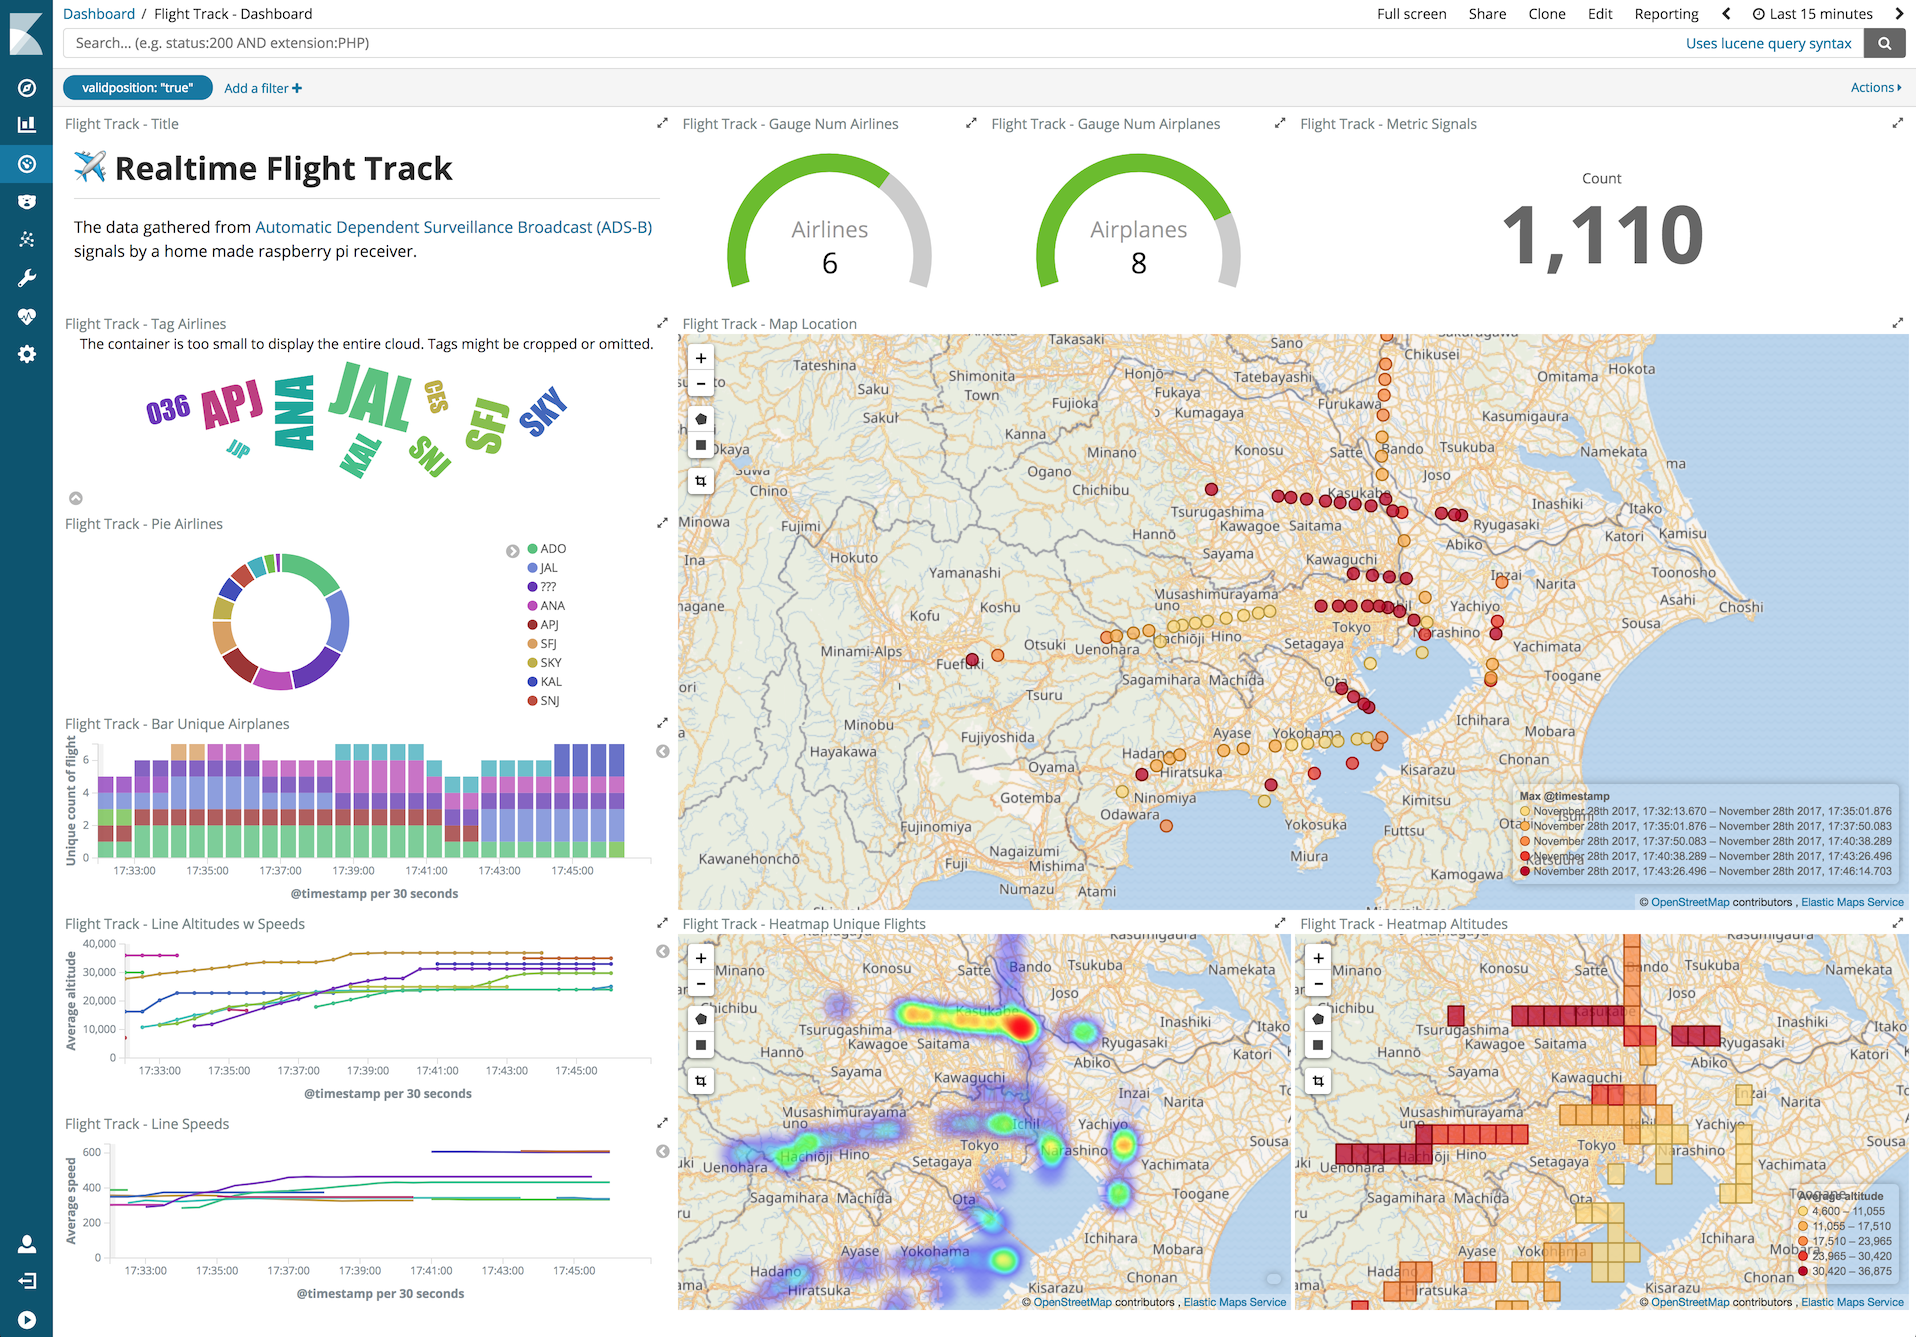
Prerequirements
ADS-B Receiver and Dump1090 Software
You must have set up your own ADS-B receiver and are receiving the signal by using dump1090. The installation instructions can be found here.
Elastic Stack
You must install Elasticsearch and Kibana version 6.0.0 or abover properly. Using Elastic Cloud could be a good alternative choise. Logstash 6.0.0 or higher will be used to fetch the airplace location periodically from the dump1090 and to ingest the data to Elasticsearch.
Setup and Run
Adjust Logstash Configuration File
- Open
flight-track-logstash.confby a text editor and set the URL of the dump1090 web service under thehttp_pollerof the input plugin configuration. - Go to the output plugin configuration and make sure the hosts setting of elasticsearch output is properly set.
Run
Type in the below command to run dump1090 and logstash.
$ dump1090 --net --aggressive --quiet &
$ logstash -f flight-track-logstash.conf
Import Kibana Visuals and Dashboard
Type in the following command to load the dashboard into Kibana. It will create the index pattern, visualizations and the dashboard.
$ curl -XPOST -d @flight-track-kibana.json \
 "your_kibana_host:5601/api/kibana/dashboards/import" \
  -H 'kbn-xsrf: true' \
  -H 'Content-type: application/json'
Note that the project description data, including the texts, logos, images, and/or trademarks,
for each open source project belongs to its rightful owner.
If you wish to add or remove any projects, please contact us at [email protected].