

🎯 About this project
Football Passing Networks is an interactive web application to explore data visualizations on soccer passing networks.
🌐 Website
⚽ About passing networks
📚 Papers
- Pappalardo, L., Cintia, P., Rossi, A. et al. A public data set of spatio-temporal match events in soccer competitions. Sci Data 6, 236. 2019.
- Buldú JM, Busquets J, Martínez JH, Herrera-Diestra JL, Echegoyen I, Galeano J and Luque J (2018). Using Network Science to Analyse Football Passing Networks: Dynamics, Space, Time, and the Multilayer Nature of the Game. Front. Psychol. 9:1900
- Buldú, J.M., Busquets, J., Echegoyen, I. et al. Defining a historic football team: Using Network Science to analyze Guardiola’s F.C. Barcelona. Sci Rep 9, 13602, 2019.
- Gonçalves, Bruno & Coutinho, Diogo & Santos, Sara & Peñas, Carlos & Saiz, Sergio & Sampaio, Jaime. Exploring Team Passing Networks and Player Movement Dynamics in Youth Association Football. PLoS ONE. 12, 2017.
- Korte F, Link D, Groll J and Lames M. Play-by-Play Network Analysis in Football. Front. Psychol. 10:1738, 2019.
📰 Articles
- World Cup 2018: Football With Graph Theory
- The Opta Legends Series - Part 1: Andrea Pirlo
- Interactive Passing Networks
- Using science to identify true soccer stars
- Explaining xGChain Passing Networks
- Passing Network of Football
- Network Analysis and Visualization with R and igraph
- Static and dynamic network visualization with R
📌 Blogs
- BetweenThePosts
- Fútbolismo
- Joe Gallagher
- James' Blog
- R, Scientometrics, Knowledge Management, and Social Network Analysis
- Katya Ognyanova
- soccermetrics
📂 Resources & Tools
- matiasmascioto/awesome-soccer-analytics
- devinpleuler/analytics-handbook
- Friends-of-Tracking-Data-FoTD/passing-networks-in-python
- Friends-of-Tracking-Data-FoTD/mapping-match-events-in-Python
- openfootball/world-cup.json
- openfootball/world-cup
- lsv/fifa-worldcup-2018
- jokecamp/FootballData
- planetopendata/awesome-football
- JoGall/soccermatics
- yorobot/football.csv
- martj42/international_results
- SciSports-Labs/fot-valuing-actions
- CleKraus/soccer_analytics
- Dato-Futbol/passing-networks
- sharmaabhishekk/passmaps
- metrica-sports/sample-data
- Bustami/DatoFutbol
- kateto/R-Network-Visualization-Workshop
- kateto/Network_Analysis_R_Examples
- kateto/R-Network-Visualization-Basics-to-Advanced
📷 Visualizations
👀 Accounts to follow
- Women's Soccer Visualizations
- WomensFootyStat
- Eilidh Thomson
- Peter McKeever
- Karun Singh
- Luca Pappalardo
- Joe Gallagher
- Ricardo Tavares
- William Spearman
- Sergio Llana
- Adrià Arbués
- Devin Pleuler
- Mladen Sormaz
- David Sumpter
- Jernej
- David Fombella
- Dato Fútbol
- Carlo Zapponi
- James Grayson
- Katherine Ognyanova
- Tussen de linies
- Marton Balla
- Statified Football
- Robin Wilhelmus
- American Soccer Analysis
- Julien Demeaux
- Sounders Sports Science & Analytics
- Ravi Ramineni
💾 Dataset
- Pappalardo, Luca; Massucco, Emanuele (2019). Soccer match event dataset. figshare. Collection.
💻 Development Stack
🔧 Install Dependencies
# install python dependencies
chmod +x install_python.sh
./install_python.sh

# install node dependencies
npm install

# install clojure dependencies
npm run compile-once
☕ Run Project
npm start🏃 Run Tests
npm test💽 IO Usage
First of all, download the dataset inside the directory src/main/data/soccer_match_event_dataset like so:
src/main/data/soccer_match_event_dataset
├── competitions.json
├── events_England.json
├── events_European_Championship.json
├── events_France.json
├── events_Germany.json
├── events_Italy.json
├── events_Spain.json
├── events_World_Cup.json
├── matches_England.json
├── matches_European_Championship.json
├── matches_France.json
├── matches_Germany.json
├── matches_Italy.json
├── matches_Spain.json
├── matches_World_Cup.json
├── players.json
└── teams.json
Then, you can generate some data like this:
# just once
chmod +x sh/streamline.sh

# Params
# - championship [England | European_Championship | France | Germany | Italy | Spain | World_Cup]
# - match-id (check out src/main/data/match_ids)

# Use
# ./sh/streamline.sh championship match-id

# get all the data for Italian championship
./sh/streamline.sh Italy

# get data for match 2576338
./sh/streamline.sh Italy 2576338
The streamline.sh will generate six files for each match:
# raw data from the match
src/main/data/matches/italy_genoa_torino,_1_2_2576338.edn
src/main/data/matches/italy_genoa_torino,_1_2_2576338.json

# processed data to create a passing network
src/main/data/graphs/italy_genoa_torino,_1_2_2576338.edn
src/main/data/graphs/italy_genoa_torino,_1_2_2576338.json

# passing network with metrics calculations
src/main/data/analysis/italy_genoa_torino,_1_2_2576338.edn
src/main/data/analysis/italy_genoa_torino,_1_2_2576338.json
Missing matches analysis can be found within missing.edn.
📐 Understanding the Metrics
Using Network Science to Analyse Football Passing Networks: Dynamics, Space, Time, and the Multilayer Nature of the Game
At the topological microscale, the importance of each player has been related to:
- its degree, which is the number of passes made by a player (Cotta et al., 2013);
- eigenvector centrality, a measure of importance obtained from the eigenvectors of the adjacency matrix (Cotta et al., 2013);
- closeness, measuring the minimum number of steps that the ball has to undergo from one player to reach any other in the team (López-Peña and Touchette, 2012);
- betweenness centrality, which accounts how many times a given player is necessary for completing the routes (made by the ball) connecting any other two players of its team (Duch et al., 2010; López-Peña and Touchette, 2012).
- other metrics, such as the clustering coefficient, which measures the number of “neighbors” of a player that also have passed the ball between them (i.e., the number of triangles around a player), has also been quantified to evaluate the contribution of a given player to the local robustness of the passing network (López-Peña and Touchette, 2012).
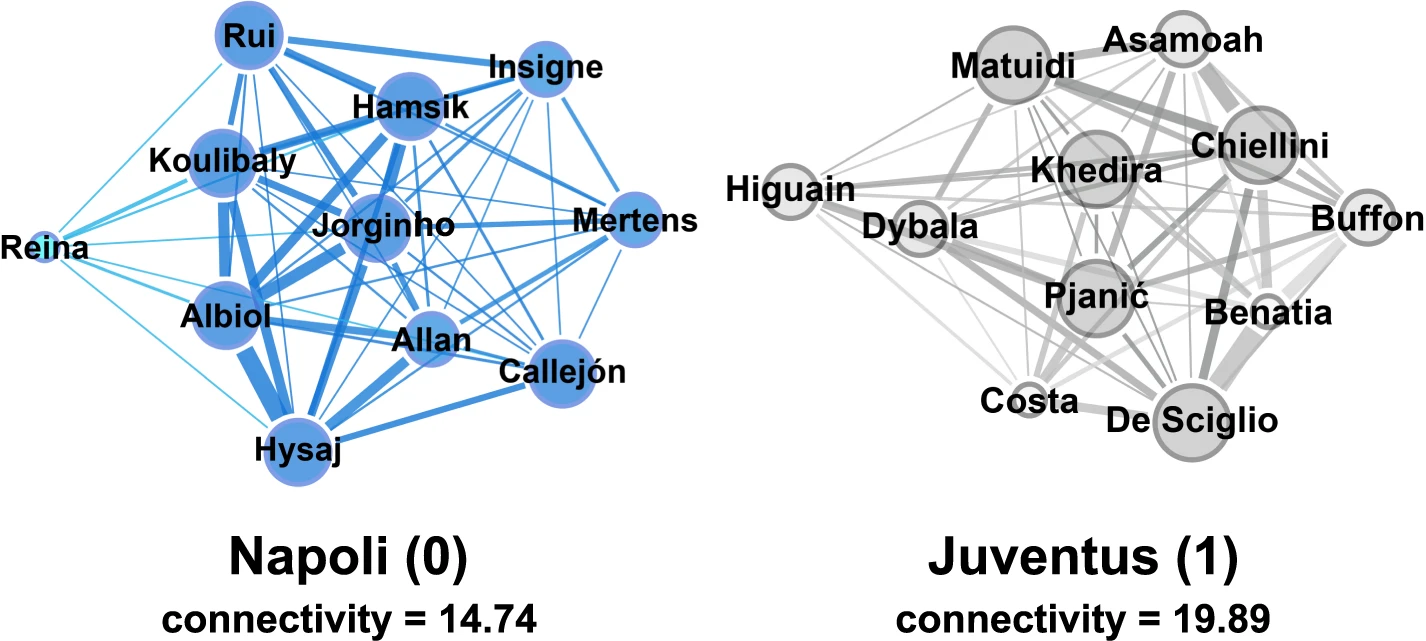
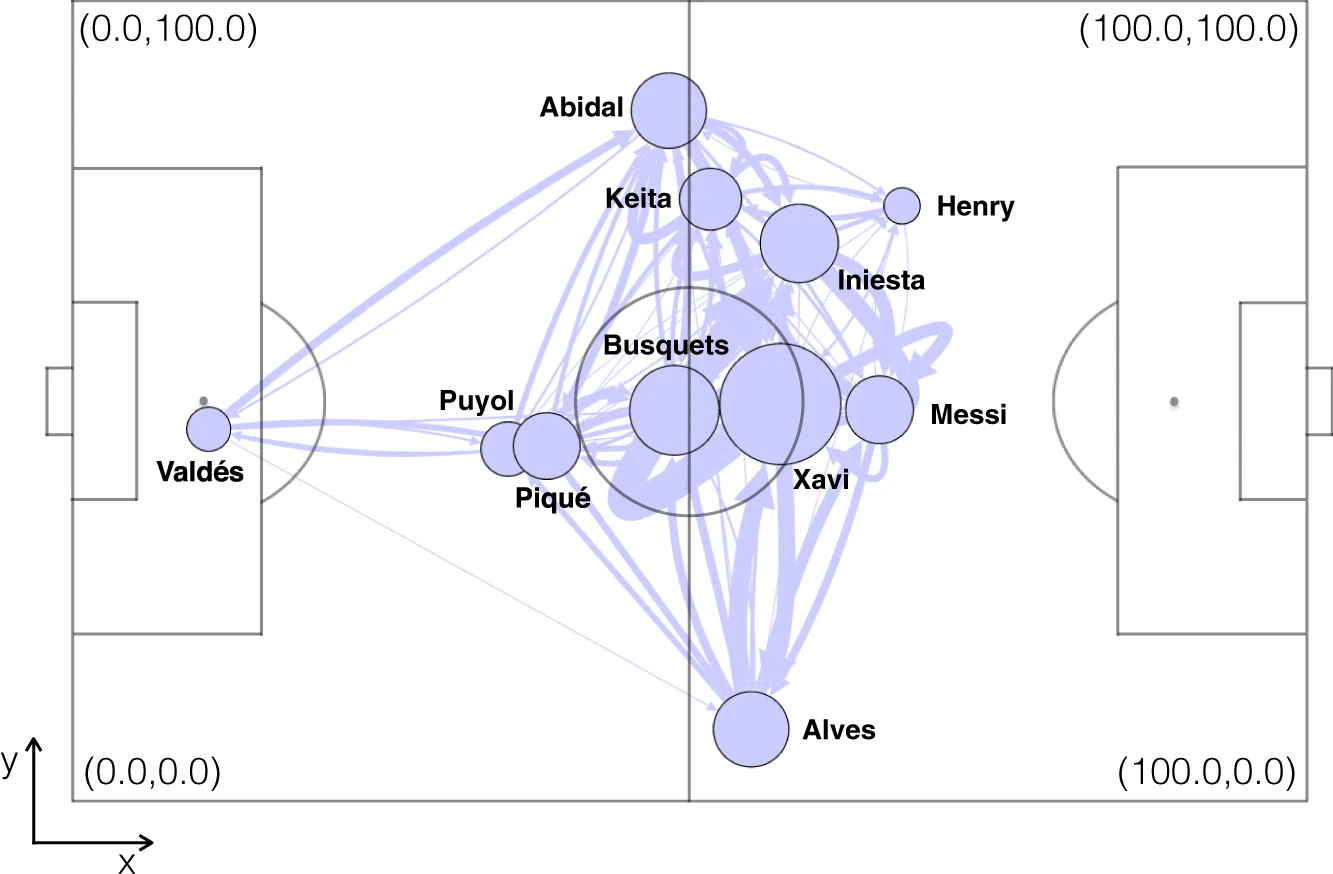
Defining a historic football team: Using Network Science to analyze Guardiola’s F.C. Barcelona
But, how is the structure of the average passing networks? And, more importantly, are there differences between FCB and the rest of the teams? Figure 3 shows the comparison of 6 parameters directly related with the topological organization of the average passing networks (see Methods for a detailed description of all these network parameters). In Fig. 3A, we plot the:
- clustering coefficient C, which is related to the amount of triangles created between any triplet of players. Clustering coefficient is an indicator of the local robustness of networks31, since when a triangle connecting three nodes (i.e. players) exists, and a link (i.e., pass) between two nodes is lost (i.e., not possible to make the pass), there is an alternative way of reaching the other node passing through the other two edges of the triangle. In football, the clustering coefficient mesures the triangulation between three players. As we can observe in Fig. 3A the value of C is much higher in FCB, which reveals that connections between three players are more abundant than at their rivals.
- The average shortest path d is an indicator about how well connected are players inside a team. It measures the “topological distance” that the ball must go through to connect any two players of the team. Since the links of the passing networks are weighted with the number of passes, the topological distance of a given link is defined as the inverse of the number of passes. The higher the number of passes between two players, the closer (i.e., lower) the topological distance between them is. Furthermore, since it is the ball that travels from one player to any other, it is possible to find the shortest path between any pair of players by computing the shortest topological distance between them, no matter if it is a direct connection or if it involves passing through other players of the team. Finally, the average shortest path d of a team is just the average of the shortest path between all pairs of players. As we can observe in Fig. 3B, the shortest path of FCB is much lower than their rivals, which reveals that players are better connected between them. As we will discuss later, note that this fact could be produced by the network organization or just being a consequence of having a higher number of passes, which reduces the overall topological distance of the links and, consequently, the value of d.
- Figure 3C shows the comparison between the largest eigenvalue λ1 of the connectivity matrix A (also known as the weighted adjacency matrix), whose elements aij contain the number of passes between players i and j31. The largest eigenvalue has been used as a quantifier of the network strength, since it increases with the number of nodes and links (see Methods). As expected (due to the high number of passes), the largest eigenvalue λ1 of FCB is much higher than the corresponding values of its rivals. This metric reveals the higher robustness of the passing network of Guardiola’s team, which indicates that an eventual loss of passes would have less consequences in F.C. Barcelona than in the rest of the teams.
- It is also worth analyzing the behavior of the second smallest eigenvalue λ
2 of the Laplacian matrix L, also known as the algebraic connectivity (see Methods). The value of λ2 is related to several network properties. In synchronization, networks with higher λ2 require less time to synchronize54 and in diffusion processes, the time to reach equilibrium also goes with the inverse of λ2. In the context of football passing networks, λ2 can be interpreted as a metric for quantifying the division of a team. The reason is that low values of λ2 indicate that a network is close to be split into two groups, eventually breaking for λ2=0. In this way, the higher the value of λ2 the more interconnected the team is, being a measure of structural cohesion. In Fig. 3D, we have plot the comparison of λ2, which reveals that FCB attacking and defensive lines are more intermingled, leading to a λ~2 higher than its rivals.- Finally, Fig. 3E-F show how centrality (i.e., the importance of the players inside the passing network) is distributed along the team, a metric calculated by means of the eigenvector related to the largest eigenvalue of the connectivity matrix (see Methods). Figure 3E contains the average dispersion of centrality and Fig. 3F shows the highest value of a single player. In both cases, differences are not statistically significant to support evidences of a different centrality distribution between FCB and the rest of the teams.
Exploring Team Passing Networks and PlayerMovement Dynamics in Youth Association Footbal
- Closeness centrality - a closeness score indicates how easy it is for a player to be con-nected with teammates (by passing relation) and, therefore, that player is requested by theteam as a target to pass the ball. Thus, it quantifies the proximity of how close is such player tohis peers [40]. Closeness centrality is defined as the inverse of the farness, where higher valuesassume a positive meaning in the node proximity [8,15,39]. It is calculated by computing theshortest path between the node vand all other nodes, and then calculating the summa.
- Betweenness centrality - a player with higher betweenness scores is crucial to maintainteam passing connections by acting as a connecting bridge. Also, low scores and spread acrosscertain players may be related with well-balanced passing strategy and less specific players’dependence. Betweenness centrality quantifies the occurrences that a node acts as abridge along the geodesic path between other nodes.
Play-by-Play Network Analysis in Football
- Flow Centrality - For each player, flow centrality measures the fraction of plays (or attack units) that it is involved in at least once relative to all plays by its team. Thus, an indication on the overall involvement of all playing positions across a match is provided. By construction, flow centrality values are bounded between 0 and 1. The extreme value of 0 signals that a player was not part of any play in terms of passing or receiving the ball. A value of 1 means that a player was at least involved once in every play of its team during the match. Any flow centrality value in between can be interpreted as the proportion of plays that a player was involved in relative to all plays by its team.
- Flow Betweenness - For each player, flow betweenness measures the fraction of plays in which it functions as an intermediary player relative to all plays by its team. We define a player as intermediate in a play if it actually functions as a bridging player in terms of passing between any other two players. In contrast to CFC, which only tracks involvement, CFB considers the actual passing sequence of a play to track whether a player is positioned in between a sequence to function as a bridging unit. Flow betweenness values are also bounded between 0 and 1. Values of 0 signal that a player did not once receive the ball by a teammate and successfully passed it on to another teammate in any play during a match. A value of 1 means that a player received and passed on the ball at least once in every play of its team. Values in between the extreme values are again the proportion of plays that a player functioned in as a bridging unit relative to all plays by its team. While being in-between always implies being involved in a play, the reversal is not true. Initiating or being at the end of a play implies that a player is involved but not in-between a ball possession. Therefore, the flow centrality value of a player in a match is always at least as high as its corresponding flow betweenness value.
- Weighted betweenness - assesses how often a player is in-between any other two players of its team measured by their strongest passing connections across a match. Thus, its betweenness character is built on aggregated match data and does not necessarily imply that the player functioned as a bridging unit within plays. It is often used as a playmaker indicator (Pena and Touchette, 2012; Clemente and Martins, 2017). The values of weighted betweenness are bounded between 0 and 1 reflecting the proportion of strongest passing connections between any two players in the network that lead via a particular player.
🎨 Visual Reference


📎 License
👤 Author
Rodolfo Mói [LinkedIn] [Twitter]