All Projects → bartromgens → geojsoncontour

bartromgens / geojsoncontour

Licence: MIT license
Convert matplotlib contour plots to geojson

Programming Languages

python
139335 projects - #7 most used programming language

Projects that are alternatives of or similar to geojsoncontour

pyplot-fortran
For generating plots from Fortran using Python's matplotlib.pyplot 📈
Stars: ✭ 158 (+102.56%)
Mutual labels:  matplotlib, contour-plot
publib
Produce publication-level quality images on top of Matplotlib
Stars: ✭ 34 (-56.41%)
Mutual labels:  matplotlib
Rgeo Geojson
RGeo component for reading and writing GeoJSON
Stars: ✭ 162 (+107.69%)
Mutual labels:  geojson
Rgm
Tiny (1kb less) but very powerful React Google Map
Stars: ✭ 221 (+183.33%)
Mutual labels:  geojson
Japancitygeojson
GeoJson of Japanese cities. and TopoJson.
Stars: ✭ 164 (+110.26%)
Mutual labels:  geojson
Mapshaper
Tools for editing Shapefile, GeoJSON, TopoJSON and CSV files
Stars: ✭ 2,813 (+3506.41%)
Mutual labels:  geojson
Gcoord
地理坐标系转换工具
Stars: ✭ 2,206 (+2728.21%)
Mutual labels:  geojson
awesome-matplotlib
A curated list of awesome repos and tutorials to develop great matplotlib graphs and diagrams
Stars: ✭ 154 (+97.44%)
Mutual labels:  matplotlib
echarty
Minimal R/Shiny Interface to ECharts.js
Stars: ✭ 49 (-37.18%)
Mutual labels:  geojson
Qgis Latlontools Plugin
QGIS tools to capture and zoom to coordinates using decimal, DMS, WKT, GeoJSON, MGRS, UTM, and Plus Codes notation. Provides external map support, MGRS & Plus Codes conversion and point digitizing tools.
Stars: ✭ 213 (+173.08%)
Mutual labels:  geojson
Django Geojson
django-geojson is a collection of helpers to (de)serialize (Geo)Django objects into GeoJSON.
Stars: ✭ 209 (+167.95%)
Mutual labels:  geojson
Agstoshapefile
Convert ArcGIS Server Dynamic Map Service to GeoJSON and Shapefile
Stars: ✭ 172 (+120.51%)
Mutual labels:  geojson
Mapstore2
Modern webmapping with OpenLayers, Leaflet and React
Stars: ✭ 251 (+221.79%)
Mutual labels:  geojson
Mapshaper Plus
Generate geojson files for Echarts Map,base on mapshaper(Echarts 地图数据压缩转换)
Stars: ✭ 163 (+108.97%)
Mutual labels:  geojson
ml-book
Codice sorgente ed Errata Corrige del mio libro "A tu per tu col Machine Learning"
Stars: ✭ 16 (-79.49%)
Mutual labels:  matplotlib
Mapboxstatic.swift
Static map snapshots with overlays in Swift or Objective-C on iOS, macOS, tvOS, and watchOS
Stars: ✭ 162 (+107.69%)
Mutual labels:  geojson
L7
🌎 Large-scale WebGL-powered Geospatial Data Visualization analysis framework which relies on Mapbox GL or AMap to render basemaps.
Stars: ✭ 2,517 (+3126.92%)
Mutual labels:  geojson
Geojson.js
Turn your geo data into GeoJSON. For Node.js and the browser.
Stars: ✭ 223 (+185.9%)
Mutual labels:  geojson
pyCircos
python Circos
Stars: ✭ 233 (+198.72%)
Mutual labels:  matplotlib
Python-Course
Python Basics, Machine Learning and Deep Learning
Stars: ✭ 50 (-35.9%)
Mutual labels:  matplotlib

geojsoncontour

Build Status PyPI version Coverage Status
A Python 3 module to convert matplotlib contour plots to geojson. Supports both contour and contourf plots.

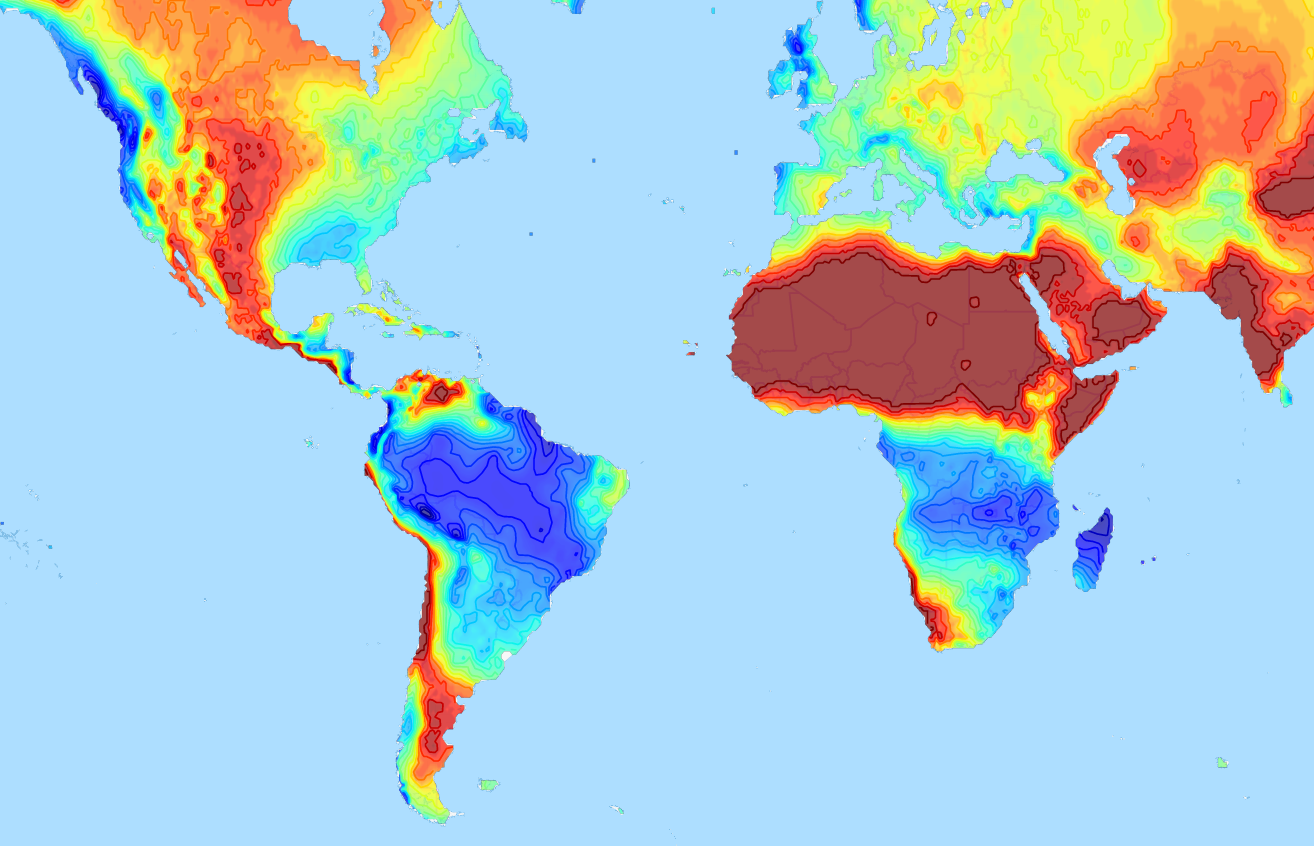
Designed to show geographical contour plots, created with matplotlib/pyplot, as vector layer on interactive slippy maps like OpenLayers and Leaflet.

Demo project that uses geojsoncontour: climatemaps.romgens.com

geojson contour demo usage

Installation

Install with pip,

pip install geojsoncontour

Usage

Use contour_to_geojson to create a geojson with contour lines from a matplotlib.contour plot (not filled). Use contourf_to_geojson to create a geojson with filled contours from a matplotlib.contourf plot.

Contour plot to geojson

import numpy
import matplotlib.pyplot as plt
import geojsoncontour

# Create contour data lon_range, lat_range, Z
<your code here>

# Create a contour plot plot from grid (lat, lon) data
figure = plt.figure()
ax = figure.add_subplot(111)
contour = ax.contour(lon_range, lat_range, Z, cmap=plt.cm.jet)

# Convert matplotlib contour to geojson
geojson = geojsoncontour.contour_to_geojson(
    contour=contour,
    ndigits=3,
    unit='m'
)

For filled contour plots (matplotlib.contourf) use contourf_to_geojson. See example_contour.py and example_contourf.py for simple but complete examples.

Show the geojson on a map

An easy way to show the generated geojson on a map is the online geojson renderer geojson.io or geojson.tools.

Style properties

Stroke color and width are set as geojson properties following https://github.com/mapbox/simplestyle-spec.

Create geojson tiles

Try geojson-vt or tippecanoe if performance is an issue and you need to tile your geojson contours.

Development

Tests

Run all tests,

python -m unittest discover

Release

Install setuptools, wheel and twine:

python -m pip install --upgrade setuptools wheel twine

Increase the version number in setup.py.

Create dist:

python setup.py sdist bdist_wheel

Upload:

twine upload dist/*
Note that the project description data, including the texts, logos, images, and/or trademarks, for each open source project belongs to its rightful owner. If you wish to add or remove any projects, please contact us at [email protected].