geovoronoi – a package to create and plot Voronoi regions inside geographic areas
Markus Konrad [email protected] / [email protected], March 2022
Overview
geovoronoi helps generating Voronoi regions for geographic data, for example coordinates of public universities in a certain country. This in turn may be used to estimate some kind of "coverage". The usage is not confined to geographic data, though. This package allows you to generate finite Voronoi regions inside any valid surrounding polygonal shape.
The main function of this package, voronoi_regions_from_coords(), takes a list of coordinates and calculates the Voronoi regions from them using SciPy. At the edges, these regions go to infinity. We can then take the shape of the surrounding area (e.g. the shape of a country as polygon) to cut the Voronoi regions so that they fit into the provided shape, making the regions at the edges finite. geovoronoi uses shapely for these operations. The package furthermore implements some functions for easy plotting of the resulting Voronoi regions.
Installation
This package is available on PyPI. You can install the latest version via pip as follows:
# install with "plotting" dependencies (recommended):
pip install -U geovoronoi[plotting]

# or install base version:
pip install -U geovoronoi
Usage
You have a geographic area that contains some points for which you want to generate Voronoi regions. This geographic area is a shapely Polygon/MultiPolygon object (that you, for example, obtained from a GeoJSON file that you loaded with GeoPandas or Fiona). The N points you have are either in the form of a Nx2 NumPy array, or a list of shapely Point objects (they can be converted with the functions coords_to_points and points_to_coords). Both the points and the surrounding geographic area must be in the same CRS (coordinate reference system).
Let's take for example these randomly generated points in Italy (in World Mercator CRS):
import numpy as np

# coords = ... generate some coordinates with np.random.uniform ...
print(coords)
array([[1690891.43454513, 4865911.53550427],
[1303898.2749075 , 5398659.4816214 ],
[1379407.32051822, 5701267.51923313],
[1703402.05850744, 4916559.63783754],
...
]])
The surrounding shape of Italy was obtained beforehand from GeoPandas:
import geopandas as gpd

world = gpd.read_file(gpd.datasets.get_path('naturalearth_lowres'))
area = world[world.name == 'Italy']

area = area.to_crs(epsg=3395)    # convert to World Mercator CRS
area_shape = area.iloc[0].geometry   # get the Polygon
Now we can calculate the Voronoi regions, cut them with the geographic area shape and assign the points to them:
from geovoronoi import voronoi_regions_from_coords
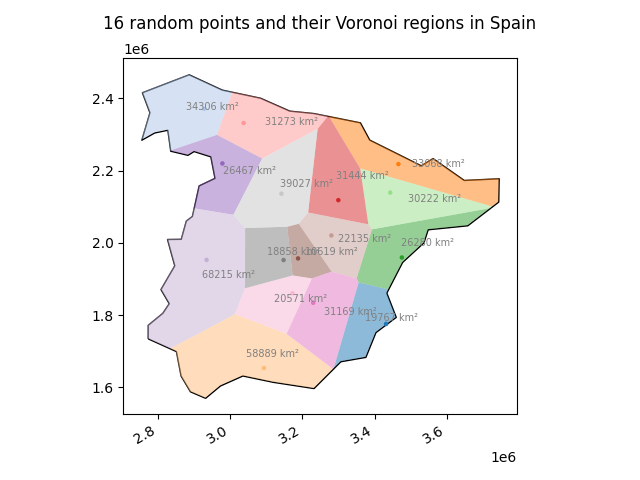
region_polys, region_pts = voronoi_regions_from_coords(coords, area_shape)region_polys is a dict that maps Voronoi region IDs to shapely Polygon objects that represent the shape of the respective Voronoi region. With them, you can do everything that the shapely API provides. You can, for example, get each Voronoi region's area (there's also a helper function calculate_polygon_areas in geovoronoi for that).
region_pts is a dict that maps the same Voronoi region IDs as in region_polys to a list of indices into coords, i.e. these indices represent the points that belong to this Voronoi region. Usually, this is only a single point. However, in case of duplicate points (i.e. two or more points have exactly the same coordinates) all duplicate points are listed for the respective Voronoi region.
You can plot the results with the functions from the plotting sub-module:
import matplotlib.pyplot as plt
from geovoronoi.plotting import subplot_for_map, plot_voronoi_polys_with_points_in_area

fig, ax = subplot_for_map()
plot_voronoi_polys_with_points_in_area(ax, area_shape, region_polys, coords, region_pts)
plt.show()
This would be an example output:
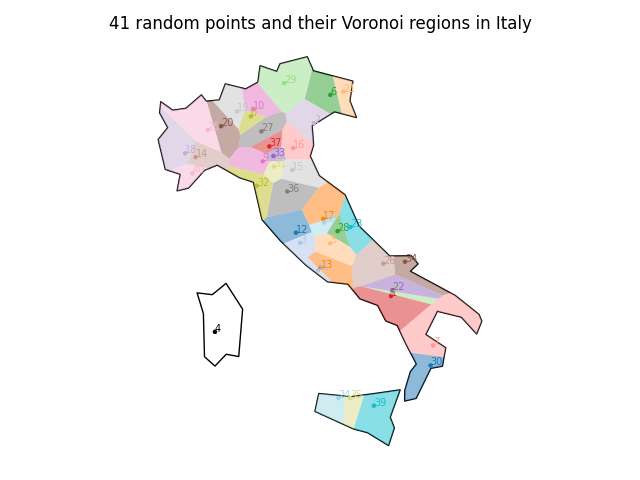
See the full example source code in examples/random_points_across_italy.py. See also the other examples in the examples/ directory that show how to calculate the area of the Voronoi regions, handle duplicate points or interact with the GeoPandas or Fiona packages.
Dependencies
geovoronoi requires Python 3.6 or newer (the package is tested for up to Python 3.10). The following packages need to be installed (if not, they will be automatically installed if you use a Python package manager like pip):
- NumPy
- SciPy
- shapely
- matplotlib (only necessary for plotting)
- geopandas (only necessary for plotting)
- descartes (only necessary for plotting)
License
Licensed under Apache License 2.0. See LICENSE.txt file.