gadenbuie / Ggpomological
Programming Languages
Projects that are alternatives of or similar to Ggpomological
Pomological Colors
Garrick Aden-Buie
Installation
This package isn’t on CRAN, so you’ll need to use the devtools package to install it.
# If you don't have devtools installed
install.packages("devtools")

devtools::install_github("gadenbuie/ggpomological")

# To include the vignette
devtools::install_github("gadenbuie/ggpomological", build_vignettes=TRUE)
Introduction
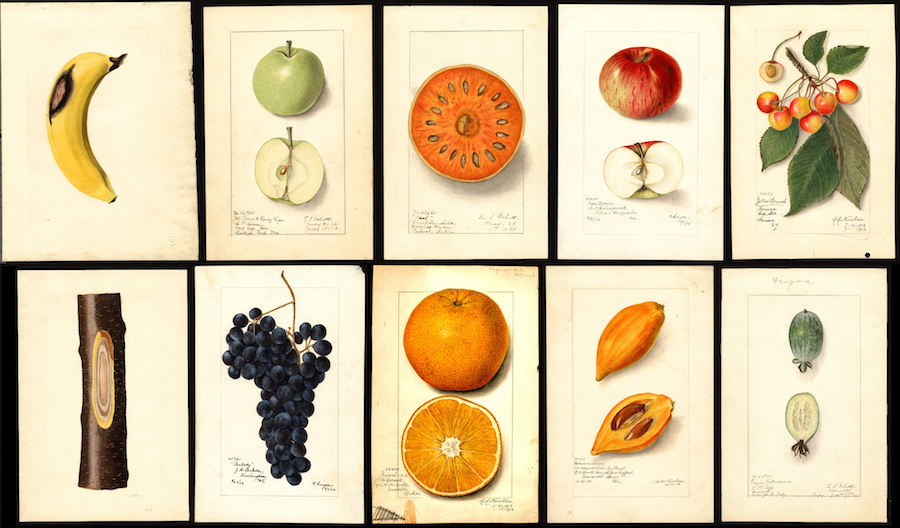
This package provides a ggplot2 theme inspired by the USDA Pomological Watercolors collection and by Aron Atkins’s (@aronatkins) talk on parameterized RMarkdown at rstudio::conf 2018.
Color Palette
The colors for this theme were drawn from many images from the USDA Pomological Watercolors collection, I chose just a few that I thought worked well together for color and fill scales
scales::show_col(ggpomological:::pomological_palette)
and a few colors for the plot background and decoration
scales::show_col(unlist(ggpomological:::pomological_base))
I’ve also included a css file with the complete collection of color samples.
Setup theme and scales
There are three theme-generating functions:
-
theme_pomological()sets the plot theme to be representative of the paper and styling of the watercolors and includes a paper-colored background, -
theme_pomological_plain()has the same styling, just with a transparent (or white) background, -
theme_pomological_fancy()has the paper-colored background and defaults to a fancy handwritten font (Homemade Apple).
For color and fill scales, ggpomological provides
scale_color_pomological() and scale_fill_pomological().
In the future, I might revisit this package to
-
Increase colors in discrete scale
-
Setup paired color scales. Lots of great color pairs in the extracted colors.
-
Set up continuous scale colors (we’ll see…)
Fonts
A handwriting font is needed for the fully authentic pomological look, and I found a few from Google Fonts that fit the bill.
Alternatively, use something like calligrapher.com to create your own handwriting font!
But fonts can be painful in R, so the base functions –
theme_pomological() and theme_pomological_plain() – don’t change the
font by default. To opt into the full pomological effect, use
theme_pomological_fancy() which is just an alias for
theme_pomological(base_family = "Homemade Apple", base_size = 16).
Add paper background!
ggpomological also provides a function named paint_pomological
that uses the
magick
package to add a pomological watercolor paper background and a subtle
texture overlay.
Demo!
We’ll need ggplot2 (loaded with ggpomological) and dplyr
library(ggpomological)
library(dplyr)
Warning: If you don’t have the above fonts installed,
you’ll get an error message with a lot of warnings when running the
below examples. Just replace theme_pomological("Homemade Apple", 16)
with theme_pomological() for the basic theme without the crazy fonts.
Basic iris plot
# Prep msleep data
msleep <- ggplot2::msleep[, c("vore", "sleep_rem", "sleep_total")]
msleep <- msleep[complete.cases(msleep), ]
msleep$vore <- paste0(msleep$vore, "vore")

# Base plot
basic_msleep_plot <- ggplot(msleep) +
  aes(x = sleep_rem, y = sleep_total, color = vore) +
  geom_point(size = 2) +
  labs(color = NULL)

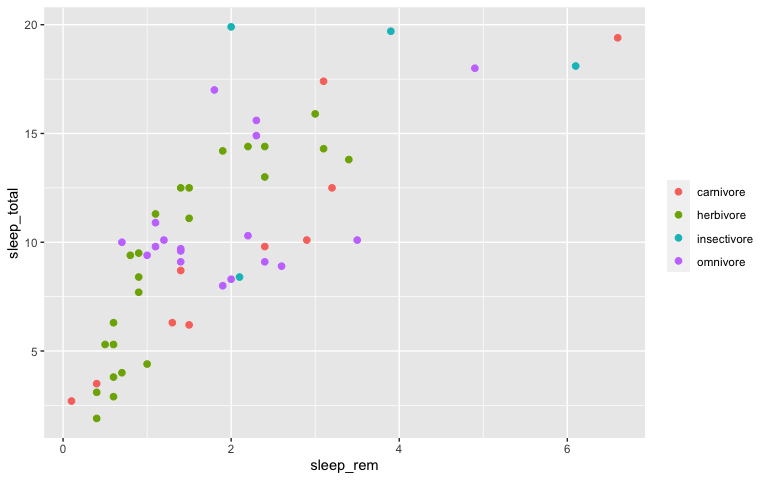
# Just your standard ggplot
basic_msleep_plot
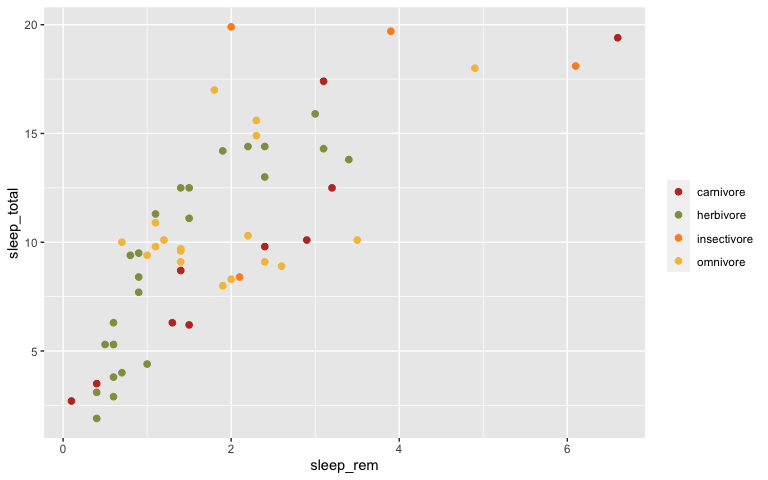
# With pomological colors
basic_msleep_plot <- basic_msleep_plot + scale_color_pomological()
basic_msleep_plot
# With pomological theme
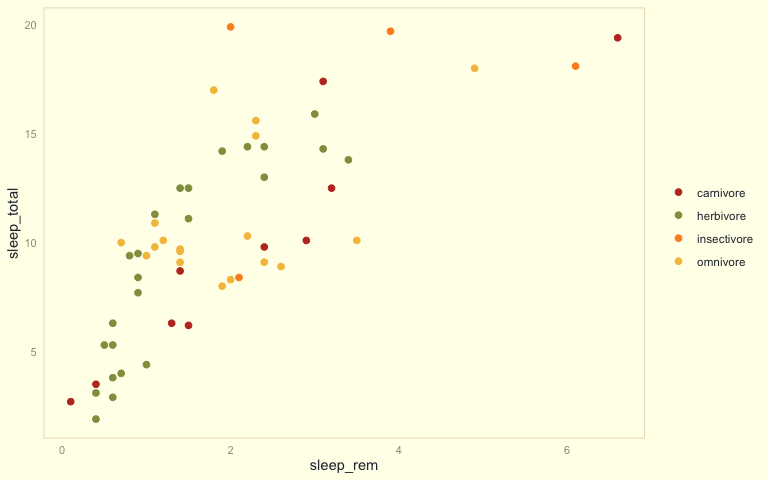
basic_msleep_plot + theme_pomological()
# With transparent background
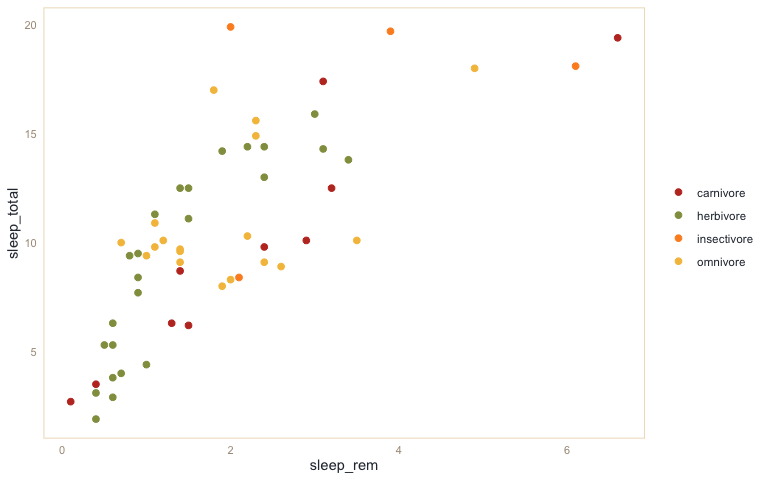
basic_msleep_plot + theme_pomological_plain()
# Or with "fancy" pomological settings
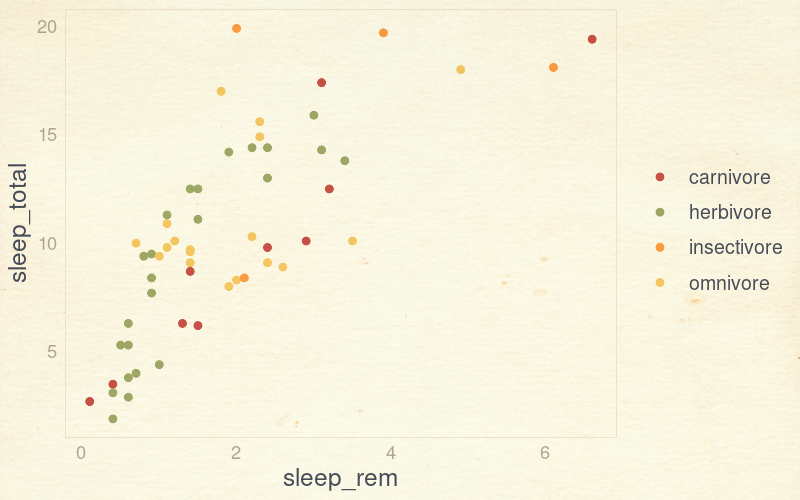
pomological_msleep <- basic_msleep_plot + theme_pomological_fancy()

# Painted!
paint_pomological(pomological_msleep, res = 110)
Stacked bar chart
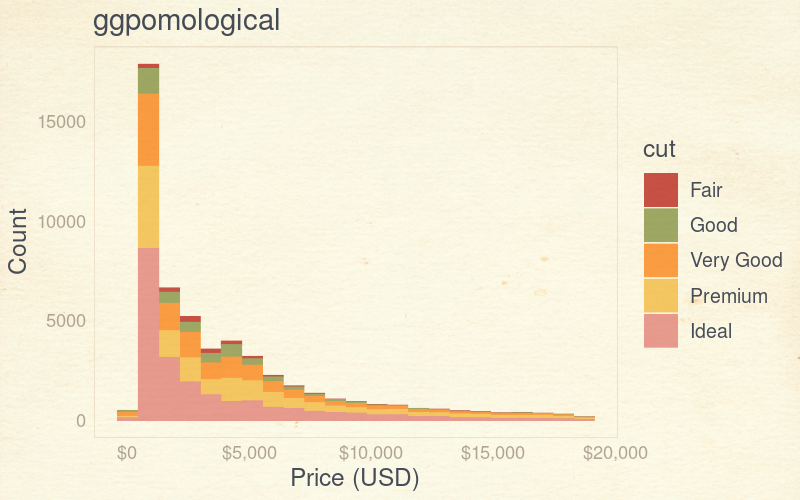
stacked_bar_plot <- ggplot(diamonds) +
  aes(price, fill = cut) +
  geom_histogram(binwidth = 850) +
  xlab('Price (USD)') +
  ylab('Count') +
  ggtitle("ggpomological") +
  scale_x_continuous(labels = scales::dollar_format()) +
  scale_fill_pomological()

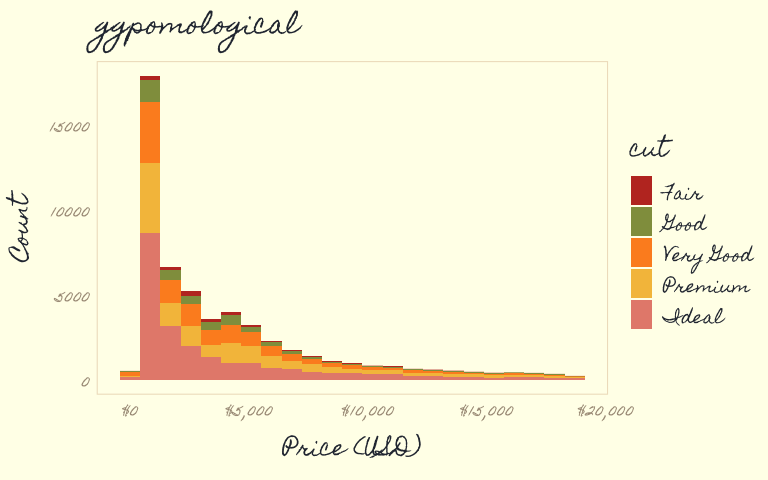
stacked_bar_plot + theme_pomological("Homemade Apple", 16)
paint_pomological(
  stacked_bar_plot + theme_pomological_fancy("Homemade Apple"),
  res = 110
)
Density Plot
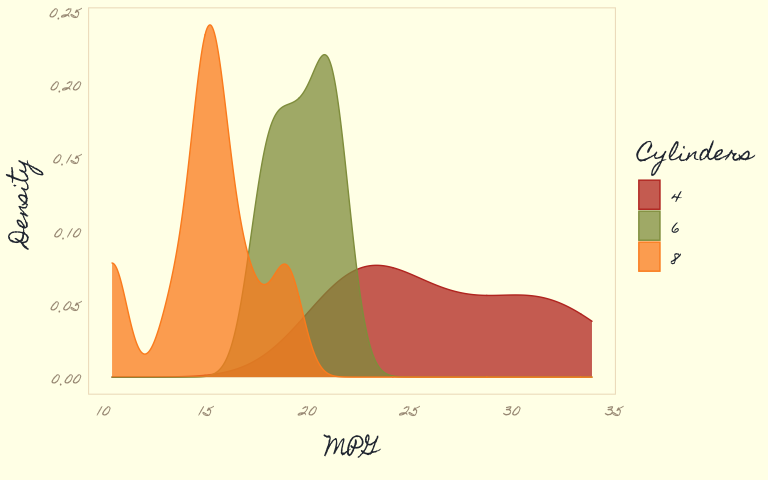
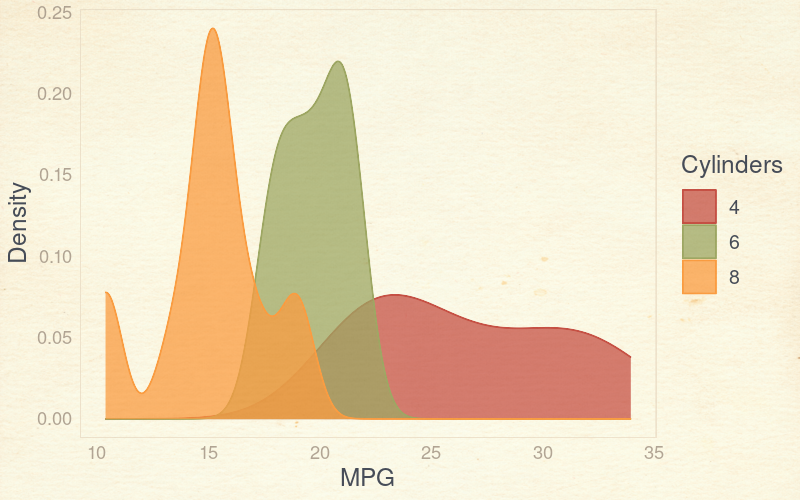
density_plot <- mtcars %>%
  mutate(cyl = factor(cyl)) %>%
  ggplot() +
  aes(mpg, fill = cyl, color = cyl)+
  geom_density(alpha = 0.75) +
  labs(fill = 'Cylinders', colour = 'Cylinders', x = 'MPG', y = 'Density') +
  scale_color_pomological() +
  scale_fill_pomological()

density_plot + theme_pomological("Homemade Apple", 16)
paint_pomological(
  density_plot + theme_pomological_fancy(),
  res = 110
)
Points and lines
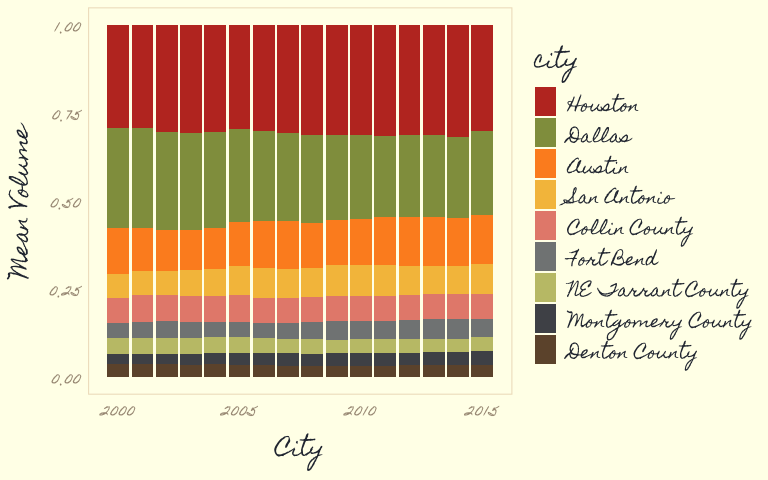
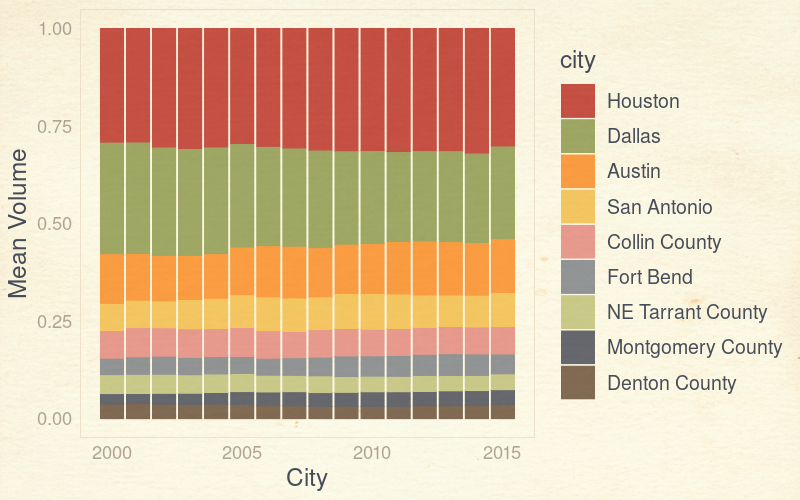
Data from the Texas Housing
big_volume_cities <- txhousing %>%
  group_by(city) %>%
  summarize(mean_volume = mean(volume, na.rm = TRUE)) %>%
  arrange(-mean_volume) %>%
  top_n(length(ggpomological:::pomological_palette)) %>%
  pull(city)
#> Selecting by mean_volume

full_bar_stack_plot <- txhousing %>%
  filter(city %in% big_volume_cities) %>%
  group_by(city, year) %>%
  summarize(mean_volume = mean(volume, na.rm = TRUE)) %>%
  ungroup %>%
  mutate(city = factor(city, big_volume_cities)) %>%
  ggplot() +
  aes(year, mean_volume, fill = city, group = city) +
  geom_col(position = 'fill', width = 0.9) +
  labs(x = 'City', y = 'Mean Volume', color = 'City') +
  theme(panel.grid.minor.x = element_blank()) +
  scale_fill_pomological()

full_bar_stack_plot + theme_pomological("Homemade Apple", 16)
paint_pomological(
  full_bar_stack_plot + theme_pomological_fancy(),
  res = 110
)
One last plot
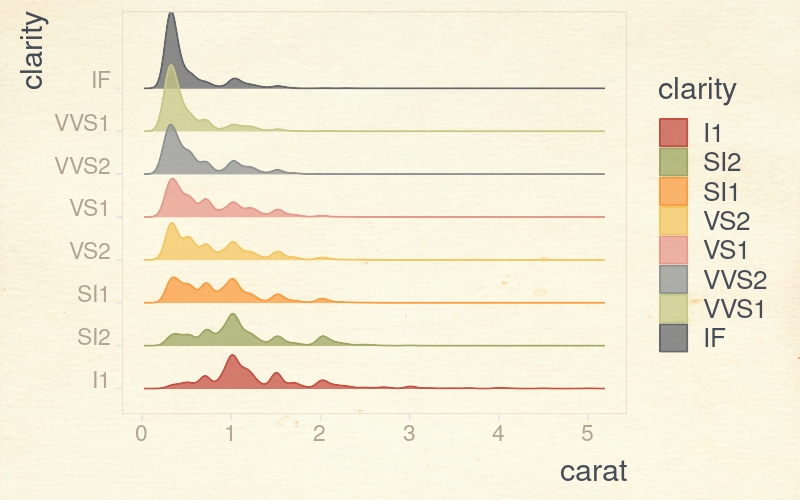
Using my own handwriting and the ggridges package.
ridges_pomological <- ggplot(diamonds) +
  aes(x = carat, y = clarity, color = clarity, fill = clarity) +
  ggridges::geom_density_ridges(alpha = 0.75) +
  theme_pomological(
    base_family = 'gWriting',
    base_size = 20,
    base_theme = ggridges::theme_ridges()
    ) +
  scale_fill_pomological() +
  scale_color_pomological()

paint_pomological(ridges_pomological, res = 110)
#> Picking joint bandwidth of 0.057
- U.S. Department of Agriculture Pomological Watercolor Collection. Rare and Special Collections, National Agricultural Library, Beltsville, MD 20705

