Hacking GHC's Stack for Fun and Profit
This document explains how to look at the stack of a GHC compiled Haskell program, and why that might be of interest even to somebody who's not a GHC hacker. Spoiler: It's a basic building block for many kinds of debugging and profiling tools.
The code / explanations here are for OS X with 32bit GHC 7.6.3 and gcc 4.2.1, but I'll mention relevant differences to make this apply on a different platform / GHC / architecture as well. Just be alert about different word and pointer sizes, register names and calling conventions.
Disclaimer
I'm not what you'd call an expert on the internals of GHC and its RTS. I simply hope this will be helpful, and I'd love to be corrected and find a better way of doing and explaining all of this.
Motivation
GHC's debugging facilities are rather limited. There is a debugger inside the GHCi REPL, but that requires our program to be build and linked by its bytecode compiler. Over the years, there have been many issues preventing otherwise perfectly fine Haskell code from working within GHCi, and even if none of those affect us, we're still left with a much slower running program with significantly changed runtime behavior. Another option would be the -xc flag of GHC's RTS, doing a stack trace for every exception. That one also has its fair share of drawbacks (for instance Ticket #8512).
The situation goes from bad to worse as we move from Haskell exceptions to actual segmentation faults. Here we are completely on our own, as none of the facilities mentioned above work on them. Additionally, the way GHC implements Haskell's stack and generates debug information makes its compiled programs opaque to debuggers like gdb. For this reason, most other profiling and analysis programs will also have a rather hard time with GHC compiled code.
Debugging
Introduction
First, yes, Haskell program's do crash (segfault). There are many APIs and primitives which offer no memory safety guarantees. They are generally used to implement the higher-level, safer systems, or to interface with system APIs like POSIX or OpenGL, or simply for performance reasons (hard to be competitive with C/C++/Fortran when there's a bounds check on every memory access). And even if we ban all of those things from our codebase, we'll very likely still use Haskell libraries which will use unsafe memory operations or call into C code. And this code will inevitably have bugs, and we'll be faced with having our program exit with
Segmentation fault
or
Bus error
and not much more to go on. This can be a potentially very distressing situation. Imagine having your mission critical 1M LoC application just crash after 30min with zero helpful information.
If this was a C/C++/ObjC etc. program, we could simply fire up our favorite debugger and get the full call stack of every thread, function arguments, all local and global variables, the line of code where the segfault happened, etc. Even for code obscured by the optimizer and after some memory corruption we'd still likely get some useful data. Even better, we could use tools like Valgrind, pinpointing subtle memory errors before they cascade into the inevitable segfault. None of this works (well) with GHC compiled programs. Before resorting to debugging with git bisect or a similar measure, please read on!
Sample Program
Before we get to actually poking around the stack, we start by writing a simple crashing Haskell program so we have something to work with. Here:
Main.hs
module Main where

import Data.Vector.Mutable

main :: IO ()
main = do
    someFuncA
    someFuncB

{-# NOINLINE someFuncA #-}
someFuncA :: IO ()
someFuncA = do
    v <- new 100
    unsafeWrite v 0 (0 :: Int)

{-# NOINLINE someFuncB #-}
someFuncB :: IO ()
someFuncB = do
    someFuncC
    someFuncC

{-# NOINLINE someFuncC #-}
someFuncC :: IO ()
someFuncC = do
    v <- new 100
    unsafeWrite v 1000000000 (0 :: Int) -- Crash (hopefully)
crash.cabal should contain
ghc-options: -O2 -threaded
as these flags are likely what we'd likely be using for a real program.
Running crash yields the expected result:
$ ./dist/build/crash/crash
Segmentation fault
The full sample program can also be found in the crash folder.
A first try with gdb
As discussed during the intro, no (direct) help from GHCi / the RTS here. Let's look at what gdb (documentation here, if you need a little refresher) tells us:
$ gdb ./dist/build/crash/crash
GNU gdb 6.3.50-20050815 (Apple version gdb-1515) (Sat Jan 15 08:33:48 UTC 2011)
Copyright 2004 Free Software Foundation, Inc.
GDB is free software, covered by the GNU General Public License, and you are
welcome to change it and/or distribute copies of it under certain conditions.
Type "show copying" to see the conditions.
There is absolutely no warranty for GDB.  Type "show warranty" for details.
This GDB was configured as "x86_64-apple-darwin"...Reading symbols for shared libraries ... done

(gdb) r
Starting program: /Users/Tim/crash/dist/build/crash/crash
Reading symbols for shared libraries ++. done

Program received signal EXC_BAD_ACCESS, Could not access memory.
Reason: KERN_PROTECTION_FAILURE at address: 0xbc0ac520
0x00001d94 in s1A7_info ()
(gdb) bt
#0  0x00001d94 in s1A7_info ()
#1  0x00000000 in ?? ()
(gdb)
Not helpful at all, at least at first sight!
The cryptic symbol s1A7_info is named by GHC's STG phase. It's worth having a look at the link if this is the first time you've heard that acronym. It's a very informative read in any case, and we'll be getting back to it some more. Also see Debugging/CompiledCode#Decodingsymbolnames and Compiler/SymbolNames for additional information on how these symbol names are assigned.
We can compile our program with -ddump-stg -ddump-cmm -ddump-to-file, and if we're lucky we'll find the s1A7 identifier somewhere in the dumped C-- intermediate code (inside dist/build/crash/crash-tmp/Main.dump-* for a cabal build of a program named 'crash'). This way we should at least be able to pin down the module of the crash location, maybe more. Better than nothing!
There is much more information inside the GHC commentary, for instance Debugging/CompiledCode (highly recommended read!). Also see these helpful gdb macros. The commentary also has page on C--.
What we'd really like to see is a full stack trace, though.
The x86 stack
We start by doing a quick review how the stack works with most compiled languages on an x86 system. I'll just point to these two short articles for x86 and x86-64. All clear? Good!
Generating a stack trace for say a C/C++ program on x86 would simply involve looking at the program counter (also called 'PC' or 'instruction pointer', eip on x86, rip on x86-64) to get the top function and then following the singly linked-list of stack frames while collecting the return addresses along the way. The location of the first stack frame will be obtained from the frame pointer (ebp / rbp on x86 / x86-64).
Here are three different implementations of this idea, hopefully making it very clear:
- https://github.com/blitzcode/rsvp/blob/94c167bcf2a82092a8fe21eeb2e7a5a6b2d8fc77/src/prof.cpp#L1478
- https://bitbucket.org/edd/dbg/src/1abb9939664c/src/osx/frames.cpp?at=default
- http://opensource.apple.com/source/gdb/gdb-956/src/gdb/macosx/macosx-self-backtrace.c
Frame pointers are fast and conceptually simple, but come with inherent limitations and don't work with the default code generation parameters of many modern compilers (e.g. -fomit-frame-pointer). Debuggers like gdb generally use special debug information (Call Frame Information, or CFI) or fall back on function prologue analysis. It's slower and vastly more complicated, but more reliable and doesn't require programs to be compiled with frame pointers explicitly enabled.
Some information and source code regarding CFI:
- http://gnu.wildebeest.org/blog/mjw/2007/08/23/stack-unwinding/
- http://code.google.com/p/google-breakpad/source/browse/trunk/src/common/dwarf/cfi_assembler.h
- http://www.nongnu.org/libunwind/
For simplicity, we'll assume the presence of frame pointers (-fno-omit-frame-pointer for gcc and clang) and use that as out stack traversal method for non-Haskell code.
It's not like that
Please (temporarily) forget everything you just read about x86 stack traversal, as GHC has a different stack and uses a different calling convention. Apart from those implementation differences, there is a major conceptual difference as well. Haskell is a lazy language, and its stack is in evaluation order, not source code call order. Add tail call optimization into the mix, and it becomes clear why generating a stack trace for a GHC compiled program is a non-trivial problem.
There's an ongoing discussion on how to improve GHC's diagnostic features with easily accessible stack traces (see ExplicitCallStack, Ticket #3693 contains some very interesting work-in-progress patches to the compiler and RTS).
Notes on RTS headers
We'll soon start looking at various C header files from GHC's RTS. Links will be to HEAD versions of these files, including the in-line excerpts from them. That's perfectly fine for following the explanations here, but when it gets to actually poking around in memory you probably want to look at the header files shipping with your GHC. For me they're in /Library/Frameworks/GHC.framework/Versions/7.6.3-i386/usr/lib/ghc-7.6.3/include/, you might need to look elsewhere or download a source tarball.
There's also the issue of different versions of the RTS. There are debug / no-debug, single / multi-threaded, profiling enabled / disabled and 32 / 64 bit versions of it. You'll need to know what the program you're inspecting links against. See the Rts/Config page for more details.
Unlike most C APIs, the Haskell RTS one does not seem to be usable from C++. Among other issues, code in the headers uses identifiers like new. (Update: Fixed in HEAD, see Ticket #8676)
Finally, SourceTree/Includes from the GHC commentary explains the general include structure.
Locating GHC's stack
How can we find GHC's stack in memory? The STG machine defines two registers of potential interest: BaseReg (or base pointer) and Sp (stack pointer).
Quoting the GHC commentary:
- The STG registers
- There are rather a lot of registers here: more than can be practicably stored in actual available processor registers on most architectures.
- To deal with the lack of processor registers, most of the STG registers are actually kept on the stack in a block of memory pointed to by a special STG register called the "base register" (or BaseReg). To get or set values of registers which are not kept in processor registers, the STG machine generates an instruction to load or store from an address relative to the BaseReg.
- The most important four registers are the BaseReg, the stack pointer (Sp), the heap pointer (Hp), and the general purpose register R1 which is used for intermediate values, as well as for returning evaluated values when unwinding the stack. These are the four registers which are assigned actual processor registers when implementing the STG machine on x86.
- The STG stack
- Stores function arguments and continuations (i.e. the stack frames which are executed when a function returns)
- Grows downwards in memory
- The top of the stack is pointed to by the STG register Sp, and the maximum available stack pointer is stored in SpLim. There is no frame pointer.
Also see Rts/HaskellExecution/Registers.
We can look at MachRegs.h to see which architectural registers they map to.
Relevant excerpt for x86:
Ok, we've only got 6 general purpose registers, a frame pointer and a
stack pointer.  \tr{%eax} and \tr{%edx} are return values from C functions,
hence they get trashed across ccalls and are caller saves. \tr{%ebx},
\tr{%esi}, \tr{%edi}, \tr{%ebp} are all callee-saves.

Reg     STG-Reg
---------------
ebx     Base
ebp     Sp
esi     R1
edi     Hp
And for x86-64:
%rax          caller-saves, don't steal this one
%rbx          YES
%rcx          arg reg, caller-saves
%rdx          arg reg, caller-saves
%rsi          arg reg, caller-saves
%rdi          arg reg, caller-saves
%rbp          YES (our *prime* register)
%rsp          (unavailable - stack pointer)
%r8           arg reg, caller-saves
%r9           arg reg, caller-saves
%r10          caller-saves
%r11          caller-saves
%r12          YES
%r13          YES
%r14          YES
%r15          YES

%xmm0-7       arg regs, caller-saves
%xmm8-15      caller-saves

Use the caller-saves regs for Rn, because we don't always have to
save those (as opposed to Sp/Hp/SpLim etc. which always have to be
saved).
The Cost Center Stack
Before we attempt to traverse the more unusual and complicated STG stack used for actually evaluating expressions, let's look at the cost center stack (CCS) which GHC's profiling RTS maintains.
GHC's time profiler (+RTS -p) and its exception stack tracing (+RTS -xc) feature can show us conventional looking call stacks. This feature comes with with both time and space overhead, but it's probably in line with an unoptimized debug build of a C/C++ program. We can use this system to obtain better call stacks even in the case of a segfault. Now would be a good time to refresh your memory on GHC's profiling features (GHC Manual, Chapter 5 - Profiling) if you haven't looked at them in a while.
We'll start by recompiling our earlier crashing program with profiling (cabal configure --enable-executable-profiling or just -prof to GHC, also add -fprof-auto -caf-all to the ghc-prof-options field / pass them to GHC).
How do we get at the CCS when we're looking at a crashed program in gdb? Have a look at this excerpt from Regs.h:
/*
 * This is the table that holds shadow-locations for all the STG
 * registers.  The shadow locations are used when:
 *
 *     1) the particular register isn't mapped to a real machine
 *        register, probably because there's a shortage of real registers.
 *     2) caller-saves registers are saved across a CCall
 */
typedef struct {
  StgUnion        rR1;
  StgUnion        rR2;
  StgUnion        rR3;
  StgUnion        rR4;
  StgUnion        rR5;
  StgUnion        rR6;
  StgUnion        rR7;
  StgUnion        rR8;
  StgUnion        rR9;          /* used occasionally by heap/stack checks */
  StgUnion        rR10;         /* used occasionally by heap/stack checks */
  StgFloat        rF1;
  StgFloat        rF2;
  StgFloat        rF3;
  StgFloat        rF4;
  StgDouble       rD1;
  StgDouble       rD2;
  StgWord64       rL1;
  StgPtr          rSp;
  StgPtr          rSpLim;
  StgPtr          rHp;
  StgPtr          rHpLim;
  struct CostCentreStack_ * rCCCS;  /* current cost-centre-stack */
  struct StgTSO_ *     rCurrentTSO;
  struct nursery_ *    rNursery;
  struct bdescr_ *     rCurrentNursery; /* Hp/HpLim point into this block */
  struct bdescr_ *     rCurrentAlloc;   /* for allocation using allocate() */
  StgWord         rHpAlloc;     /* number of *bytes* being allocated in heap */
  StgWord         rRet;  /* holds the return code of the thread */
} StgRegTable;
This is the block of memory which BaseReg points at. From looking at MachRegs.h earlier we know this is ebx on x86 and r13 on x86-x64. It contains references to everything from the heap to the STG stack (through the TSO), but we're only interested in locating the CCS for now. We need to offset the base pointer so we're getting at the rCCCS field. If we're using the debug runtime we can directly use the structure above, but we might need to get by with an offset. To simplify this task, we can look at the special header DerivedConstants.h and find the offset constant we want:
#define OFFSET_StgRegTable_rCCCS 96If you can't find this header, it's because you're looking at a clean source tarball or repository. The header is generated when GHC is compiled to match the memory layout of the target architecture. Read SourceTree/Includes#DerivedConstants for details.
Assuming we found our header and offset, let's proceed with gdb:
(gdb) x/1a $ebx+96
0x21352c <MainCapability+108>:      0x6fc578
We now have a pointer to CostCentreStack. From CCS.h:
typedef struct CostCentreStack_ {
    StgInt ccsID;               // unique ID, allocated by the RTS

    CostCentre *cc;             // Cost centre at the top of the stack

    struct CostCentreStack_ *prevStack;   // parent
    struct IndexTable_      *indexTable;  // children
    struct CostCentreStack_ *root;        // root of stack
    StgWord    depth;           // number of items in the stack

    StgWord64  scc_count;       // Count of times this CCS is entered
                                // align 8 (Note [struct alignment])

    StgWord    selected;        // is this CCS shown in the heap
                                // profile? (zero if excluded via -hc
                                // -hm etc.)

    StgWord    time_ticks;      // number of time ticks accumulated by
                                // this CCS

    StgWord64  mem_alloc;       // mem allocated by this CCS
                                // align 8 (Note [struct alignment])

    StgWord64  inherited_alloc; // sum of mem_alloc over all children
                                // (calculated at the end)
                                // align 8 (Note [struct alignment])

    StgWord    inherited_ticks; // sum of time_ticks over all children
                                // (calculated at the end)
} CostCentreStack;
Lots of potentially interesting stuff, but we stay focussed and go one deeper, the pointer to ConstCentre:
typedef struct CostCentre_ {
    StgInt ccID;              // Unique Id, allocated by the RTS

    char * label;
    char * module;
    char * srcloc;

    // used for accumulating costs at the end of the run...
    StgWord64 mem_alloc;      // align 8 (Note [struct alignment])
    StgWord   time_ticks;

    StgInt is_caf;            // non-zero for a CAF cost centre

    struct CostCentre_ *link;
} CostCentre;
The label, module and srcloc members look just like what we need! Continuing where we left of with gdb, looking at ccsID and the actual top CostCentre pointer (cc from the CostCentreStack pointer we just got)
(gdb) x/2a 0x6fc578
0x6fc578:   0x71    0x2095d8 <Main_someFuncC_C0_cc>
Diving into ConstCentre, now looking at ccID, label, module, and srcloc
(gdb) x/4a 0x2095d8
0x2095d8 <Main_someFuncC_C0_cc>:    0x1     0x19f5a0 <c1zU_str>     0x19f5ac <c1zW_str>     0x19f5b4 <c1zY_str>
Printing out the latter three as C strings
(gdb) p (char *) 0x19f5a0
$3 = 0x19f5a0 "someFuncC"
(gdb) p (char *) 0x19f5ac
$4 = 0x19f5ac "Main"
(gdb) p (char *) 0x19f5b4
$5 = 0x19f5b4 "Main.hs:(25,1)-(27,39)"
Just what we wanted! We're now going up the stack one level, using CostCentreStack's prevStack pointer (8 bytes into the structure, as specified by #define OFFSET_CostCentreStack_prevStack 8)
(gdb) x 0x6fc578+8
0x6fc580:   0x6fc4d8
(gdb) x 0x6fc4d8+4
0x6fc4dc:   0x2095fc <Main_someFuncB_C1_cc>
(gdb) x/4a 0x2095fc
0x2095fc <Main_someFuncB_C1_cc>:    0x2     0x19f5cc <c1A0_str>     0x19f5d8 <c1A2_str>     0x19f5e0 <c1A4_str>
(gdb) p (char *) 0x19f5cc
$7 = 0x19f5cc "someFuncB"
(gdb) p (char *) 0x19f5d8
$8 = 0x19f5d8 "Main"
(gdb) p (char *) 0x19f5e0
$9 = 0x19f5e0 "Main.hs:(19,1)-(21,13)"
And one more
(gdb) x 0x6fc4d8+8
0x6fc4e0:   0x6fc398
(gdb) x 0x6fc398+4
0x6fc39c:   0x209644 <Main_main_C3_cc>
(gdb) x/4a 0x209644
0x209644 <Main_main_C3_cc>: 0x4     0x19f624 <c1Ac_str>     0x19f62c <c1Ae_str>     0x19f634 <c1Ag_str>
(gdb) p (char *) 0x19f624
$10 = 0x19f624 "main"
(gdb) p (char *) 0x19f62c
$11 = 0x19f62c "Main"
(gdb) p (char *) 0x19f634
$12 = 0x19f634 "Main.hs:(7,1)-(9,13)"
The prevStack pointer now points to 0x211b40 <CCS_MAIN>, we've reached the bottom. We now know the call stack was
Main.someFuncC   (Main.hs:(25,1)-(27,39))
  Main.someFuncB (Main.hs:(19,1)-(21,13))
    Main.main    (Main.hs:(7, 1)-(9, 13))
If someFuncC was very large, we could do a second run after sprinkling in a few {-# SCC ... #-} annotations (documentation for the SCC Pragma) to narrow down the location of the crash even further. Also note that we now got access to not only the stack, but all kinds of other RTS profiling data which could be scraped and displayed in realtime by an external tool.
From Haskell into C and back
One situation we're not addressing with the previous discussion of CCS inspection is how we deal with a crash inside of a Foreign Function Interface (FFI) call. We can debug C/C++ code called from Haskell as usual, but how do we get the Haskell part of the stack?
First, we'll modify the 'crash' test program by adding some C code.
crash.h:
#ifndef CRASH_H
#define CRASH_H

__attribute__((noinline)) void someCFuncA();
__attribute__((noinline)) void someCFuncB();

#endif // CRASH_Hcrash.c:
#include "crash.h"

void someCFuncA()
{
    someCFuncB();
    someCFuncB();
}

void someCFuncB()
{
    * (char *) 1 = 0;
}
Additions to crash.cabal
  c-sources:        crash.c
  cc-options:       -std=c99 -g -O3 -fno-omit-frame-pointer
(we want debug symbols and frame pointers)
Changes in Main.hs
    -- unsafeWrite v 1000000000 (0 :: Int) -- Crash (hopefully)
    c_someCFuncA

foreign import ccall unsafe "crash.h someCFuncA"
    c_someCFuncA :: IO ()
gdb correctly shows the C part of the call stack
$ gdb ./dist/build/crash/crash
GNU gdb 6.3.50-20050815 (Apple version gdb-1515) (Sat Jan 15 08:33:48 UTC 2011)
Copyright 2004 Free Software Foundation, Inc.
GDB is free software, covered by the GNU General Public License, and you are
welcome to change it and/or distribute copies of it under certain conditions.
Type "show copying" to see the conditions.
There is absolutely no warranty for GDB.  Type "show warranty" for details.
This GDB was configured as "x86_64-apple-darwin"...Reading symbols for shared libraries ... done

(gdb) r
Starting program: /Users/Tim/crash/dist/build/crash/crash
Reading symbols for shared libraries ++. done

Program received signal EXC_BAD_ACCESS, Could not access memory.
Reason: KERN_PROTECTION_FAILURE at address: 0x00000001
someCFuncB () at crash.c:24
24      * (char *) 1 = 0;
(gdb) bt
#0  someCFuncB () at crash.c:24
#1  0x0000278b in someCFuncA () at crash.c:18
#2  0x0000220e in s1Al_info ()
Previous frame inner to this frame (gdb could not unwind past this frame)
The debugger could be used to walk the C part of the stack, but we're going to use frame pointers to demonstrate the method.
(gdb) x/2a $ebp
0xbfffd6e8: 0xbfffd6f8      0x278b <someCFuncA+11>
The frame pointer gives us our first frame link and return address pointers, establishing the someCFuncA -> someCFuncB call order. Moving on:
(gdb) x/2a 0xbfffd6f8
0xbfffd6f8: 0x603cc8        0x220e <s1Al_info+38>
The next frame shows we're retuning back into Haskell code (s1Al_info). Since Haskell does not use frame pointers, the space of the pointer to the next stack frame is simply occupied by the Sp register, pointing to the top of Haskell's STG stack. A detailed look at the STG stack will follow, but for now all we need to know is that the closure on the top will have a layout like this:
typedef struct StgClosure_ {
    StgHeader   header;
    struct StgClosure_ *payload[FLEXIBLE_ARRAY];
} *StgClosurePtr; // StgClosure defined in Rts.h

typedef struct {
    const StgInfoTable* info;
#ifdef PROFILING
    StgProfHeader         prof;
#endif
} StgHeader;

typedef struct {
  CostCentreStack *ccs;
  union {
    struct _RetainerSet *rs;  /* Retainer Set */
    StgWord ldvw;             /* Lag/Drag/Void Word */
  } hp;
} StgProfHeader;
Basically, the second word on the stack will point us to the CCS. Here:
(gdb) x/2a 0x603cc8
0x603cc8:   0x21e8 <s1Al_info>      0x6fc578
And showing just enough of CostCentreStack to reveal the CostCentre pointer
(gdb) x/2a 0x6fc578
0x6fc578:   0x71    0x2095d8 <Main_someFuncC_C0_cc>
We found the CCS and the cost center for someFuncC, allowing us to proceed as before.
The STG stack
So far we've only been working with the CCS, which is not available unless we've compiled our program with profiling enabled. What can we learn from looking at Haskell's native STG stack?
Recall from our earlier discussion of registers (or read Rts/HaskellExecution/Registers again) that the virtual Sp register (ebp / rbp on x86 / x86-64) always points to the top of the stack. We can also use the BaseReg and get access to the current TSO, containing a pointer to the StgStack structure. In any case, we'll have a look with gdb:
(gdb) x/32a $ebp
0x503cd8:   0x1d94 <s1A7_info>      0x1e2c <s1A8_info>      0xefc6c <stg_catch_frame_info>  0x0
0x503ce8:   0x11bd82 <base_GHCziTopHandler_runIO2_closure+2>        0xf32d8 <stg_stop_thread_info>  0xf2f34 <stg_TSO_info>  0x11d79c <stg_END_TSO_QUEUE_closure>
0x503cf8:   0x5038f0        0x503930        0x1     0x0
0x503d08:   0x11d79c <stg_END_TSO_QUEUE_closure>    0x3     0x0     0x1
0x503d18:   0x300670        0x11e440 <MainCapability>       0x11d798 <stg_NO_TREC_closure>  0x11d79c <stg_END_TSO_QUEUE_closure>
0x503d28:   0x11d79c <stg_END_TSO_QUEUE_closure>    0xec    0xf321c <stg_MUT_ARR_PTRS_DIRTY_info>   0x41
0x503d38:   0x42    0x11c0d5 <base_DataziMaybe_Nothing_closure+1>   0x11c0d5 <base_DataziMaybe_Nothing_closure+1>   0x502fba
0x503d48:   0x11c0d5 <base_DataziMaybe_Nothing_closure+1>   0x11c0d5 <base_DataziMaybe_Nothing_closure+1>   0x11c0d5 <base_DataziMaybe_Nothing_closure+1>   0x11c0d5 <base_DataziMaybe_
The first 32 words of the stack (and what comes after it, perhaps)! How can we attempt to understand this further? There's a fair bit of material on the STG machine page on how C-- code uses the stack, but let's first look at an excerpt from the Rts/Storage/Stack page:
The stack consists of a sequence of stack frames (also sometimes called activation records) where each frame has the same layout as a heap object: Header Payload...
and
Stack frames therefore have bitmap layout.
Ok, moving on to the documentation on heap objects, i.e. Rts/Storage/HeapObjects:
All heap objects have the same basic layout, embodied by the type StgClosure in Closures.h.
/* All closures follow the generic format */

typedef struct StgClosure_ {
    StgHeader   header;
    struct StgClosure_ *payload[FLEXIBLE_ARRAY];
} *StgClosurePtr; // StgClosure defined in Rts.h
A heap object always begins with a header, defined by
StgHeaderin Closures.h
typedef struct {
    const StgInfoTable* info;
#ifdef PROFILING
    StgProfHeader         prof;
#endif
} StgHeader;
When looking at these structures, for now assume PROFILING, TICKY and DEBUG_CLOSURE to be undefined, while assuming TABLES_NEXT_TO_CODE to be defined. See the Rts/Config page for more details.
Also worth mentioning is the issue of pointer tagging, see Rts/HaskellExecution/PointerTagging. It shouldn't affect us much for our basic stack traversal, but it's important to know about when poking around further in GHC's heap.
Now we know that when we're looking at the top of our stack and see 0x1d94 <s1A7_info>, we actually have a pointer to an StgInfoTable, followed by a 'payload' array of closures. What are 'info tables' anyway? Have a quick look at Rts/Storage/HeapObjects#InfoTables and come back.
Let's look at the definitions, from InfoTables.h:
/*
 * The "standard" part of an info table.  Every info table has this bit.
 */
typedef struct StgInfoTable_ {

#if !defined(TABLES_NEXT_TO_CODE)
    StgFunPtr       entry;      /* pointer to the entry code */
#endif

#ifdef PROFILING
    StgProfInfo     prof;
#endif
#ifdef TICKY
  /* Ticky-specific stuff would go here. */
#endif
#ifdef DEBUG_CLOSURE
  /* Debug-specific stuff would go here. */
#endif

    StgClosureInfo  layout;     /* closure layout info (one word) */

    StgHalfWord     type;       /* closure type */
    StgHalfWord     srt_bitmap;
       /* In a CONSTR:
            - the constructor tag
          In a FUN/THUNK
            - a bitmap of SRT entries
       */

#ifdef TABLES_NEXT_TO_CODE
    StgCode         code[FLEXIBLE_ARRAY];
#endif
} *StgInfoTablePtr;
Info tables for stack frames / return addresses have a special layout, though. It is defined by StgRetInfoTable:
typedef struct {
#if defined(TABLES_NEXT_TO_CODE)
    OFFSET_FIELD(srt_offset);   /* offset to the SRT table */
    StgInfoTable i;
#else
    StgInfoTable i;
    StgSRT      *srt;   /* pointer to the SRT table */
#endif
} StgRetInfoTable;
Now, why does StgRetInfoTable prepend an additional field instead of append? It would seem more logical to tack it on at the end so we can first treat all info tables as an StgInfoTable, inspect the type field and then cast to the more specific structure and access additional fields. It has to do with TABLES_NEXT_TO_CODE (documented in Rts/Config and Rts/Storage/HeapObjects#TABLES_NEXT_TO_CODE). Have a look at this excerpt from ClosuresMacros.h:
/* -----------------------------------------------------------------------------
   Info tables are slammed up against the entry code, and the label
   for the info table is at the *end* of the table itself.  This
   inline function adjusts an info pointer to point to the beginning
   of the table, so we can use standard C structure indexing on it.

   Note: this works for SRT info tables as long as you don't want to
   access the SRT, since they are laid out the same with the SRT
   pointer as the first word in the table.

   NOTES ABOUT MANGLED C VS. MINI-INTERPRETER:

   A couple of definitions:

       "info pointer"    The first word of the closure.  Might point
                         to either the end or the beginning of the
                         info table, depending on whether we're using
                         the mini interpretter or not.  GET_INFO(c)
                         retrieves the info pointer of a closure.

       "info table"      The info table structure associated with a
                         closure.  This is always a pointer to the
                         beginning of the structure, so we can
                         use standard C structure indexing to pull out
                         the fields.  get_itbl(c) returns a pointer to
                         the info table for closure c.

   An address of the form xxxx_info points to the end of the info
   table or the beginning of the info table depending on whether we're
   mangling or not respectively.  So,

         c->header.info = xxx_info

   makes absolute sense, whether mangling or not.

   -------------------------------------------------------------------------- */
...
#ifdef TABLES_NEXT_TO_CODE
#define INFO_PTR_TO_STRUCT(info) ((StgInfoTable *)(info) - 1)
#define RET_INFO_PTR_TO_STRUCT(info) ((StgRetInfoTable *)(info) - 1)
...
#else
#define INFO_PTR_TO_STRUCT(info) ((StgInfoTable *)info)
#define RET_INFO_PTR_TO_STRUCT(info) ((StgRetInfoTable *)info)
...
#endif
Our pointer actually points to the closure's entry code (StgInfoTable.code), and the info table prepends it. We need to subtract the structure size from it. We can also see this in the gdb macros mentioned earlier:
define pinfo
p *((StgInfoTable *)$arg0-1)
end

define prinfo
p *((StgRetInfoTable *)$arg0-1)
end
GHC's runtime does 'append' the additional fields, it's just the definition of beginning and end that are reversed, like with top / bottom of the stack.
To go over the stack we need to know the payload size coming after the StgHeader. Remember that stack frames have bitmap layout (also please have a quick look at that). The StgClosureInfo structure from the info table tells us about the size of the payload:
/*
 * Stuff describing the closure layout.  Well, actually, it might
 * contain the selector index for a THUNK_SELECTOR.  This union is one
 * word long.
 */
typedef union {
    struct {                    /* Heap closure payload layout: */
        StgHalfWord ptrs;       /* number of pointers */
        StgHalfWord nptrs;      /* number of non-pointers */
    } payload;

    StgWord bitmap;               /* word-sized bit pattern describing */
                                  /*  a stack frame: see below */

#ifndef TABLES_NEXT_TO_CODE
    StgLargeBitmap* large_bitmap; /* pointer to large bitmap structure */
#else
    OFFSET_FIELD(large_bitmap_offset);  /* offset from info table to large bitmap structure */
#endif

    StgWord selector_offset;      /* used in THUNK_SELECTORs */

} StgClosureInfo;
The payload size can be extracted from the size bits from bitmap, preferably using the BITMAP_SIZE macro as the layout of the word changes between 32 / 64 bit. This will get us pretty far, but there are some closures on the stack that require special treatment. Fortunately, the RTS provides a convenient function taking care of it all. Looking at stack_frame_sizeW from ClosuresMacros.h:
/* -----------------------------------------------------------------------------
   Sizes of stack frames
   -------------------------------------------------------------------------- */

EXTERN_INLINE StgWord stack_frame_sizeW( StgClosure *frame );
EXTERN_INLINE StgWord stack_frame_sizeW( StgClosure *frame )
{
    StgRetInfoTable *info;

    info = get_ret_itbl(frame);
    switch (info->i.type) {

    case RET_DYN:
    {
        StgRetDyn *dyn = (StgRetDyn *)frame;
        return  sizeofW(StgRetDyn) + RET_DYN_BITMAP_SIZE +
            RET_DYN_NONPTR_REGS_SIZE +
            RET_DYN_PTRS(dyn->liveness) + RET_DYN_NONPTRS(dyn->liveness);
    }

    case RET_FUN:
        return sizeofW(StgRetFun) + ((StgRetFun *)frame)->size;

    case RET_BIG:
        return 1 + GET_LARGE_BITMAP(&info->i)->size;

    case RET_BCO:
        return 2 + BCO_BITMAP_SIZE((StgBCO *)((P_)frame)[1]);

    default:
        return 1 + BITMAP_SIZE(info->i.layout.bitmap);
    }
}
The W postfix means the function returns the size in words, not bytes.
How do we know when we reached the bottom of the stack? If we have access to the StgStack structure (i.e. from the TSO)
typedef struct StgStack_ {
    StgHeader header;
    StgWord32 stack_size;   // stack size in *words*
    StgWord32 dirty;        // non-zero => dirty
    StgPtr sp;              // current stack pointer
    StgWord stack[FLEXIBLE_ARRAY];
} StgStack;
it's rather obvious as we have the stack pointer, start and size of the current stack chunk. If not, we can look for a closure of type STOP_FRAME and use this as our bottom marker.
One last type of stack frame we need to discuss is the underflow frame. The STG stack is implemented as a linked-list of chunks (see Implement stack chunks and separate TSO/STACK objects and this post from the GHC blog). Here's the closure of type UNDERFLOW_FRAME from Closures.h:
typedef struct {
    const StgInfoTable* info;
    struct StgStack_ *next_chunk;
} StgUnderflowFrame;
The contained stack object tells us everything we need to know to continue traversing.
GHC already has some internal code for printing out various heap and stack objects, see Printer.h and Printer.c. With functions like printStackChunk and prettyPrintClosure its basically a cookbook for how to traverse and trace the contents of RTS objects.
All basic building blocks for traversing the STG stack are in place. It's still fairly difficult to extract useful information from it, but it's the best we have without a profiling RTS.
Automatic stack capture
The last remaining task is to write some code to automate the often tedious steps required to extract the call stack. There are at least three different ways we could go about this.
One approach would be to automate gdb through its scripting capabilities and machine interface. While this is certainly viable for debugging, it might be a bit slow for more frequent, performance sensitive extraction of call stack information (i.e. for a profiler).
Another implementation is installing a signal handler inside our program, catching the SIGBUS / SIGSEGV / etc. signals and performing the stack walk right there. This is complicated by the short list of functions which can be safely called from a signal handler. Given the nature of our signals, the heap might already be corrupted and any information retrieval difficult to carry out.
The method this document will actually describe is writing a minimal stand-alone debugger, inspecting the crashed process from the outside. A more complicated solution, but the most flexible and versatile one.
atos
Outside of gdb, we need a way for our program to translate addresses into symbol names. That gap will be filled by the OS X atos command line utility. With a live process, it can easily resolve any address.
Linux provides atos-like functionality through addr2line, Windows has the Sym* APIs from DbgHelp.
The atos communication, wrapping and parsing code will be handled by the ATOS_Pipe and SymbolManager classes from rsvp.
With those classes, getting the symbol name string for a program counter value is very simple:
symbol->SymbolIDToName(symbol->AddressToSymbolID(x86ts32.__eip))Inspecting another process
To apply the stack traversal and symbol resolution methods described, we need to have access to the memory, threads and registers of the debugged process. We also need to be notified once it segfaults. On Linux the ptrace call should be able to provide everything we need. Unfortunately, OS X has a rather gimped implementation of that API. See uninformed.org for a discussion of workarounds for OS X, and this Linux Journal article for an explanation of how it works on Linux.
Our usage of ptrace boils down to initiating the tracing relationship with the child like this
pid_t child = fork();
if (child == 0)
{
    // Let parent trace us
    ptrace(PT_TRACE_ME, 0, NULL, NULL);

    if (execv(argv[1], &argv[1]) == -1)
        assert("execl() failed, can't load child executable");
}
else
{
    DebugLoop();
    kill(child, SIGKILL);
}
and then letting the child continue every time we receive a signal from it (waitpid)
void PTraceContinue(pid_t pid)
{
    // Child process stopped after signalling us, let it proceed
    ptrace(PT_CONTINUE, pid, (caddr_t) 1, 0);
}
The DebugLoop function handling events from the child / target process is structured as follows
void DebugLoop(const TargetInfo& ti)
{
    while (true)
    {
        int status;
        waitpid(ti.m_pid, &status, 0);

        // Handle signal
        if (WIFEXITED(status))
            break;
        else if (WIFSIGNALED(status))
            break;
        else if (WIFSTOPPED(status))
        {
            const int sig = WSTOPSIG(status);
            switch (sig)
            {
                // Fault?
                case SIGSEGV:
                case SIGBUS:
                case SIGILL:
                case SIGFPE:
                case SIGSYS:
                    TraceProcessState(ti);
                    return;
                // Continue
                default:
                    PTraceContinue(ti.m_pid);
                    break;
            }
        }
    }
}
Mach
We'll need to replace some of the missing ptrace functionality through Mach kernel functions. Mach is the underlying kernel on which OS X implements its BSD / POSIX layer. Mach in OS X is somewhat sparsely documented, but see uninformed.org, developer.apple.com, Mach IPC Interface and Mac OS X Internals: A Systems Approach (a somewhat dated but still useful book). The Mach APIs can provide us with full access to the debugged process.
For Windows, similar functionality can be accessed through APIs like CreateRemoteThread, SuspendThread, GetThreadContext, ResumeThread and StackWalk64.
Mach crash course
A full Mach kernel API tutorial is out of scope for this document, but here are the bits we need for stack capture.
The Mach headers can be found in /usr/include/mach/ and subdirectories. Include like this
#include <mach/mach.h>
#include <mach/mach_vm.h> // for mach_vm_ instead of vm_
We need a port for the task to be debugged
task_for_pid(mach_task_self(), pid, &m_task_port);Obtain a list of threads from the target process
thread_act_port_array_t thread_list;
mach_msg_type_number_t thread_count;
task_threads(ti.m_task_port, &thread_list, &thread_count);
Query thread scheduling etc. information
thread_basic_info tbi;
mach_msg_type_number_t thread_info_count = THREAD_BASIC_INFO_COUNT;
thread_info(thread_list[thread_idx],
            THREAD_BASIC_INFO,
            (thread_info_t) &tbi,
            &thread_info_count);
Skip threads which were not running when we got the fault
if (tbi.flags & TH_FLAGS_SWAPPED)
    continue;
Query thread exception information (trap number, fault address etc.)
x86_exception_state32_t x86es32;
mach_msg_type_number_t exception_state_count32 = x86_EXCEPTION_STATE32_COUNT;
thread_get_state(thread_list[thread_idx],
                 x86_EXCEPTION_STATE32,
                 (thread_state_t) &x86es32,
                 &exception_state_count32);
Query thread registers (program counter, frame pointer, etc.)
x86_thread_state32_t x86ts32;
mach_msg_type_number_t thread_state_count32 = x86_THREAD_STATE32_COUNT;
thread_get_state(thread_list[thread_idx],
                 x86_THREAD_STATE32,
                 (thread_state_t) &x86ts32,
                 &thread_state_count32);
And finally, read memory from the target process
kern_return_t ReadMemory(mach_port_name_t task, target_ptr_t address, target_ptr_t size, void *out)
{
    mach_vm_size_t inout_size = size;
    kern_return_t ret = mach_vm_read_overwrite(
        task,
        address,
        inout_size,
        (mach_vm_address_t) (uintptr_t) out,
        &inout_size);
    if (ret != KERN_SUCCESS)
        return ret;
    if (inout_size != size)
        return KERN_FAILURE;
    return KERN_SUCCESS;
}
Other obstacles
How do we know if our target process is using a profiling RTS or not (CCS vs STG stack traversal)? We can't just call rts_isProfiled, but we can use nm to check for certain symbols, like this:
bool DoesSymbolExist(const char *executable, const char *symbol)
{
    // Use nm to check if a symbol exists
    char buf[1024];
    std::snprintf(buf, sizeof(buf), "nm %s | grep %s", executable, symbol);
    std::FILE *pipe = popen(buf, "r");
    assert(pipe != NULL);
    bool ret = std::fread(buf, 1, sizeof(buf), pipe) != 0;
    pclose(pipe);
    return ret;
}

bool IsProfilingRTS(const char *exe) { return DoesSymbolExist(exe, "_CCS_MAIN"      ); }

bool IsThreadedRTS (const char *exe) { return DoesSymbolExist(exe, "_createOSThread"); }
When our target process stops with a fault, how do we know if we're in Haskell or C etc. code? I don't really have a good answer for that, but this heuristic seems to work in pratice:
bool IsHaskellSymbol(
    const TargetInfo& ti,
    SymbolManager *symbol,
    uint32_t sym_id,
    uint16_t file_name_id)
{
    // Haskell functions don't have source file debug information
    if (std::strcmp(symbol->FileIDToName(file_name_id), symbol->GetUnresolvedSymbolName()) != 0)
        return false;
    // Assume that all Haskell functions come from our executable
    if (strcasecmp(symbol->SymbolIDToModule(sym_id), ti.m_module.c_str()) != 0)
        return false;
    // Assume that all Haskell functions have certain tokens in their name
    if (std::strstr(symbol->SymbolIDToName(sym_id), "_info") == NULL)
        return false;

    return true;
}
The Glorious Haskell Debugger v0.0.1 Pre-alpha
For the finale, here is a proof-of-concept implementation of everything we discussed so far. It is kinda cobbled together, has many limitations and missing features, but can serve as an example and starting point. With our discussion of stack traversal, the references given above for atos / ptrace and the Mach APIs, you will hopefully be able to follow along.
As with everything else so far, this is for OS X, GHC 7.6.3, 32bit. There's no support for the LLVM backend. The many hints for other platforms throughout this document should make porting fairly smooth, though.
The full source code is in the ghd folder.
Build with make. Run with sudo ghd ./myfaultyexecutable paramsformyfaultyexecutable.
Example stack traces
Let's look at a few examples of stack traces produced by ghd.
Our 'crash' program, error in Haskell code, profiling (CCS) enabled:
ghd: Debugging '../crash/dist/build/crash/crash', PID 50929
ghd: RTS - Threaded: Yes | Profiling: Yes
ghd: Received signal 'SIGTRAP - trace trap' from child, continuing
ghd: Child stopped on fault 'SIGSEGV - segmentation violation'
ghd: Attempting to run stack trace
ghd: ---------------
ghd: Thread 1 of 3
ghd: ---------------
ghd: Status - Waiting
ghd: ExceptionState - trapno: 14 (EXC_I386_PGFLT - page fault), err: 6, faultvaddr: 0xeecb89bc
ghd: Registers
ghd:   eax: 7325048, ebx: 2176268, ecx: 6316880, edx: 404, edi: 6314680, esi: 6316456, ebp: 0x603cc8
ghd:   esp: 0xbfffd81c, ss: 31, eflags: 66070, eip: 0x21ee <s1zZ_info>, cs: 23, ds: 31
ghd:   es: 31, fs: 0, gs: 55
ghd: Stack Trace
ghd:  0x21ee <s1zZ_info> [Haskell, switching to CCS]
ghd:   CCS:0x6fc578 <someFuncC> from Main (Main.hs:(25,1)-(27,39))
ghd:    CCS:0x6fc4d8 <someFuncB> from Main (Main.hs:(19,1)-(21,13))
ghd:     CCS:0x6fc398 <main> from Main (Main.hs:(7,1)-(9,13))
ghd:      CCS:0x211b60 <MAIN> from MAIN (<built-in>)
ghd: Stack trace done, exiting
Our 'crash' program, error in C code, profiling (CCS) enabled:
ghd: Debugging '../crash/dist/build/crash/crash', PID 50987
ghd: RTS - Threaded: Yes | Profiling: Yes
ghd: Received signal 'SIGTRAP - trace trap' from child, continuing
ghd: Child stopped on fault 'SIGBUS - bus error'
ghd: Attempting to run stack trace
ghd: ---------------
ghd: Thread 1 of 3
ghd: ---------------
ghd: Status - Waiting
ghd: ExceptionState - trapno: 14 (EXC_I386_PGFLT - page fault), err: 6, faultvaddr: 0x1
ghd: Registers
ghd:   eax: 6316476, ebx: 2176268, ecx: 100, edx: 404, edi: 6314680, esi: 6316456, ebp: 0xbfffd7f8
ghd:   esp: 0xbfffd7f8, ss: 31, eflags: 66182, eip: 0x2773 <someCFuncB>, cs: 23, ds: 31
ghd:   es: 31, fs: 0, gs: 55
ghd: Stack Trace
ghd:  0x2773 <someCFuncB> from crash (crash.c:12)
ghd:   0x278b <someCFuncA> from crash (crash.c:8)
ghd:    0x220e <s1Al_info> [Haskell, switching to CCS]
ghd:     CCS:0x6fc578 <someFuncC> from Main (Main.hs:(25,1)-(29,16))
ghd:      CCS:0x6fc4d8 <someFuncB> from Main (Main.hs:(19,1)-(21,13))
ghd:       CCS:0x6fc398 <main> from Main (Main.hs:(7,1)-(9,13))
ghd:        CCS:0x211b60 <MAIN> from MAIN (<built-in>)
ghd: Stack trace done, exiting
Our 'crash' program, error in C code, profiling (CCS) disabled:
ghd: Debugging '../crash/dist/build/crash/crash', PID 50779
ghd: RTS - Threaded: Yes | Profiling: No
ghd: Received signal 'SIGTRAP - trace trap' from child, continuing
ghd: Child stopped on fault 'SIGBUS - bus error'
ghd: Attempting to run stack trace
ghd: ---------------
ghd: Thread 1 of 2
ghd: ---------------
ghd: Status - Waiting
ghd: ExceptionState - trapno: 14 (EXC_I386_PGFLT - page fault), err: 6, faultvaddr: 0x1
ghd: Registers
ghd:   eax: 5267468, ebx: 1172556, ecx: 100, edx: 404, edi: 5263432, esi: 5267456, ebp: 0xbfffd7f8
ghd:   esp: 0xbfffd7f8, ss: 31, eflags: 66182, eip: 0x1f23 <someCFuncB>, cs: 23, ds: 31
ghd:   es: 31, fs: 0, gs: 55
ghd: Stack Trace
ghd:  0x1f23 <someCFuncB> from crash (crash.c:12)
ghd:   0x1f3b <someCFuncA> from crash (crash.c:8)
ghd:    0x1d90 <s1AP_info> [Haskell, switching to STG stack]
ghd:     0x503cd8 <s1AP_info> (RET_SMALL, 4b)
ghd:      0x503cdc <s1AQ_info> (RET_SMALL, 4b)
ghd:       0x503ce0 <stg_catch_frame_info> (CATCH_FRAME, 12b, <base_GHCziTopHandler_runIO2_info>)
ghd:        0x503cec <stg_stop_thread_info> (STOP_FRAME, 4b)
ghd: Stack trace done, exiting
Our 'crash' program, error in Haskell code, profiling (CCS) disabled:
ghd: Debugging '../crash/dist/build/crash/crash', PID 50828
ghd: RTS - Threaded: Yes | Profiling: No
ghd: Received signal 'SIGTRAP - trace trap' from child, continuing
ghd: Child stopped on fault 'SIGSEGV - segmentation violation'
ghd: Attempting to run stack trace
ghd: ---------------
ghd: Thread 1 of 2
ghd: ---------------
ghd: Status - Waiting
ghd: ExceptionState - trapno: 14 (EXC_I386_PGFLT - page fault), err: 6, faultvaddr: 0xeebb880c
ghd: Registers
ghd:   eax: 5267456, ebx: 1172556, ecx: 5267872, edx: 404, edi: 5263432, esi: 5267456, ebp: 0x503cd8
ghd:   esp: 0xbfffd81c, ss: 31, eflags: 66070, eip: 0x1d70 <s1Ax_info>, cs: 23, ds: 31
ghd:   es: 31, fs: 0, gs: 55
ghd: Stack Trace
ghd:  0x1d70 <s1Ax_info> [Haskell, switching to STG stack]
ghd:   0x503cd8 <s1Ax_info> (RET_SMALL, 4b)
ghd:    0x503cdc <s1Ay_info> (RET_SMALL, 4b)
ghd:     0x503ce0 <stg_catch_frame_info> (CATCH_FRAME, 12b, <base_GHCziTopHandler_runIO2_info>)
ghd:      0x503cec <stg_stop_thread_info> (STOP_FRAME, 4b)
ghd: Stack trace done, exiting
My Game of Life program, error in C++ code, profiling (CCS) disabled:
ghd: Debugging '/Users/Tim/haskell-gol/parallel-glfwb/src/out', PID 51007
ghd: RTS - Threaded: Yes | Profiling: No
ghd: Received signal 'SIGTRAP - trace trap' from child, continuing
ghd: Child stopped on fault 'SIGBUS - bus error'
ghd: Attempting to run stack trace
ghd: ---------------
ghd: Thread 3 of 7
ghd: ---------------
ghd: Status - Waiting
ghd: ExceptionState - trapno: 14 (EXC_I386_PGFLT - page fault), err: 6, faultvaddr: 0x1
ghd: Registers
ghd:   eax: 256, ebx: 16486418, ecx: 16486162, edx: 16416529, edi: 16485906, esi: 255, ebp: 0xb0100d78
ghd:   esp: 0xb0100d4c, ss: 31, eflags: 66118, eip: 0x3bb44 <step_grid_interior_segment()>, cs: 23, ds: 31
ghd:   es: 31, fs: 31, gs: 55
ghd: Stack Trace
ghd:  0x3bb44 <step_grid_interior_segment()> from out (gol.cpp:36)
ghd:   0x3bf3d <step_grid> from out (gol.cpp:111)
ghd:    0x365b3 <s10vm_info> [Haskell, switching to STG stack]
ghd:     0x15163400 <s10vm_info> (RET_SMALL, 36b)
ghd:      0x15163424 <stg_maskAsyncExceptionszh_ret_info> (RET_SMALL, 4b)
ghd:       0x15163428 <stg_catch_frame_info> (CATCH_FRAME, 12b, <sAuF_info>)
ghd:        0x15163434 <sAEY_info> (RET_SMALL, 12b)
ghd:         0x15163440 <stg_unmaskAsyncExceptionszh_ret_info> (RET_SMALL, 4b)
ghd:          0x15163444 <sAF0_info> (RET_SMALL, 52b)
ghd:           0x15163478 <sAGo_info> (RET_SMALL, 52b)
ghd:            0x151634ac <stg_catch_frame_info> (CATCH_FRAME, 12b, <base_GHCziConcziSync_forkIO2_info>)
ghd:             0x151634b8 <stg_stop_thread_info> (STOP_FRAME, 4b)
ghd: Stack trace done, exiting
My twitter client, error in Haskell code, profiling (CCS) enabled:
ghd: Debugging './jacky', PID 47395
ghd: RTS - Threaded: Yes | Profiling: Yes
ghd: Received signal 'SIGTRAP - trace trap' from child, continuing
ghd: Received signal 'SIGCHLD - child status has changed' from child, continuing
ghd: Child stopped on fault 'SIGBUS - bus error'
ghd: Attempting to run stack trace
ghd: ---------------
ghd: Thread 1 of 8
ghd: ---------------
ghd: Status - Waiting
ghd: ExceptionState - trapno: 14 (EXC_I386_PGFLT - page fault), err: 7, faultvaddr: 0x18435000
ghd: Registers
ghd:   eax: 400244736, ebx: 75534156, ecx: 1704960, edx: 435625360, edi: 71898364, esi: 71898149, ebp: 0x43edbd4
ghd:   esp: 0xbfffd93c, ss: 31, eflags: 66050, eip: 0x1ad4f01 <s1bQ_info>, cs: 23, ds: 31
ghd:   es: 31, fs: 0, gs: 55
ghd: Stack Trace
ghd:  0x1ad4f01 <s1bQ_info> [Haskell, switching to CCS]
ghd:   CCS:0x19f71d90 <drawQuad.uw> from QuadRendering (QuadRendering.hs:379:15-49)
ghd:    CCS:0x19f71b60 <drawQuad> from QuadRendering (QuadRendering.hs:(334,1)-(423,38))
ghd:     CCS:0x19f71480 <drawText.\> from FontRendering (FontRendering.hs:(192,83)-(211,57))
ghd:      CCS:0x46737d0 <drawText> from FontRendering (FontRendering.hs:(189,1)-(212,46))
ghd:       CCS:0x4673500 <text> from UI (UI.hs:(190,1)-(193,61))
ghd:        CCS:0x4673460 <frameAbsolute> from UI (UI.hs:141:1-51)
ghd:         CCS:0x4673370 <split> from UI (UI.hs:(110,1)-(113,28))
ghd:          CCS:0x437be50 <fontRenderingTest> from App (App.hs:(123,1)-(162,16))
ghd:           CCS:0x4682700 <layer> from UI (UI.hs:147:1-53)
ghd:            CCS:0x4682000 <runUI> from UI (UI.hs:(160,1)-(161,31))
ghd:             CCS:0x4678f90 <draw.\> from App (App.hs:(95,9)-(120,21))
ghd:              CCS:0x4678f40 <withQuadRenderBuffer.\.\.\> from QuadRendering (QuadRendering.hs:(181,23)-(191,40))
ghd:               CCS:0x4678ef0 <withQuadRenderBuffer.\.\> from QuadRendering (QuadRendering.hs:(180,30)-(191,40))
ghd:                CCS:0x4678e50 <withQuadRenderBuffer.\> from QuadRendering (QuadRendering.hs:(173,28)-(198,17))
ghd:                 CCS:0x4678db0 <withQuadRenderBuffer> from QuadRendering (QuadRendering.hs:(169,1)-(205,52))
ghd:                  CCS:0x4678770 <draw> from App (App.hs:(82,1)-(120,21))
ghd:                   CCS:0x467af60 <run.loop> from App (App.hs:(361,9)-(382,27))
ghd:                    CCS:0x441eef0 <run> from App (App.hs:(342,1)-(383,12))
ghd:                     CCS:0x441ee40 <main.\.\.\.\.\.\> from Main (Main.hs:(270,60)-(306,85))
ghd:                      CCS:0x441edf0 <withFontRenderer.\.\> from FontRendering (FontRendering.hs:(62,13)-(75,17))
ghd:                       CCS:0x441eda0 <withFontRenderer.\> from FontRendering (FontRendering.hs:(54,9)-(75,17))
ghd:                        CCS:0x441ed50 <withFontRenderer> from FontRendering (FontRendering.hs:(52,1)-(75,17))
ghd:                         CCS:0x441ed00 <main.\.\.\.\.\> from Main (Main.hs:(266,21)-(306,85))
ghd:                          CCS:0x441ecb0 <withQuadRenderer> from QuadRendering (QuadRendering.hs:(77,1)-(134,28))
ghd:                           CCS:0x441ec60 <main.\.\.\.\> from Main (Main.hs:(262,19)-(306,85))
ghd:                            CCS:0x441ec10 <withTextureCache.\> from TextureCache (TextureCache.hs:(63,9)-(77,13))
ghd:                             CCS:0x441ebc0 <withTextureCache> from TextureCache (TextureCache.hs:(49,1)-(77,13))
ghd:                              CCS:0x441eb70 <main.\.\.\> from Main (Main.hs:(253,17)-(306,85))
ghd:                               CCS:0x441eb20 <withWindow> from GLFWHelpers (GLFWHelpers.hs:(16,1)-(33,9))
ghd:                                CCS:0x441ead0 <main.\.\> from Main (Main.hs:(247,52)-(306,85))
ghd:                                 CCS:0x441ea80 <withImageCache.\> from ImageCache (ImageCache.hs:130:16-19)
ghd:                                  CCS:0x441ea30 <withImageCache> from ImageCache (ImageCache.hs:(93,1)-(130,20))
ghd:                                   CCS:0x441e9e0 <withProcessStatusesAsync> from Main (Main.hs:(121,1)-(152,17))
ghd:                                    CCS:0x441e990 <main.\.withProcessStatusesAsync'> from Main (Main.hs:(232,15)-(237,77))
ghd:                                     CCS:0x441e940 <main.\.withPSAsync> from Main (Main.hs:(219,15)-(231,36))
ghd:                                      CCS:0x441e700 <main.\> from Main (Main.hs:(216,31)-(306,85))
ghd:                                       CCS:0x44f5000 <main> from Main (Main.hs:(155,1)-(307,32))
ghd:                                        CCS:0x24426a0 <MAIN> from MAIN (<built-in>)
ghd: Stack trace done, exiting
Seems to work pretty well!
Profiling
How is what we've discussed so far related to profiling? A profiler often inspects a program in a similar way to a debugger. Sometimes, your debugger is the profiler. In case the term 'sampling profiler' is unclear, head over to Wikipedia.
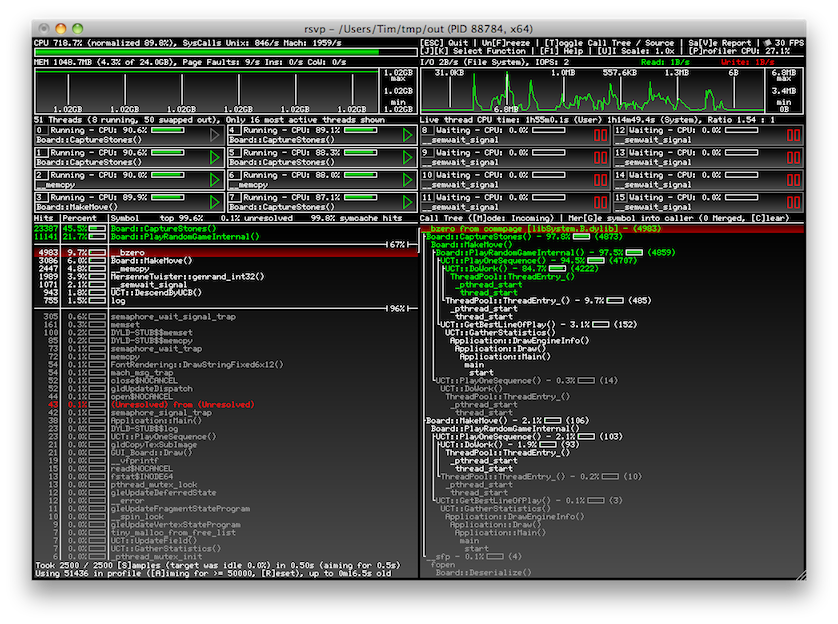
rsvp
I previously developed a realtime profiling tool called rsvp. It provides source level profiling with call tree analysis for C, C++ and Objective-C programs. It also monitors things like memory allocations, disk I/O and thread scheduling. The source and documentation might be worth a read if you want a working example of some of the things explained here.
You can get it here.
Unfortunately, it does not yet support GHC Haskell programs. The techniques described here should allow rsvp to apply its analysis to them, though. I haven't yet yet decided how to best approach this. Let me know if you have any suggestions or are simply interested in Haskell support for rsvp.
Conclusion
I hope this was useful, perhaps even a bit fun? Maybe you got inspired and will give a shot at developing your own tools and libraries working with GHC's stack and heap, perhaps even hack on GHC itself. Please contact me if you have any comments or spotted mistakes in this document.
Legal
This program is published under the MIT License.
Author
Developed by Tim C. Schroeder, visit my website to learn more.