All Projects → wcharczuk → Go Chart

wcharczuk / Go Chart

Licence: mit
go chart is a basic charting library in go.

Programming Languages

go
31211 projects - #10 most used programming language

Projects that are alternatives of or similar to Go Chart

Amcharts4
The most advanced amCharts charting library for JavaScript and TypeScript apps.
Stars: ✭ 907 (-72.13%)
Mutual labels:  svg, chart, charting-library
Perfect Freehand
Draw perfect pressure-sensitive freehand strokes.
Stars: ✭ 999 (-69.3%)
Mutual labels:  drawing, svg
Plottable
📊 A library of modular chart components built on D3
Stars: ✭ 2,834 (-12.91%)
Mutual labels:  chart, charting-library
Mocodo
Modélisation Conceptuelle de Données. Nickel. Ni souris.
Stars: ✭ 113 (-96.53%)
Mutual labels:  drawing, svg
Azure Design
Here you will find my complete Azure Visio Stencil and bonus SVG and PNG versions for all of the Azure Service and configuration items.
Stars: ✭ 470 (-85.56%)
Mutual labels:  drawing, svg
Macaw
Powerful and easy-to-use vector graphics Swift library with SVG support
Stars: ✭ 5,756 (+76.89%)
Mutual labels:  drawing, svg
Robopaint
The software for your friendly painting robot kit!
Stars: ✭ 105 (-96.77%)
Mutual labels:  drawing, svg
Chartist Js
Simple responsive charts
Stars: ✭ 12,731 (+291.24%)
Mutual labels:  svg, charting-library
Drawbot
Drawing robot capable of rendering SVG paths over WebSockets. Powered by a Raspberry Pi running Node.js.
Stars: ✭ 142 (-95.64%)
Mutual labels:  drawing, svg
Lazy Line Painter
Lazy Line Painter - A Modern JS library for SVG path animation
Stars: ✭ 1,918 (-41.06%)
Mutual labels:  drawing, svg
TeeChart-for-.NET-CSharp-WPF-samples
Assorted WPF examples
Stars: ✭ 18 (-99.45%)
Mutual labels:  chart, charting-library
Laue
🖖📈 Modern charts for Vue 2.0
Stars: ✭ 245 (-92.47%)
Mutual labels:  svg, chart
Charts
Simple, responsive, modern SVG Charts with zero dependencies
Stars: ✭ 14,112 (+333.68%)
Mutual labels:  svg, chart
Nn Svg
Publication-ready NN-architecture schematics.
Stars: ✭ 805 (-75.26%)
Mutual labels:  drawing, svg
Visx
🐯 visx | visualization components
Stars: ✭ 14,544 (+346.96%)
Mutual labels:  svg, chart
Maker.js
📐⚙ 2D vector line drawing and shape modeling for CNC and laser cutters.
Stars: ✭ 1,185 (-63.58%)
Mutual labels:  drawing, svg
HCLineChartView
HCLineChartView is a beautiful iOS library for drawing line charts. It is highly customizable and easy to use.
Stars: ✭ 22 (-99.32%)
Mutual labels:  chart, charting-library
Wechart
Create all the [ch]arts by cax or three.js - Cax 和 three.js 创造一切图[表]
Stars: ✭ 152 (-95.33%)
Mutual labels:  svg, chart
Picasso.js
A charting library streamlined for building interactive visualizations for the Qlik product suites.
Stars: ✭ 175 (-94.62%)
Mutual labels:  svg, chart
Pixelfarm
From Vectors to (sub) Pixels, C# 2D Rendering Library
Stars: ✭ 120 (-96.31%)
Mutual labels:  drawing, svg

go-chart

CircleCI Go Report Card

Package chart is a very simple golang native charting library that supports timeseries and continuous line charts.

Master should now be on the v3.x codebase, which overhauls the api significantly. Per usual, see examples for more information.

Installation

To install chart run the following:

> go get -u github.com/wcharczuk/go-chart

Most of the components are interchangeable so feel free to crib whatever you want.

Output Examples

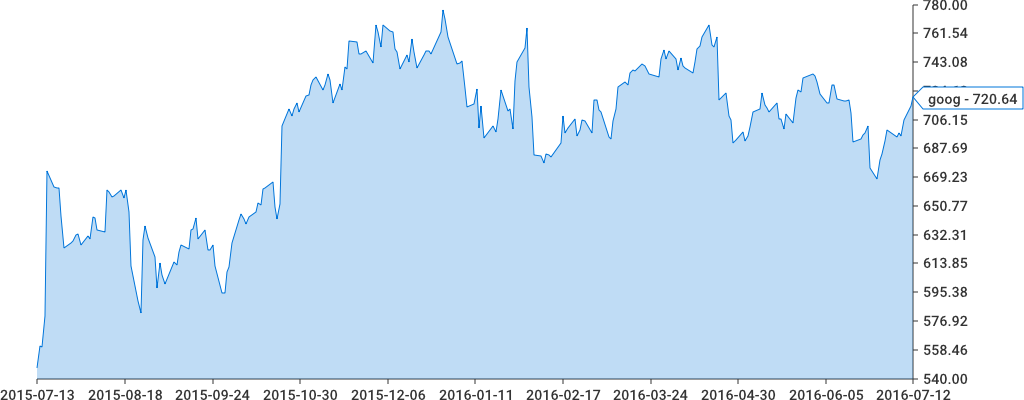
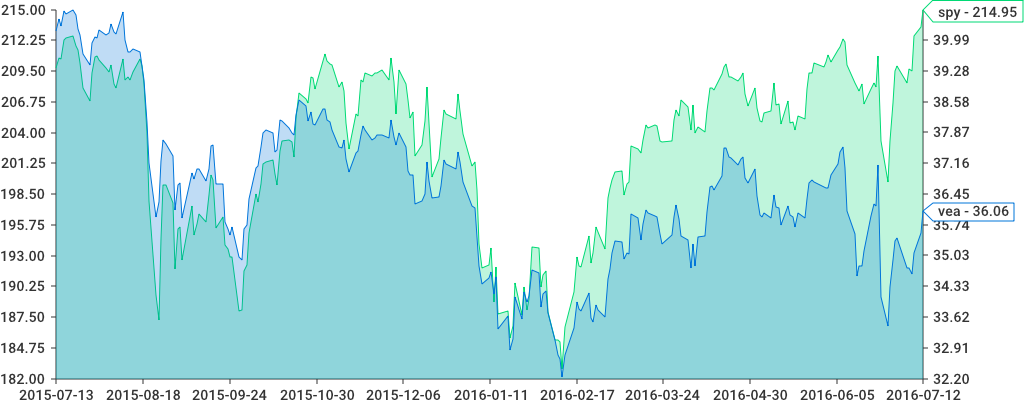
Spark Lines:

Single axis:

Two axis:

Other Chart Types

Pie Chart:

The code for this chart can be found in examples/pie_chart/main.go.

Stacked Bar:

The code for this chart can be found in examples/stacked_bar/main.go.

Code Examples

Actual chart configurations and examples can be found in the ./examples/ directory. They are simple CLI programs that write to output.png (they are also updated with go generate.

Usage

Everything starts with the chart.Chart object. The bare minimum to draw a chart would be the following:

import (
    ...
    "bytes"
    ...
    "github.com/wcharczuk/go-chart" //exposes "chart"
)

graph := chart.Chart{
    Series: []chart.Series{
        chart.ContinuousSeries{
            XValues: []float64{1.0, 2.0, 3.0, 4.0},
            YValues: []float64{1.0, 2.0, 3.0, 4.0},
        },
    },
}

buffer := bytes.NewBuffer([]byte{})
err := graph.Render(chart.PNG, buffer)

Explanation of the above: A chart can have many Series, a Series is a collection of things that need to be drawn according to the X range and the Y range(s).

Here, we have a single series with x range values as float64s, rendered to a PNG. Note; we can pass any type of io.Writer into Render(...), meaning that we can render the chart to a file or a resonse or anything else that implements io.Writer.

API Overview

Everything on the chart.Chart object has defaults that can be overriden. Whenever a developer sets a property on the chart object, it is to be assumed that value will be used instead of the default.

The best way to see the api in action is to look at the examples in the ./_examples/ directory.

Design Philosophy

I wanted to make a charting library that used only native golang, that could be stood up on a server (i.e. it had built in fonts).

The goal with the API itself is to have the "zero value be useful", and to require the user to not code more than they absolutely needed.

Contributions

Contributions are welcome though this library is in a holding pattern for the forseable future.

Note that the project description data, including the texts, logos, images, and/or trademarks, for each open source project belongs to its rightful owner. If you wish to add or remove any projects, please contact us at [email protected].