Go Recipes 🦩
Handy well-known and lesser-known tools for Go projects
Know some cool tool or one-liner? Have a feature request or an idea?
Feel free to edit this page or create an Issue/Discussion!
![]()
Contents
- Testing
➡ Make treemap of code coverage➡ Browse code coverage by file➡ Browse code coverage of Go code in terminal➡ Pretty print coverage of Go code in terminal➡ Make histogram of Go files per package➡ Run tests sequentially➡ Run tests in parallel➡ Detect goroutine leaks➡ Run tests with pretty output➡ Enrichgo testoutput➡ Get packages without tests
- Dependencies
➡ Get Go version of current module➡ Get Go versions of upstream modules➡ Get directly dependent modules that can be upgraded➡ Get upstream modules without Go version➡ Get available module versions➡ Make graph of upstream modules➡ Make graph of upstream modules withgmchart➡ Make graph of upstream packages➡ Scrape details about upstream modules and make graph➡ Scrape licenses of upstream dependencies➡ Explore upstream dependencies interactively➡ Usego moddirectives➡ Analyze dependencies withgoda
- Code Visualization
- Static Analysis
➡ Run default static analysis withgo vet➡ Run custom static analysis tool withgo vet➡ Run official static analyzers not included ingo vet➡ Rely on compiler for stricter Enums➡ Detect non-exhaustive switch and map withexhaustive➡ Detect unsafe code withgo-safer➡ Calculate cognitive complexity withgocognit➡ Calculate age of comments➡ Detect mixing pointer and value method receivers withsmrcptr➡ Check vertical function ordering withvertfn
- Code Generation
- Refactoring
- Errors
- Build
- Assembly
- Execution
- Monitoring
- Benchmarking
➡ Run benchmarks➡ Table-driven benchmarks➡ Generate benchmak CPU and Memory profiles➡ Visualize callgraph of profiles withpprof➡ Visualize flamegraphs of profiles withpprof➡ Visualize profiles online➡ Get delta between two benchmarks withbenchstat➡ Get summary of benchmarks withbenchstat➡ Continuous benchmarking➡ Continuous benchmarking withgobenchdata➡ Continuous benchmarking withbenchdiff➡ Continuous benchmarking withcob➡ Generate live traces usingnet/http/trace➡ Generate traces usinggo test➡ View traces withgo tool trace➡ Get wallclock traces➡ Get on/off CPU profiles
- Documentation
- Style Guide
Testing
⏫ ➡ Make treemap of code coverage
Visualize distribution of code coverage in your project. This helps to identify code areas with high and low coverage. Useful when you have large project with lots of files and packages. This 2D image-hash of your project should be more representative than a single number. Also available at https://go-cover-treemap.io. — @nikolaydubina
go test -coverprofile cover.out ./...
go-cover-treemap -coverprofile cover.out > out.svg

Requirements
go install github.com/nikolaydubina/go-cover-treemap@latest
⏫ ➡ Browse code coverage by file
This is very helpful tool from the official Go toolchain. Similar visualization is integrated into VSCode and Goland, but can be used separately.
go test -coverprofile cover.out ./...
go tool cover -html=cover.out

⏫ ➡ Browse code coverage of Go code in terminal
Interactively browse Go code coverage similarly to HTML provided by official Go toolchain, but in terminal. — @orlangure
go test -cover -coverprofile coverage.out
gocovsh
gocovsh --profile profile.out
git diff --name-only | gocovsh

Requirements
go install github.com/orlangure/gocovsh@latest
⏫ ➡ Pretty print coverage of Go code in terminal
It is similar to go tool cover -html=cover.out but in terminal. You can filter by functions, packages, minimum coverage, and more. — @nikandfor
cover

Requirements
go install github.com/nikandfor/cover@latest
⏫ ➡ Make histogram of Go files per package
Find when package is too big or too small. Adjust histogram length to maximum value.
go list -json ./... | jq -rc '[.ImportPath, (.GoFiles | length | tostring)] | join(" ")' | perl -lane 'print (" " x (20 - $F[1]), "=" x $F[1], " ", $F[1], "\t", $F[0])'
Example
  ================== 18	github.com/gin-gonic/gin
       ============= 13	github.com/gin-gonic/gin/binding
                   = 1	github.com/gin-gonic/gin/internal/bytesconv
                   = 1	github.com/gin-gonic/gin/internal/json
         =========== 11	github.com/gin-gonic/gin/render
Requirements
https://stedolan.github.io/jq/download/
⏫ ➡ Run tests sequentially
Use when you need to synchronize tests, for example in integration tests that share environment. Official documentation.
go test -p 1 -parallel 1 ./...
⏫ ➡ Run tests in parallel
Add t.Parallel to your tests case function bodies. As per documentation, by default -p=GOMAXPROCS and -parallel=GOMAXPROCS when you run go test. Different packages by default run in parallel, and tests within package can be enforced to run in parallel too. Make sure to copy test case data to new variable, why explained here. Official documentation.
    ...
    for _, tc := range tests {
        tc := tc
        t.Run(tc.name, func(t *testing.T) {
            t.Parallel()
            ...
⏫ ➡ Detect goroutine leaks
Refactored, tested variant of the goroutine leak detector found in both net/http tests and the cockroachdb source tree. You have to call this library in your tests. — @fortytw2 / https://github.com/fortytw2/leaktest
func TestPoolContext(t *testing.T) {
	ctx, cancel := context.WithTimeout(context.Background(), time.Second)
	defer cancel()
	defer leaktest.CheckContext(ctx, t)()

	go func() {
		for {
			time.Sleep(time.Second)
		}
	}()
}
⏫ ➡ Run tests with pretty output
This wrapper around go test renders test output in easy to read format. Also supports JUnit, JSON output, skipping slow tests, running custom binary. — @dnephin / https://github.com/gotestyourself/gotestsum
gotestsum --format dots

Requirements
go install gotest.tools/gotestsum@latest
⏫ ➡ Enrich go test output
Add colors and enrich go test output. It can be used in CI pipeline and has lots of options. — @kyoh86
richgo test ./...

Requirements
go install github.com/kyoh86/richgo@latest
⏫ ➡ Get packages without tests
If code coverage does not report packages without tests. For example for CI or quality control. — @nikolaydubina
go list -json ./... | jq -rc 'select((.TestGoFiles | length)==0) | .ImportPath'
Example
github.com/gin-gonic/gin/ginS
github.com/gin-gonic/gin/internal/json
Requirements
https://stedolan.github.io/jq/download/
Dependencies
⏫ ➡ Get Go version of current module
For example, setup correct Go version automatically from go.mod in CI.
go mod edit -json | jq -r .Go
Requirements
https://stedolan.github.io/jq/download/
⏫ ➡ Get Go versions of upstream modules
Use this when upgrading version of Go or finding old modules.
go list -deps -json ./... | jq -rc 'select(.Standard!=true and .Module.GoVersion!=null) | [.Module.GoVersion,.Module.Path] | join(" ")' | sort -V | uniq
Example
1.11 github.com/ugorji/go/codec
1.11 golang.org/x/crypto
1.12 github.com/golang/protobuf
Requirements
https://stedolan.github.io/jq/download/
⏫ ➡ Get directly dependent modules that can be upgraded
Keep your modules updated. Similar function is integrated in VSCode official Go plugin and GoLand.
go list -u -m $(go list -m -f '{{.Indirect}} {{.}}' all | grep '^false' | cut -d ' ' -f2) | grep '\['
Example
github.com/goccy/go-json v0.5.1 [v0.7.3]
github.com/golang/protobuf v1.3.3 [v1.5.2]
github.com/json-iterator/go v1.1.9 [v1.1.11]
⏫ ➡ Get upstream modules without Go version
Find outdated modules or imports that you need to upgrade.
go list -deps -json ./... | jq -rc 'select(.Standard!=true and .Module.GoVersion==null) | .Module.Path' | sort -u
Example
github.com/facebookgo/clock
golang.org/x/text
gopkg.in/yaml.v2
Requirements
https://stedolan.github.io/jq/download/
⏫ ➡ Get available module versions
This works even if you did not download or install module locally. This is useful to check to which version you can upgrade to, what is the latest version, and whether there are v2+ major versions recognized by Go toolchain.
go list -m -versions github.com/google/gofuzz
⏫ ➡ Make graph of upstream modules
For each module, the node representing the greatest version (i.e., the version chosen by Go's minimal version selection algorithm) is colored green. Other nodes, which aren't in the final build list, are colored grey. — official Go team
go mod graph | modgraphviz | dot -Tsvg -o mod-graph.svg

Requirements
https://graphviz.org/download/
go install golang.org/x/exp/cmd/modgraphviz@latest
⏫ ➡ Make graph of upstream modules with gmchart
Render in browser Go module graphs. Built with D3.js, Javascript, HTTP server in Go. — @PaulXu-cn
go mod graph | gmchart

Requirements
go install github.com/PaulXu-cn/go-mod-graph-chart/gmchart@latest
⏫ ➡ Make graph of upstream packages
Find unexpected dependencies or visualize project. Works best for small number of packages, for large projects use grep to narrow down subgraph. Without -deps only for current module. — @nikolaydubina
go list -deps -json ./... | jq -c 'select(.Standard!=true) | {from: .ImportPath, to: .Imports[]}' | jsonl-graph | dot -Tsvg > package-graph.svg

Requirements
https://stedolan.github.io/jq/download/
https://graphviz.org/download/
go install github.com/nikolaydubina/import-graph@latest
go install github.com/nikolaydubina/jsonl-graph@latest
⏫ ➡ Scrape details about upstream modules and make graph
Find low quality or unmaintained dependencies. — @nikolaydubina
go mod graph | import-graph -i=gomod | jsonl-graph -color-scheme=file://$PWD/basic.json | dot -Tsvg > output.svg

Requirements
https://graphviz.org/download/
go install github.com/nikolaydubina/import-graph@latest
go install github.com/nikolaydubina/jsonl-graph@latest
⏫ ➡ Scrape licenses of upstream dependencies
Collect all the licenses for checking if you can use the project, for example in proprietary or commercial environment. — Google
go-licenses csv github.com/gohugoio/hugo
Example
github.com/cli/safeexec,https://github.com/cli/safeexec/blob/master/LICENSE,BSD-2-Clause
github.com/bep/tmc,https://github.com/bep/tmc/blob/master/LICENSE,MIT
github.com/aws/aws-sdk-go,https://github.com/aws/aws-sdk-go/blob/master/LICENSE.txt,Apache-2.0
github.com/jmespath/go-jmespath,https://github.com/jmespath/go-jmespath/blob/master/LICENSE,Apache-2.0
github.com/gorilla/websocket,https://github.com/gorilla/websocket/blob/master/LICENSE,BSD-2-Clause
github.com/pelletier/go-toml/v2,https://github.com/pelletier/go-toml/blob/master/v2/LICENSE,MIT
github.com/spf13/cobra,https://github.com/spf13/cobra/blob/master/LICENSE.txt,Apache-2.0
github.com/kyokomi/emoji/v2,https://github.com/kyokomi/emoji/blob/master/v2/LICENSE,MIT
go.opencensus.io,Unknown,Apache-2.0
github.com/Azure/azure-storage-blob-go/azblob,https://github.com/Azure/azure-storage-blob-go/blob/master/azblob/LICENSE,MIT
github.com/yuin/goldmark-highlighting,https://github.com/yuin/goldmark-highlighting/blob/master/LICENSE,MIT
Requirements
go install github.com/google/go-licenses@latest
⏫ ➡ Explore upstream dependencies interactively
Useful in large refactorings, dependency breaking, physical layout changes. — Alan Donovan, official Go team

Requirements
go install github.com/adonovan/spaghetti@latest
⏫ ➡ Use go mod directives
Tell Go compiler which versions of upstreams to include in your build. Tell all users of your module how to deal with versions of your module.
// Deprecated: use example.com/mod/v2 instead.
module example.com/mod

go 1.16

require example.com/other/thing v1.0.2
require example.com/new/thing/v2 v2.3.4
exclude example.com/old/thing v1.2.3
replace example.com/bad/thing v1.4.5 => example.com/good/thing v1.4.5
retract [v1.9.0, v1.9.5]
⏫ ➡ Analyze dependencies with goda
This tool has extensive syntax for filtering dependencies graphs. It can work with packages and modules. — Egon Elbre
goda graph . | dot -Tsvg -o graph.svg
goda graph -cluster -short "github.com/nikolaydubina/go-cover-treemap:all" | dot -Tsvg -o graph.svg

Requirements
https://graphviz.org/download/
go install github.com/loov/goda@latest
Code Visualization
⏫ ➡ Make graph of function calls
Visualize complex or new project quickly or to study project. Requires main.go in module. Supports Graphviz output format. Has many options for filtering and formatting. — official Go team
callgraph -format graphviz . | dot -Tsvg -o graph.svg
recommend: grep <package/class/func of interest>
recommend: grep -v Error since many packages report error
recommend: adding `rankdir=LR;` to graphviz file for denser graph
recommend: you would have to manually fix graphviz file first and last line

Requirements
go install golang.org/x/tools/cmd/callgraph@latest
⏫ ➡ Make graph of function calls in package
Quickly track which packages current package is calling and why. — @ofabry
go-callvis .

Requirements
go install github.com/ofabry/go-callvis
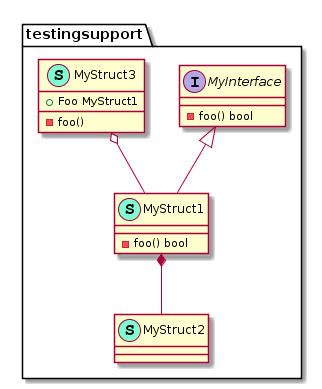
⏫ ➡ Make PlantUML diagram via goplantuml
Generates class diagram in widely used format with the information on structs, interfaces and their relationships. Render .puml files in for example planttext.com. — @jfeliu007
goplantuml -recursive path/to/gofiles path/to/gofiles2
Requirements
go get github.com/jfeliu007/goplantuml/parser
go install github.com/jfeliu007/goplantuml/cmd/goplantuml@latest
⏫ ➡ Make PlantUML diagram via go-plantuml
Automatically generate visualization of classes and interfaces for go packages. Recommend recursive option. Render .puml files in for example planttext.com. — @bykof
go-plantuml generate -d . -r -o graph.puml

Requirements
go install github.com/bykof/go-plantuml@latest
⏫ ➡ Make 3D chart of Go codebase
Fresh artistic perspective on Go codebase. GoCity is an implementation of the Code City metaphor for visualizing source code - folders are districts; files are buildings; structs are buildings on the top of their files. This project has research paper "GoCity Code City for Go" at SANER'19. Also available at go-city.github.io. — @rodrigo-brito

Requirements
go install github.com/rodrigo-brito/gocity@latest
Static Analysis
⏫ ➡ Run default static analysis with go vet
Official tool for static analysis of Go programs, with 27+ static analyzers. — official Go team
go vet ./...
⏫ ➡ Run custom static analysis tool with go vet
Standard go vet can be used to run custom analyzers binaries. Third party analyzers are supported. Lots of official analyzers not included by default into go vet. Analyzer has to satisfy interface and command described here https://pkg.go.dev/golang.org/x/tools/go/analysis. Refer for https://pkg.go.dev/golang.org/x/tools/go/analysis/passes for full list of official Go analyzers. — official Go team
go install golang.org/x/tools/go/analysis/passes/shadow/cmd/shadow
go vet -vettool=$(which shadow)
⏫ ➡ Run official static analyzers not included in go vet
There are many analyzers not included in go vet. These tools are experimental and may not work as expected (e.g. usesgenerics does not work). Refer to for full list https://pkg.go.dev/golang.org/x/tools/go/analysis. — official Go team
package main

import (
	"golang.org/x/tools/go/analysis/multichecker"

	"golang.org/x/tools/go/analysis/passes/atomicalign"
	"golang.org/x/tools/go/analysis/passes/deepequalerrors"
	"golang.org/x/tools/go/analysis/passes/fieldalignment"
	"golang.org/x/tools/go/analysis/passes/nilness"
	"golang.org/x/tools/go/analysis/passes/reflectvaluecompare"
	"golang.org/x/tools/go/analysis/passes/shadow"
	"golang.org/x/tools/go/analysis/passes/sortslice"
	"golang.org/x/tools/go/analysis/passes/unusedwrite"
	"golang.org/x/tools/go/analysis/passes/usesgenerics"
)

func main() {
	multichecker.Main(
		atomicalign.Analyzer,         // checks for non-64-bit-aligned arguments to sync/atomic functions
		deepequalerrors.Analyzer,     // checks for the use of reflect.DeepEqual with error values
		fieldalignment.Analyzer,      // detects structs that would use less memory if their fields were sorted
		nilness.Analyzer,             // inspects the control-flow graph of an SSA function and reports errors such as nil pointer dereferences and degenerate nil pointer comparisons
		reflectvaluecompare.Analyzer, // checks for accidentally using == or reflect.DeepEqual to compare reflect.Value values
		shadow.Analyzer,              // checks for shadowed variables
		sortslice.Analyzer,           // checks for calls to sort.Slice that do not use a slice type as first argument
		unusedwrite.Analyzer,         // checks for unused writes to the elements of a struct or array object
		usesgenerics.Analyzer,        // checks for usage of generic features added in Go 1.18
	)
}
⏫ ➡ Rely on compiler for stricter Enums
For compile time blocking of: accidental arithmetics; implicit cast of untyped constants; all operators except == and !=; — simply wrap into a struct in separate package and do not export field.
package color

type Color struct{ c uint }

var (
	Undefined = Color{}
	Red       = Color{1}
	Green     = Color{2}
	Blue      = Color{3}
)
⏫ ➡ Detect non-exhaustive switch and map with exhaustive
This go vet compatible analyzer checks for exhaustive switch statemnts and map literals. It works for enums with underyling integer, float, or string types (struct based enums are not supported). — @nishanths
exhaustive ./...
package token

type Token int

const (
	Add Token = iota
	Subtract
	Multiply
	Quotient
	Remainder
)

package calc

import "token"

func f(t token.Token) {
	switch t {
	case token.Add:
	case token.Subtract:
	case token.Multiply:
	default:
	}
}

func g(t token.Token) string {
	return map[token.Token]string{
		token.Add:      "add",
		token.Subtract: "subtract",
		token.Multiply: "multiply",
	}[t]
}
Example
calc.go:6:2: missing cases in switch of type token.Token: Quotient, Remainder
calc.go:15:9: missing map keys of type token.Token: Quotient, Remainder
Requirements
go install github.com/nishanths/exhaustive/cmd/exhaustive@latest
⏫ ➡ Detect unsafe code with go-safer
Find incorrect uses of reflect.SliceHeader, reflect.StringHeader, and unsafe casts between structs with architecture-sized fields. Reseach paper "Uncovering the Hidden Dangers Finding Unsafe Go Code in the Wild" presented at 19th IEEE International Conference on Trust, Security and Privacy in Computing and Communications (TrustCom 2020). — @jlauinger
go-safer ./...
Example
# github.com/jlauinger/go-safer/passes/sliceheader/testdata/src/bad/composite_literal
composite_literal/composite_literal.go:10:9: reflect header composite literal found
composite_literal/composite_literal.go:10:9: reflect header composite literal found
# github.com/jlauinger/go-safer/passes/sliceheader/testdata/src/bad/header_in_struct
header_in_struct/header_in_struct.go:16:2: assigning to reflect header object
header_in_struct/header_in_struct.go:16:2: assigning to reflect header object
header_in_struct/header_in_struct.go:17:2: assigning to reflect header object
header_in_struct/header_in_struct.go:17:2: assigning to reflect header object
Requirements
go install github.com/jlauinger/go-safer@latest
⏫ ➡ Calculate cognitive complexity with gocognit
Congitive Complexity as defined in this tool can be more illustrative than Cyclometric Complexity. Research paper "Cognitive Complexity - a new way of measuring understandability", 2021. — @uudashr
gocognit .
// Complexity Cyclomatic=4 Cognitive=7
// Cognitive complexity give higher score compare to cyclomatic complexity.
func SumOfPrimes(max int) int {         // +1
    var total int
    for i := 1; i < max; i++ {          // +1 (cognitive +1, nesting)
        for j := 2; j < i; j++ {        // +1 (cognitive +2, nesting)
            if i%j == 0 {               // +1
                continue OUT
            }
        }
        total += i
    }
    return total
}

// Complexity Cyclomatic=4 Cognitive=1
// Cognitive complexity give lower score compare to cyclomatic complexity.
func GetWords(number int) string {      // +1
    switch number {
        case 1:                         // +1 (cognitive 0)
            return "one"
        case 2:                         // +1 (cognitive 0)
            return "a couple"
        case 3:                         // +1 (cognitive 0)
             return "a few"
        default:
             return "lots"
    }
}
Example
$ go-binsize-treemap % gocognit .
21 main (BasicSymtabConverter).SymtabFileToTreemap basic_converter.go:23:1
12 symtab parseGoSymtabLine symtab/go_symtab_parser.go:37:1
11 main main main.go:30:1
8 symtab EqSymbolName symtab/symbol_name_parser.go:12:1
7 symtab ParseSymbolName symtab/symbol_name_parser.go:32:1
7 symtab Test_parseGoSymtabLine symtab/go_symtab_parser_private_test.go:5:1
4 symtab Test_ParseSymbolName symtab/symbol_name_parser_private_test.go:5:1
3 main updateNodeNamesWithByteSize main.go:99:1
3 main unique basic_converter.go:119:1
3 symtab (GoSymtabParser).ParseSymtab symtab/go_symtab_parser.go:14:1
2 fmtbytecount ByteCountIEC fmtbytecount/format_bytecount.go:3:1
Requirements
go install github.com/uudashr/gocognit/cmd/gocognit@latest
⏫ ➡ Calculate age of comments
This go vet compatible tool analyses AST and git and collects details on how far comments drift from code they describe. — @nikolaydubina
go-commentage -min-days-behind 360 ./...
Example
kubernetes/pkg/util/ipset/ipset.go:283:1: "CreateSet": doc_last_updated_behind_days(1336.83)
kubernetes/pkg/util/ipset/ipset.go:296:1: "createSet": doc_last_updated_behind_days(1603.17)
kubernetes/pkg/util/ipset/ipset.go:320:1: "AddEntry": doc_last_updated_behind_days(1578.10)
kubernetes/pkg/util/ipset/ipset.go:332:1: "DelEntry": doc_last_updated_behind_days(1578.10)
kubernetes/pkg/util/ipset/ipset.go:340:1: "TestEntry": doc_last_updated_behind_days(450.07)
Requirements
go install github.com/nikolaydubina/go-commentage@latest
⏫ ➡ Detect mixing pointer and value method receivers with smrcptr
This go vet compatible linter detects mixing pointer and value method receivers for the same type. — @nikolaydubina
smrcptr ./...
type Pancake struct{}

func NewPancake() Pancake { return Pancake{} }

func (s *Pancake) Fry() {}

func (s Pancake) Bake() {}
Example
smrcptr/internal/bakery/pancake.go:7:1: Pancake.Fry uses pointer
smrcptr/internal/bakery/pancake.go:9:1: Pancake.Bake uses value
Requirements
go install github.com/nikolaydubina/smrcptr@latest
⏫ ➡ Check vertical function ordering with vertfn
This go vet compatible linter reports when functions are declared before they are used, which is based on recommendation from 'Clean Code' by Robert.C.Martin. — @nikolaydubina
vertfn --verbose ./...

Requirements
go install github.com/nikolaydubina/vertfn@latest
Code Generation
⏫ ➡ Run go:generate in parallel
Official Go team encourages to run sequentially. However, in certain situations, such as lots of mocks, parallelization helps a lot, albeit, you should consider including your generated files in git. The solution bellow spawns multiple processes, each per pkg.
grep -rnw "go:generate" -E -l "${1:-*.go}" . | xargs -L1 dirname | sort -u | xargs -P 8 -I{} go generate {}
⏫ ➡ Generate String method for enum types
This is an official tool for generating String for enums. It supports overrides via comments. — official Go team
package painkiller

//go:generate stringer -type=Pill -linecomment

type Pill int

const (
	Placebo Pill = iota
	Ibuprofen
	Paracetamol
	PillAspirin   // Aspirin
	Acetaminophen = Paracetamol
)

// "Acetaminophen"
var s string = Acetaminophen.String()
Requirements
go install golang.org/x/tools/cmd/stringer@latest
Refactoring
⏫ ➡ Replace symbol
I found this in announcement notice of Go 1.18 for changes to interface{} to any. This can be useful for other refactorings too.
gofmt -w -r 'interface{} -> any' .
Errors
⏫ ➡ Pretty print panic messages
Read panic messages easier. Need to redirect STDERR to this tool with panic stack traces. The tool has HTML output and does lots of deduplication and enhancements. Refer to examples in original repo.
go test -v |& pp
Requirements
go install github.com/maruel/panicparse/v2/cmd/pp@latest
Build
⏫ ➡ Show compiler optimization decisions on heap and inlining
Building with -m flag will show decisions of compiler on inlining and heap escape. This can help you to validate your understanding of your code and optimize it.
go build -gcflags="-m -m" . 2>&1 | grep inline
Example
...
./passengerfp.go:25:6: cannot inline (*PassengerFeatureTransformer).Fit: function too complex: cost 496 exceeds budget 80
...
./passengerfp.go:192:6: can inline (*PassengerFeatureTransformer).NumFeatures with cost 35 as: method(*PassengerFeatureTransformer) func() int { if e == nil { return 0 }; count := 6; count += (*transformers.OneHotEncoder).NumFeatures(e.Sex); count += (*transformers.OneHotEncoder).NumFeatures(e.Embarked); return count }
...
./passengerfp.go:238:43: inlining call to transformers.(*OneHotEncoder).FeatureNames
./passengerfp.go:238:43: inlining call to transformers.(*OneHotEncoder).NumFeatures
...
./passengerfp.go:151:7: parameter e leaks to {heap} with derefs=0:
./passengerfp.go:43:11: make(map[string]uint) escapes to heap
⏫ ➡ Disable inlining
Usually you may not need it, but can reduce binary size and even improve performance.
go build -gcflags="-l" .
⏫ ➡ Aggressive inlining
Usually you may not need it, but can improve performance. This includes mid-stack inlining.
go build -gcflags="-l -l -l -l" .
⏫ ➡ Manually disable or enable cgo
Disable cgo with CGO_ENABLED=0 and enable with CGO_ENABLED=1. If you don't, cgo may end-up being enabled or code dynamically linked if, for example, you use some net or os packages. You may want to disable cgo to improve performance, since complier and runtime would have easier job optimizing code. This also should reduce your image size, as you can have alpine image with less shared libraries.
⏫ ➡ Include metadata in binary during compilation with ldflags
You can pass metadata through compiler to your binary. This is useful for including things like git commit, database schema version, integrity hashes. Variables can only be strings.
go build -v -ldflags="-X 'main.Version=v1.0.0'"
go build -v -ldflags="-X 'my/pkg/here.Variable=some-string'"
package main

var Version string

func main() {
	// Version here has some value
	...
}
⏫ ➡ Make treemap breakdown of Go executable binary
Useful for studying Go compiler, large projects, projects with C/C++ and cgo, 3rd party dependencies, embedding. However, total size may not be something to worry about for your executable. — @nikolaydubina
go tool nm -size <binary finename> | go-binsize-treemap > binsize.svg

Requirements
go install github.com/nikolaydubina/go-binsize-treemap@latest
Assembly
⏫ ➡ Get assembly of Go code snippets online
Use godbolt.org to compile and see assembly of short Go code. You can check different platforms and compilers including cgo. This tool is commonly used by C++ community. — @mattgodbolt

⏫ ➡ Get Go compiler SSA intermediary representation
Check what does Go compiler do. Might be useful if you trying to optimize some code or learn more about compiler. https://golang.design/gossa. — @changkun / https://github.com/golang-design/ssaplayground

⏫ ➡ View Go assembly interactively
Understand how Go is compiled better. — @egonelbre / https://github.com/loov/lensm

Requirements
go install loov.dev/lensm@main
⏫ ➡ Generate Go assembly in Go
Write better quality Go assembly quicker in Go language itself. This tool conveniently generates stub for Go code to call your generated assembly. Used by Go core. — @mmcloughlin / https://github.com/mmcloughlin/avo
//go:build ignore
// +build ignore

package main

import . "github.com/mmcloughlin/avo/build"

func main() {
	TEXT("Add", NOSPLIT, "func(x, y uint64) uint64")
	Doc("Add adds x and y.")
	x := Load(Param("x"), GP64())
	y := Load(Param("y"), GP64())
	ADDQ(x, y)
	Store(y, ReturnIndex(0))
	RET()
	Generate()
}
⏫ ➡ Generate AST for code snippets
Access Go core AST mechanism to generate AST.
package main

import (
	"go/ast"
	"go/parser"
	"go/token"
)

func main() {
	fs := token.NewFileSet()
	tr, _ := parser.ParseExpr("(3-1) * 5")
	ast.Print(fs, tr)
}
Example
     0  *ast.BinaryExpr {
     1  .  X: *ast.ParenExpr {
     2  .  .  Lparen: -
     3  .  .  X: *ast.BinaryExpr {
     4  .  .  .  X: *ast.BasicLit {
     5  .  .  .  .  ValuePos: -
     6  .  .  .  .  Kind: INT
     7  .  .  .  .  Value: "3"
     8  .  .  .  }
     9  .  .  .  OpPos: -
    10  .  .  .  Op: -
    11  .  .  .  Y: *ast.BasicLit {
    12  .  .  .  .  ValuePos: -
    13  .  .  .  .  Kind: INT
    14  .  .  .  .  Value: "1"
    15  .  .  .  }
    16  .  .  }
    17  .  .  Rparen: -
    18  .  }
    19  .  OpPos: -
    20  .  Op: *
    21  .  Y: *ast.BasicLit {
    22  .  .  ValuePos: -
    23  .  .  Kind: INT
    24  .  .  Value: "5"
    25  .  }
    26  }
Execution
⏫ ➡ Run Go function in shell
Run Go one-liners. This tool will print to stdout the return of a function call. — @natefinch
cat README.md | gorram crypto/sha1 Sum
echo 12345 | gorram encoding/base64 StdEncoding.EncodeToString
gorram net/http Get https://google.com
Requirements
go install github.com/natefinch/gorram@latest
⏫ ➡ Run simple fileserver
It takes one line to run HTTP file server in Go. Akin to famous oneliner in Python python3 -m http.server and python -m SimpleHTTPServer. Run this file as usually go run <filename>.
package main

import "net/http"

func main() { http.ListenAndServe(":9000", http.FileServer(http.Dir("."))) }
⏫ ➡ Monitor Go processes
Monitoring memory of Go processes, forcing GC, getting version of Go of processes. — Google
gops
Example
983   980    uplink-soecks  go1.9   /usr/local/bin/uplink-soecks
52697 52695  gops           go1.10  /Users/jbd/bin/gops
4132  4130   foops        * go1.9   /Users/jbd/bin/foops
51130 51128  gocode         go1.9.2 /Users/jbd/bin/gocode
Requirements
go install github.com/google/gops@latest
⏫ ➡ Create 3D visualization of concurrency traces
Fresh artistic perspective on coroutines execution. There is no advanced functions and it is hard to analyze production systems. However, it could be interesting for educational purposes. — @divan

Requirements
go install github.com/divan/gotrace@latest
patch Go compiler, available via Docker
more instructions in original repo
Monitoring
⏫ ➡ Auto-Instrument all functions with go-instrument
Automatically instrument all functions with Open Telemetry Spans by code generation. Inserts errors into Spans. — @nikolaydubina
find . -name "*.go" | xargs -I{} go-instrument -app my-service -w -filename {}

Requirements
go install github.com/nikolaydubina/go-instrument@latest
⏫ ➡ Auto-Instrument all functions with otelinji
Automatically instrument all functions with Open Telemetry Spans by code generation. Inserts errors into Spans. Supports custom templates and can be used for Open Tracing or any custom insertions. — @hedhyw
otelinji -w -filename input_file.go
otelinji -filename input_file.go > input_file.go
find . -name "*.go" | grep -v "vendor/\|.git/\|_test.go" | xargs -n 1 -t otelinji -w -filename

Requirements
go install github.com/hedhyw/otelinji/cmd/otelinji@latest
Benchmarking
⏫ ➡ Run benchmarks
Start here. This is the standard tool for benchmarking. It can also do advanced features like mutex profiles. More flags are in Go documentation and go help testflag.
go test -bench=. -benchmem -benchtime=10s ./...
Example
$ go test -bench=. -benchmem ./...
goos: darwin
goarch: arm64
pkg: github.com/nikolaydubina/fpmoney
BenchmarkArithmetic/add_x1-10                     1000000000             0.5 ns/op           0 B/op           0 allocs/op
BenchmarkArithmetic/add_x100-10                     18430124            64.6 ns/op           0 B/op           0 allocs/op
BenchmarkJSONUnmarshal/small-10                      3531835           340.7 ns/op         198 B/op           3 allocs/op
BenchmarkJSONUnmarshal/large-10                      2791712           426.9 ns/op         216 B/op           3 allocs/op
BenchmarkJSONMarshal/small-10                        4379685           274.4 ns/op         144 B/op           4 allocs/op
BenchmarkJSONMarshal/large-10                        3321205           345.8 ns/op         192 B/op           5 allocs/op
PASS
ok      github.com/nikolaydubina/fpmoney    62.744s
⏫ ➡ Table-driven benchmarks
Similar to tests, Go supports table-driven benchmarks, which is very helpful for fine gradation of meta-parameters. More details in the Go blog.
func benchIteratorSelector(b *testing.B, n int) {
	// ... setup here
	b.ResetTimer()
	for n := 0; n < b.N; n++ {
		err := myExpensiveFunc()
		if err != nil {
			b.Error(err)
		}
	}
}

func BenchmarkIteratorSelector(b *testing.B) {
	for _, q := range []int{100, 1000, 10000, 100000} {
		b.Run(fmt.Sprintf("n=%d", q), func(b *testing.B) {
			benchIteratorSelector(b, q)
		})
	}
}
Example
BenchmarkIteratorSelector/n=100-10    	  297792	      4265 ns/op	    5400 B/op	      13 allocs/op
BenchmarkIteratorSelector/n=1000-10   	   31400	     38182 ns/op	    9752 B/op	      16 allocs/op
BenchmarkIteratorSelector/n=10000-10  	    3134	    380777 ns/op	   89112 B/op	      24 allocs/op
BenchmarkIteratorSelector/n=100000-10 	     310	   3827292 ns/op	  912410 B/op	      32 allocs/op
⏫ ➡ Generate benchmak CPU and Memory profiles
This is useful for identifying most time or memory consuming parts. Recommended to run for single benchmark at a time and with -count or -benchtime for better accuracy.
go test -bench=<my-benchmark-name> -cpuprofile cpu.out -memprofile mem.out ./...
⏫ ➡ Visualize callgraph of profiles with pprof
Once you generate profiles, visualize them with pprof. Both memory and CPU profiles are supported. Many options are available. Refer to the link you get in SVG to how to interpret this graph. More official documentation blog, pkg-doc. — official Go team
go tool pprof -svg cpu.out > cpu.svg
go tool pprof -svg mem.out > mem.svg

⏫ ➡ Visualize flamegraphs of profiles with pprof
Latest versions of pprof can also render Flamegraphs for profiles. Make sure you set -http to start webserver. Then it is available in "View > Graph" in at http://0.0.0.0:80. — Google
pprof -http=0.0.0.0:80 cpu.out

Requirements
go install github.com/google/pprof@latest
⏫ ➡ Visualize profiles online
You can also visualize profiles with online tools are aloso available https://www.speedscope.app (cpu).

⏫ ➡ Get delta between two benchmarks with benchstat
This is standard way to compare two benchmark outputs. Names of benchmarks should be the same. Generate benchmarks as per usual. You would get multiple tables per dimension. If no output, then pass -split="XYZ". If you do not see delta, then pass -count=2 or more in benchmark generation. It is recommended to have alternative implementations in different packages, to keep benchmark names the same. — official Go team
benchstat -split="XYZ" old.txt new.txt
Example
name                    old time/op    new time/op    delta
JSONUnmarshal/small-10     502ns ± 0%     331ns ± 0%   -33.99%  (p=0.008 n=5+5)
JSONUnmarshal/large-10     572ns ± 0%     414ns ± 0%   -27.64%  (p=0.008 n=5+5)
JSONMarshal/small-10       189ns ± 0%     273ns ± 0%   +44.20%  (p=0.008 n=5+5)
JSONMarshal/large-10       176ns ± 0%     340ns ± 0%   +93.29%  (p=0.008 n=5+5)

name                    old alloc/op   new alloc/op   delta
JSONUnmarshal/small-10      271B ± 0%      198B ± 0%   -26.94%  (p=0.008 n=5+5)
JSONUnmarshal/large-10      312B ± 0%      216B ± 0%   -30.77%  (p=0.008 n=5+5)
JSONMarshal/small-10       66.0B ± 0%    144.0B ± 0%  +118.18%  (p=0.008 n=5+5)
JSONMarshal/large-10       72.0B ± 0%    192.0B ± 0%  +166.67%  (p=0.008 n=5+5)

name                    old allocs/op  new allocs/op  delta
JSONUnmarshal/small-10      6.00 ± 0%      3.00 ± 0%   -50.00%  (p=0.008 n=5+5)
JSONUnmarshal/large-10      7.00 ± 0%      3.00 ± 0%   -57.14%  (p=0.008 n=5+5)
JSONMarshal/small-10        2.00 ± 0%      4.00 ± 0%  +100.00%  (p=0.008 n=5+5)
JSONMarshal/large-10        2.00 ± 0%      5.00 ± 0%  +150.00%  (p=0.008 n=5+5)
Requirements
go install golang.org/x/perf/cmd/benchstat@latest
⏫ ➡ Get summary of benchmarks with benchstat
Compare multiple benchmarks. Names of benchmarks should be the same. Generate benchmarks as per usual. You would get multiple tables per dimension. If no output, then pass -split="XYZ". It is recommended to have alternative implementations in different packages, to keep benchmark names the same. — official Go team
benchstat -split="XYZ" int.txt float32.txt fpmoney.txt
Example
name \ time/op          int.bench   float32.bench  fpmoney.bench
JSONUnmarshal/small-10  481ns ± 2%     502ns ± 0%     331ns ± 0%
JSONUnmarshal/large-10  530ns ± 1%     572ns ± 0%     414ns ± 0%
JSONMarshal/small-10    140ns ± 1%     189ns ± 0%     273ns ± 0%
JSONMarshal/large-10    145ns ± 0%     176ns ± 0%     340ns ± 0%

name \ alloc/op         int.bench   float32.bench  fpmoney.bench
JSONUnmarshal/small-10   269B ± 0%      271B ± 0%      198B ± 0%
JSONUnmarshal/large-10   288B ± 0%      312B ± 0%      216B ± 0%
JSONMarshal/small-10    57.0B ± 0%     66.0B ± 0%    144.0B ± 0%
JSONMarshal/large-10    72.0B ± 0%     72.0B ± 0%    192.0B ± 0%

name \ allocs/op        int.bench   float32.bench  fpmoney.bench
JSONUnmarshal/small-10   6.00 ± 0%      6.00 ± 0%      3.00 ± 0%
JSONUnmarshal/large-10   7.00 ± 0%      7.00 ± 0%      3.00 ± 0%
JSONMarshal/small-10     2.00 ± 0%      2.00 ± 0%      4.00 ± 0%
JSONMarshal/large-10     2.00 ± 0%      2.00 ± 0%      5.00 ± 0%
Requirements
go install golang.org/x/perf/cmd/benchstat@latest
⏫ ➡ Continuous benchmarking
Track how benchmarks change in codebase over time. This is accomplished by running benchmarks for git commits, storing results, and visualizing difference. Running benchmarks can be in GitHub Actions or locally, storage can be in same repository master or dedicated branch, or standalone servers. It should be straightforward to setup this manually. Example of GitHub Action spec and blog from @vearutop, and an example on how it produces a PR comment.

⏫ ➡ Continuous benchmarking with gobenchdata
This tool uses go test -bench data in GitHub. It runs benchmarks, and uploads it as GitHub Pages for visualization. It is available as GitHub Action gobenchdata. This is useful to see benchmark trends. — @bobheadxi / https://github.com/bobheadxi/gobenchdata

Requirements
go install go.bobheadxi.dev/gobenchdata@latest
⏫ ➡ Continuous benchmarking with benchdiff
Automates comparing benchmarks with benchstat of two git references. It is available as GitHub Action benchdiff which runs benchstat of HEAD vs base branch. This is useful to see how benchmarks change with PRs in CI. — @WillAbides

Requirements
go install github.com/willabides/benchdiff/cmd/benchdiff
⏫ ➡ Continuous benchmarking with cob
Automate comparing benchmarks with benchstat between HEAD and HEAD^1. It can be used to block CI pipelines if benchmarks deteriorate. It reports output as text in CLI. This cane be useful in CI or in local development. — @knqyf263

Requirements
go install github.com/knqyf263/cob@latest
⏫ ➡ Generate live traces using net/http/trace
This will add endpoints to your your server. If you don't have server running already in your process, you can start one. Then you can point pprof tool to this data. For production, hide this endpoint in separate port and path. More details in documentation trace, net/http/pprof.
package main

import (
	"log"
	"net/http"
	"net/http/pprof"
)

func main() {
	mux := http.NewServeMux()
	mux.HandleFunc("/custom_debug_path/profile", pprof.Profile)
	log.Fatal(http.ListenAndServe(":7777", mux))
}
Example
go tool pprof http://localhost:6060/debug/pprof/heap
go tool pprof http://localhost:6060/debug/pprof/profile?seconds=30
curl -o trace.out http://localhost:6060/debug/pprof/trace?seconds=5
⏫ ➡ Generate traces using go test
Produce a trace of execution of tests in pacakge.
go test -trace trace.out .
⏫ ➡ View traces with go tool trace
You can view traces interactively in browser with standard Go tooling. This web tool also shows network blocking profile, synchronization blocking profile, syscall blocking profile, scheduler latency profile.
go tool trace trace.out

⏫ ➡ Get wallclock traces
This tool can be more illustrative of Go traces than standard Go traces. — @felixge / https://github.com/felixge/fgtrace
Example
package main

import (
	"net/http"

	"github.com/felixge/fgtrace"
)

func main() {
	http.DefaultServeMux.Handle("/debug/fgtrace", fgtrace.Config{})
	http.ListenAndServe(":1234", nil)
}
⏫ ➡ Get on/off CPU profiles
This tool can be more illustrative of Go profiles than standard Go profiling. — @felixge / https://github.com/felixge/fgprof
Example
package main

import (
	"log"
	"net/http"
	_ "net/http/pprof"

	"github.com/felixge/fgprof"
)

func main() {
	http.DefaultServeMux.Handle("/debug/fgprof", fgprof.Handler())
	go func() {
		log.Println(http.ListenAndServe(":6060", nil))
	}()

	// <code to profile>
}
Documentation
⏫ ➡ Make alternative documentation with golds
It has additional information like implementations of interface; promoted methods. The tool has nice minimalistic aesthetics. — Tapir Liu / https://github.com/go101/golds
golds ./...

Requirements
go install go101.org/golds@latest
⏫ ➡ Read Go binary documentation in man format
This tool fetches the repo's readme as a man page replacement. — @christophberger
goman <mypackage>

Requirements
go install github.com/appliedgocode/goman@lates
Style Guide
⏫ ➡ Google
https://google.github.io/styleguide/go.