All Projects → monitoringartist → Grafana Aws Cloudwatch Dashboards

monitoringartist / Grafana Aws Cloudwatch Dashboards

Licence: gpl-3.0
☁️ 30+ Grafana dashboards for AWS CloudWatch metrics: EC2, Lambda, S3, ELB, EMR, EBS, SNS, SES, SQS, RDS, EFS, ElastiCache, Billing, API Gateway, VPN, Step Functions, Route 53, CodeBuild, ...

Projects that are alternatives of or similar to Grafana Aws Cloudwatch Dashboards

Grafana Zabbix Dashboards
Grafana dashboards for Zabbix
Stars: ✭ 50 (-95.87%)
Mutual labels:  monitoring, devops, grafana, dashboard
Netdata
Real-time performance monitoring, done right! https://www.netdata.cloud
Stars: ✭ 57,056 (+4615.37%)
Mutual labels:  monitoring, devops, grafana, dashboard
Gatus
⛑ Gatus - Automated service health dashboard
Stars: ✭ 1,203 (-0.58%)
Mutual labels:  monitoring, devops, dashboard
Github Monitoring
Monitor your GitHub Repos with Docker & Prometheus
Stars: ✭ 163 (-86.53%)
Mutual labels:  monitoring, grafana, dashboard
Beam Dashboards
BEAM ❤️ Prometheus ❤️ Grafana
Stars: ✭ 244 (-79.83%)
Mutual labels:  monitoring, grafana, dashboard
Cloudprober
An active monitoring software to detect failures before your customers do.
Stars: ✭ 1,269 (+4.88%)
Mutual labels:  monitoring, devops, grafana
Spring Boot Actuator Demo
Spring Boot Actuator: Health Check, Metrics Gathering, Auditing, and Monitoring
Stars: ✭ 61 (-94.96%)
Mutual labels:  monitoring, grafana, dashboard
Grafana Dashboards
Grafana Dashboards
Stars: ✭ 228 (-81.16%)
Mutual labels:  monitoring, grafana, dashboard
Grafana
The open and composable observability and data visualization platform. Visualize metrics, logs, and traces from multiple sources like Prometheus, Loki, Elasticsearch, InfluxDB, Postgres and many more.
Stars: ✭ 45,930 (+3695.87%)
Mutual labels:  monitoring, grafana, dashboard
Iopipe Js Core
Observe and develop serverless apps with confidence on AWS Lambda with Tracing, Metrics, Profiling, Monitoring, and more.
Stars: ✭ 123 (-89.83%)
Mutual labels:  aws, monitoring, devops
Mist Ce
Mist is an open source, multi-cloud management platform
Stars: ✭ 1,391 (+14.96%)
Mutual labels:  aws, monitoring, devops
Swagger Stats
API Observability. Trace API calls and Monitor API performance, health and usage statistics in Node.js Microservices.
Stars: ✭ 559 (-53.8%)
Mutual labels:  monitoring, devops, grafana
Hastic Grafana App
Hastic data management server for labeling patterns and anomalies in Grafana
Stars: ✭ 166 (-86.28%)
Mutual labels:  monitoring, grafana, dashboard
Prometheus
Kubernetes Setup for Prometheus and Grafana
Stars: ✭ 824 (-31.9%)
Mutual labels:  monitoring, grafana, dashboard
Pgwatch2
PostgreSQL metrics monitor/dashboard
Stars: ✭ 960 (-20.66%)
Mutual labels:  monitoring, grafana, dashboard
Cfn Create Or Update
Create or update CloudFormation stack also if no updates are to be performed.
Stars: ✭ 59 (-95.12%)
Mutual labels:  aws, devops
Zabbix Docker Monitoring
🐳 Docker/Kubernetes/Mesos/Marathon/Chronos/LXC/LXD/Swarm container monitoring - Docker image, Zabbix template and C module
Stars: ✭ 1,098 (-9.26%)
Mutual labels:  monitoring, devops
Awless Templates
Repository of examples for awless templates (see https://github.com/wallix/awless)
Stars: ✭ 59 (-95.12%)
Mutual labels:  aws, devops
Reinvent2018 Dev303 Code
Code accompanying AWS re:Invent workshop DEV 303 showcasing how to get deep application insights using Amazon EKS with AWS X-Ray and Amazon CloudWatch.
Stars: ✭ 55 (-95.45%)
Mutual labels:  aws, grafana
Ansible Playbook
Ansible playbook to deploy distributed technologies
Stars: ✭ 61 (-94.96%)
Mutual labels:  aws, devops

Managed by Monitoring Artist: DevOps / Docker / Kubernetes / AWS ECS / Zabbix / Zenoss / Terraform / Monitoring

Grafana dashboards for AWS CloudWatch

Set of AWS Grafana dashboards published on grafana.com - 10M+ downloads.

Doc:

Feel free to create pull request for additional AWS resources/printscreens/...

Please set your dashboard variables (Region, ...) after dashboard import. Empty dashboard variables are reason of initial "Unable to call AWS API" or "Metric request error" error.

Import all Monitoring Artist AWS dashboards in one go (example script, bash/curl/jq required):

#!/bin/bash
jq --version >/dev/null 2>&1 || { echo >&2 "I require jq but it's not installed.  Aborting."; exit 1; }
### Please edit grafana_* variables to match your Grafana setup:
grafana_host="http://localhost:3000"
grafana_cred="admin:admin"
# Keep grafana_folder empty for adding the dashboards in "General" folder
grafana_folder="AWS CloudWatch"
ds=(1516 677 139 674 590 659 758 623 617 551 653 969 650 644 607 593 707 575 1519 581 584 2969 8050 11099 11154 11155 12979 13018 13040 13104 13892);
folderId=$(curl -s -k -u "$grafana_cred" $grafana_host/api/folders | jq -r --arg grafana_folder  "$grafana_folder" '.[] | select(.title==$grafana_folder).id')
if [ -z "$folderId" ] ; then echo "Didn't get folderId" ; else echo "Got folderId $folderId" ; fi
for d in "${ds[@]}"; do
  echo -n "Processing $d: "
  j=$(curl -s -k -u "$grafana_cred" $grafana_host/api/gnet/dashboards/$d | jq .json)
  payload="{\"dashboard\":$j,\"overwrite\":true"
  if [ ! -z "$folderId" ] ; then payload="${payload}, \"folderId\": $folderId }";  else payload="${payload} }" ; fi
  curl -s -k -u "$grafana_cred" -XPOST -H "Accept: application/json" \
    -H "Content-Type: application/json" \
    -d "$payload" \
    $grafana_host/api/dashboards/import; echo ""
done

Use AWS Policy Generator, which fits your needs. Example of minimal IAM role for Grafana (CloudWatch + EC2 metrics):

{
    "Version": "2012-10-17",
    "Statement": [
        {
            "Sid": "AllowReadingMetricsFromCloudWatch",
            "Effect": "Allow",
            "Action": [
                "cloudwatch:DescribeAlarmsForMetric",
                "cloudwatch:DescribeAlarmHistory",
                "cloudwatch:DescribeAlarms",
                "cloudwatch:ListMetrics",
                "cloudwatch:GetMetricStatistics",
                "cloudwatch:GetMetricData"
            ],
            "Resource": "*"
        },
        {
            "Sid": "AllowReadingTagsInstancesRegionsFromEC2",
            "Effect": "Allow",
            "Action": [
                "ec2:DescribeTags",
                "ec2:DescribeInstances",
                "ec2:DescribeRegions"
            ],
            "Resource": "*"
        },
        {
            "Sid": "AllowReadingResourcesForTags",
            "Effect" : "Allow",
            "Action" : "tag:GetResources",
            "Resource" : "*"
        }
    ]
}

You can also install this project as a Jsonnet library with jsonnet-bundler:

$ jb install github.com/monitoringartist/grafana-aws-cloudwatch-dashboards
$ cat > aws-cloudwatch-dashboards.jsonnet <<EOF
local awsCloudWatch = import 'github.com/monitoringartist/grafana-aws-cloudwatch-dashboards/dashboards.libsonnet';

awsCloudWatch.grafanaDashboards
EOF
$ jsonnet -J vendor aws-cloudwatch-dashboards.jsonnet

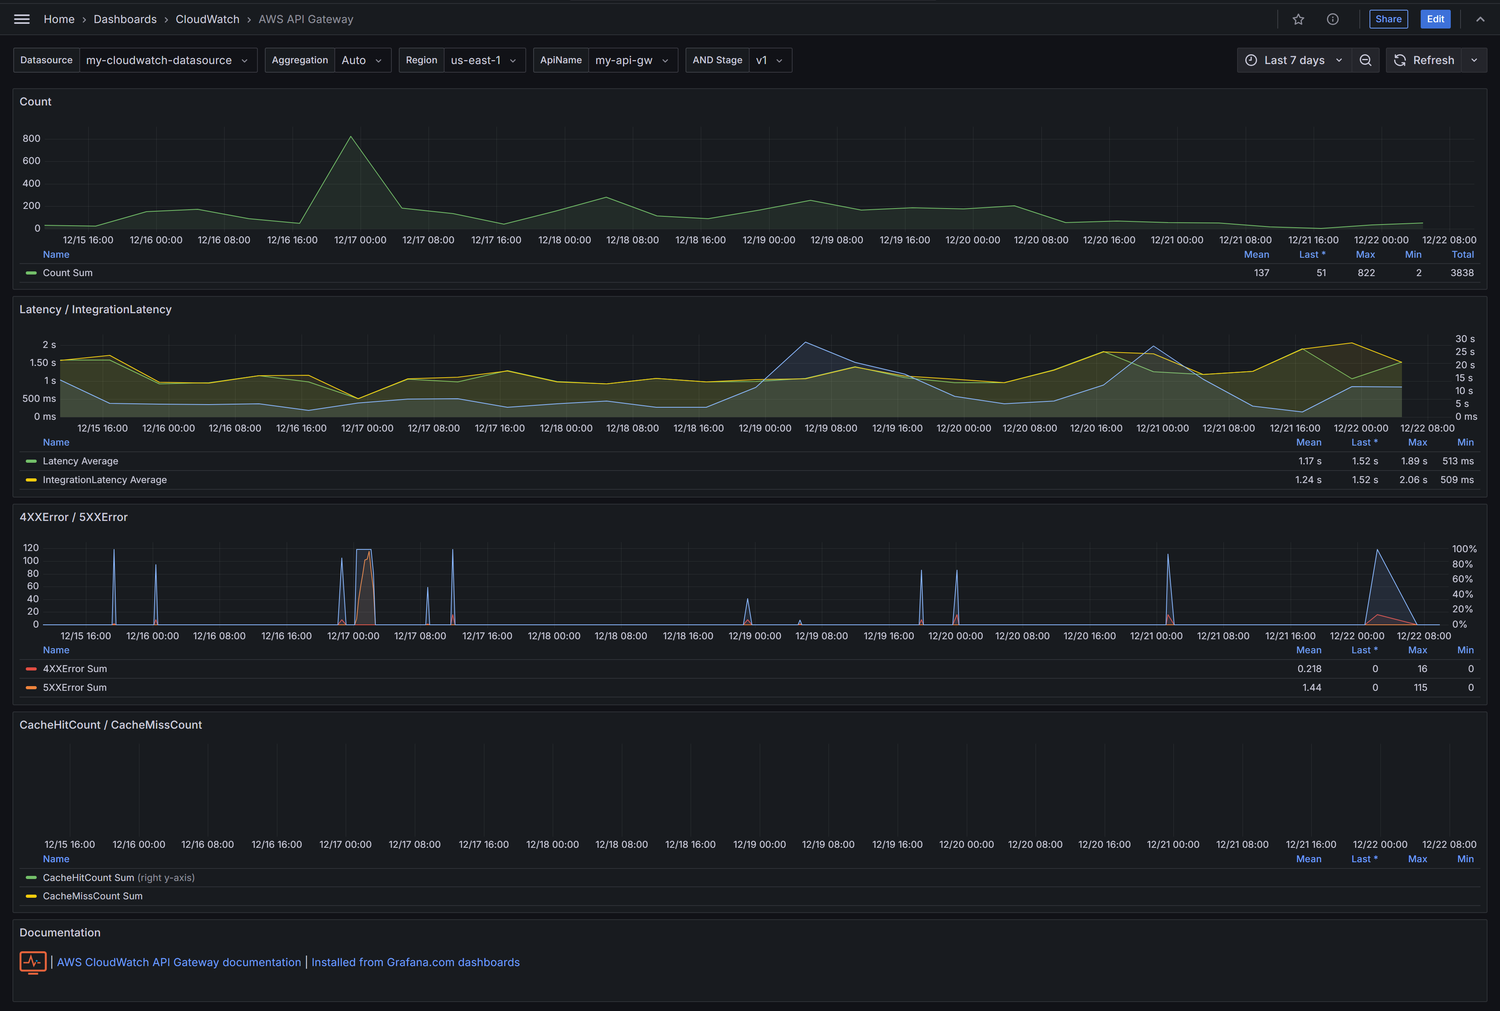
AWS API Gateway

AWS API Gateway

AWS Auto Scaling

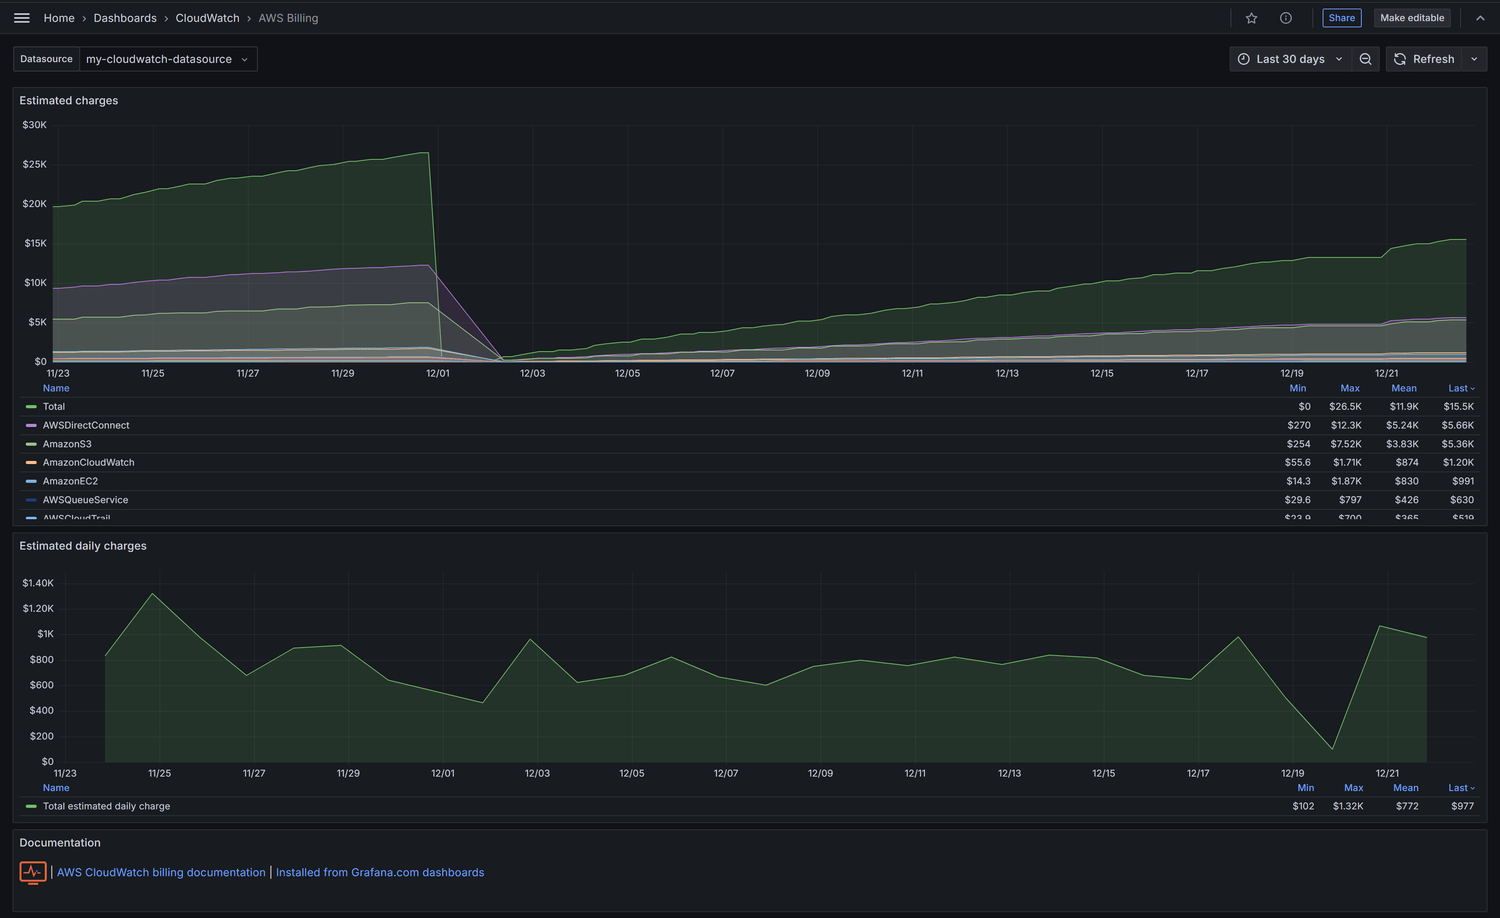
AWS Billing

AWS Billing

AWS CloudFront

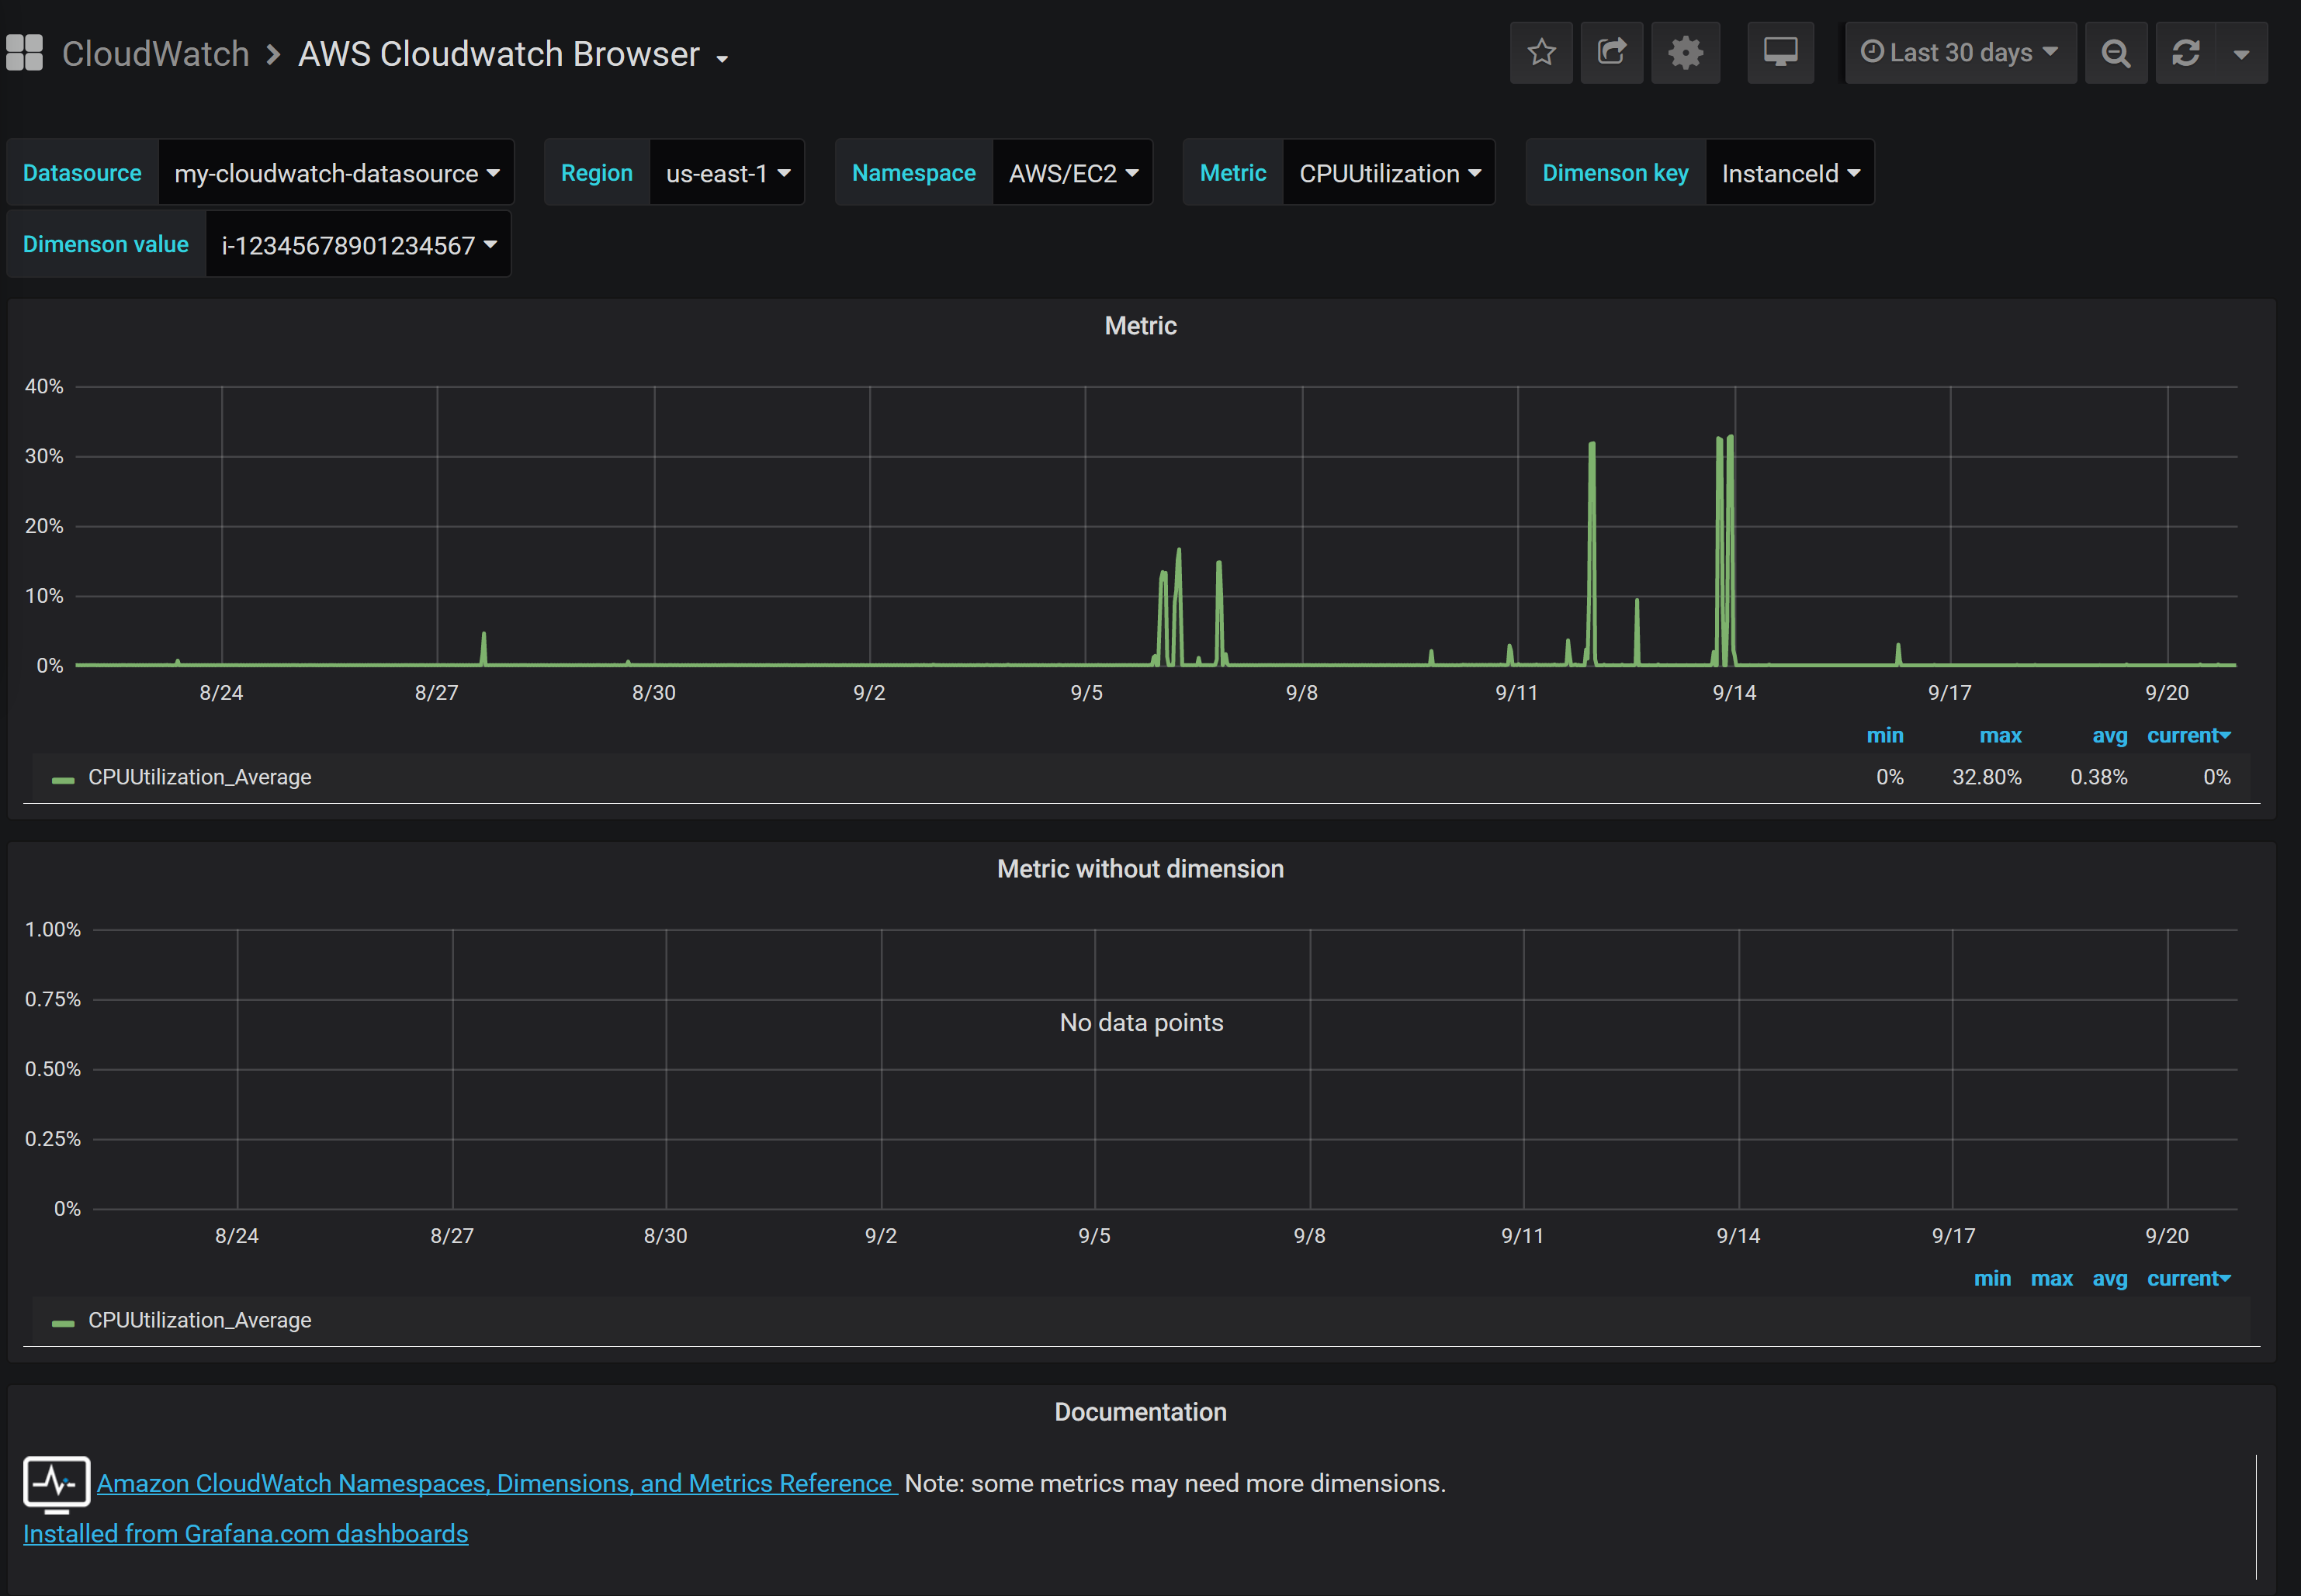
AWS CloudWatch Browser

AWS Cloudwatch Browser

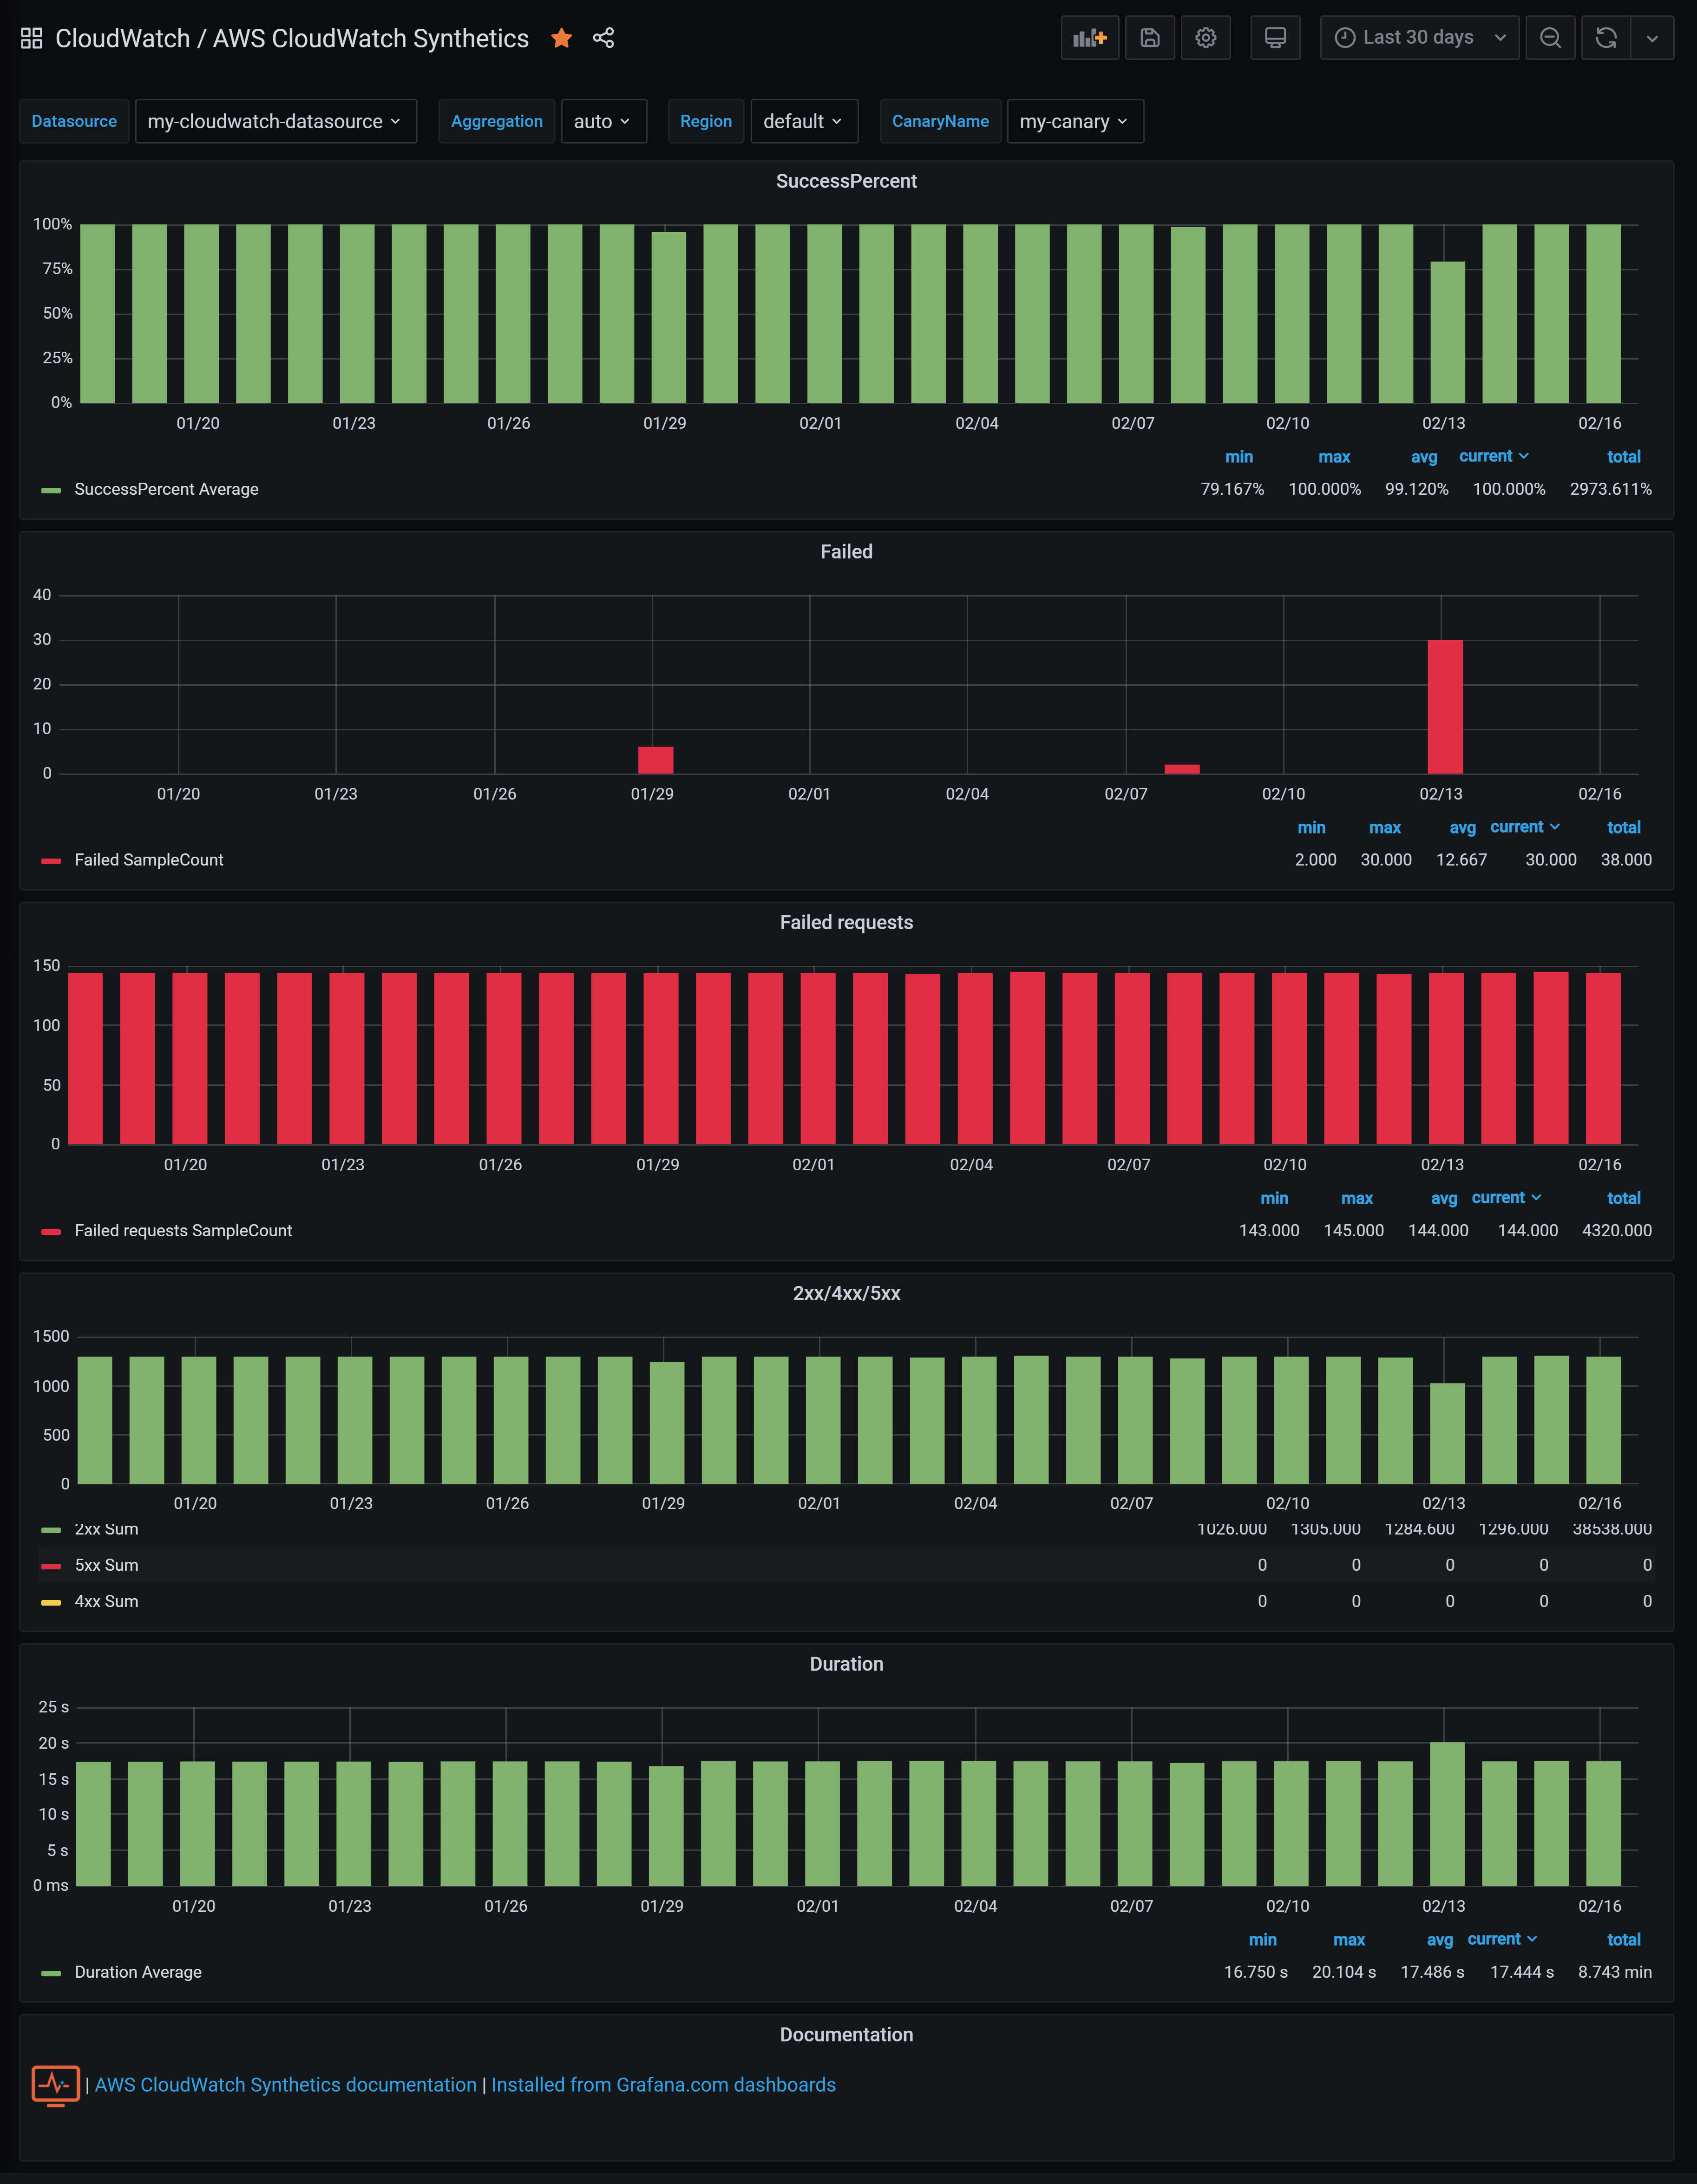
AWS CloudWatch Synthetics

AWS Cloudwatch Synthetics

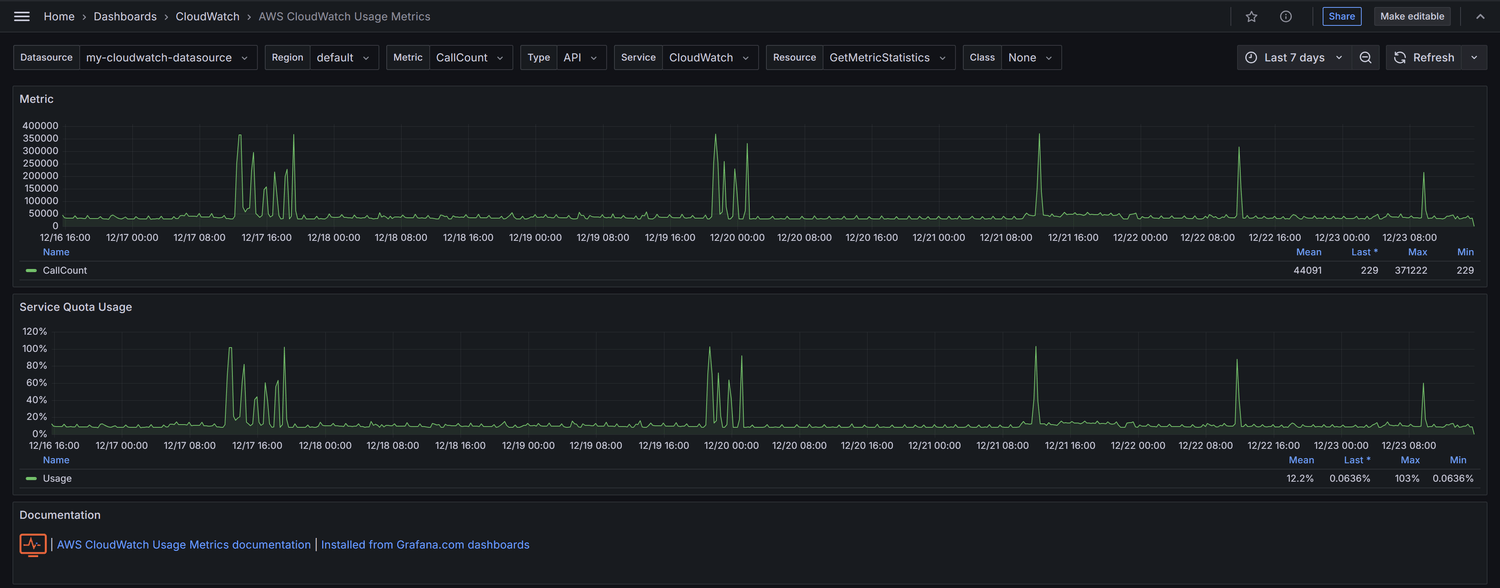
AWS CloudWatch Usage Metrics

AWS Cloudwatch Browser

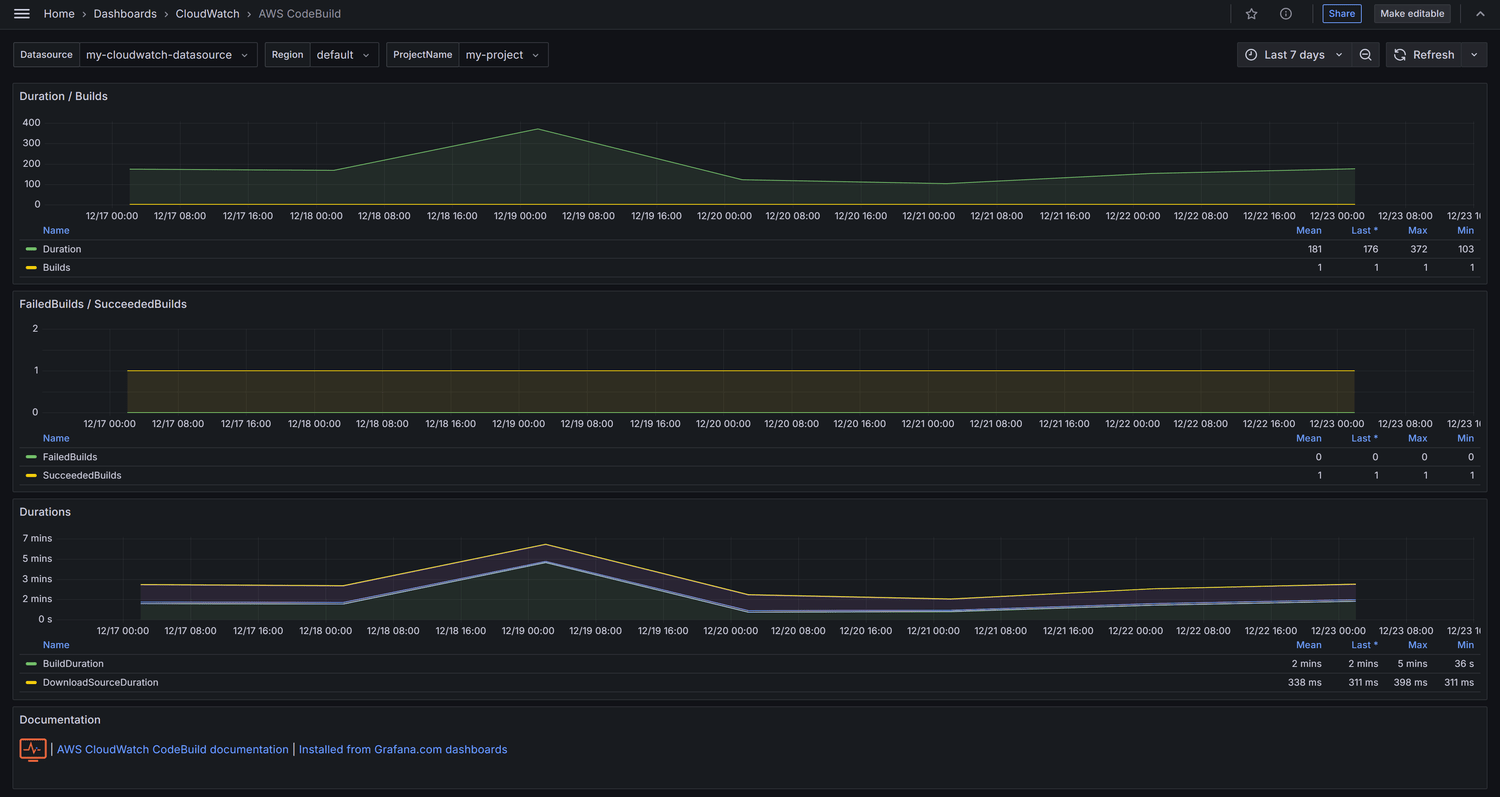
AWS CodeBuild

AWS CodeBuild

AWS Cognito

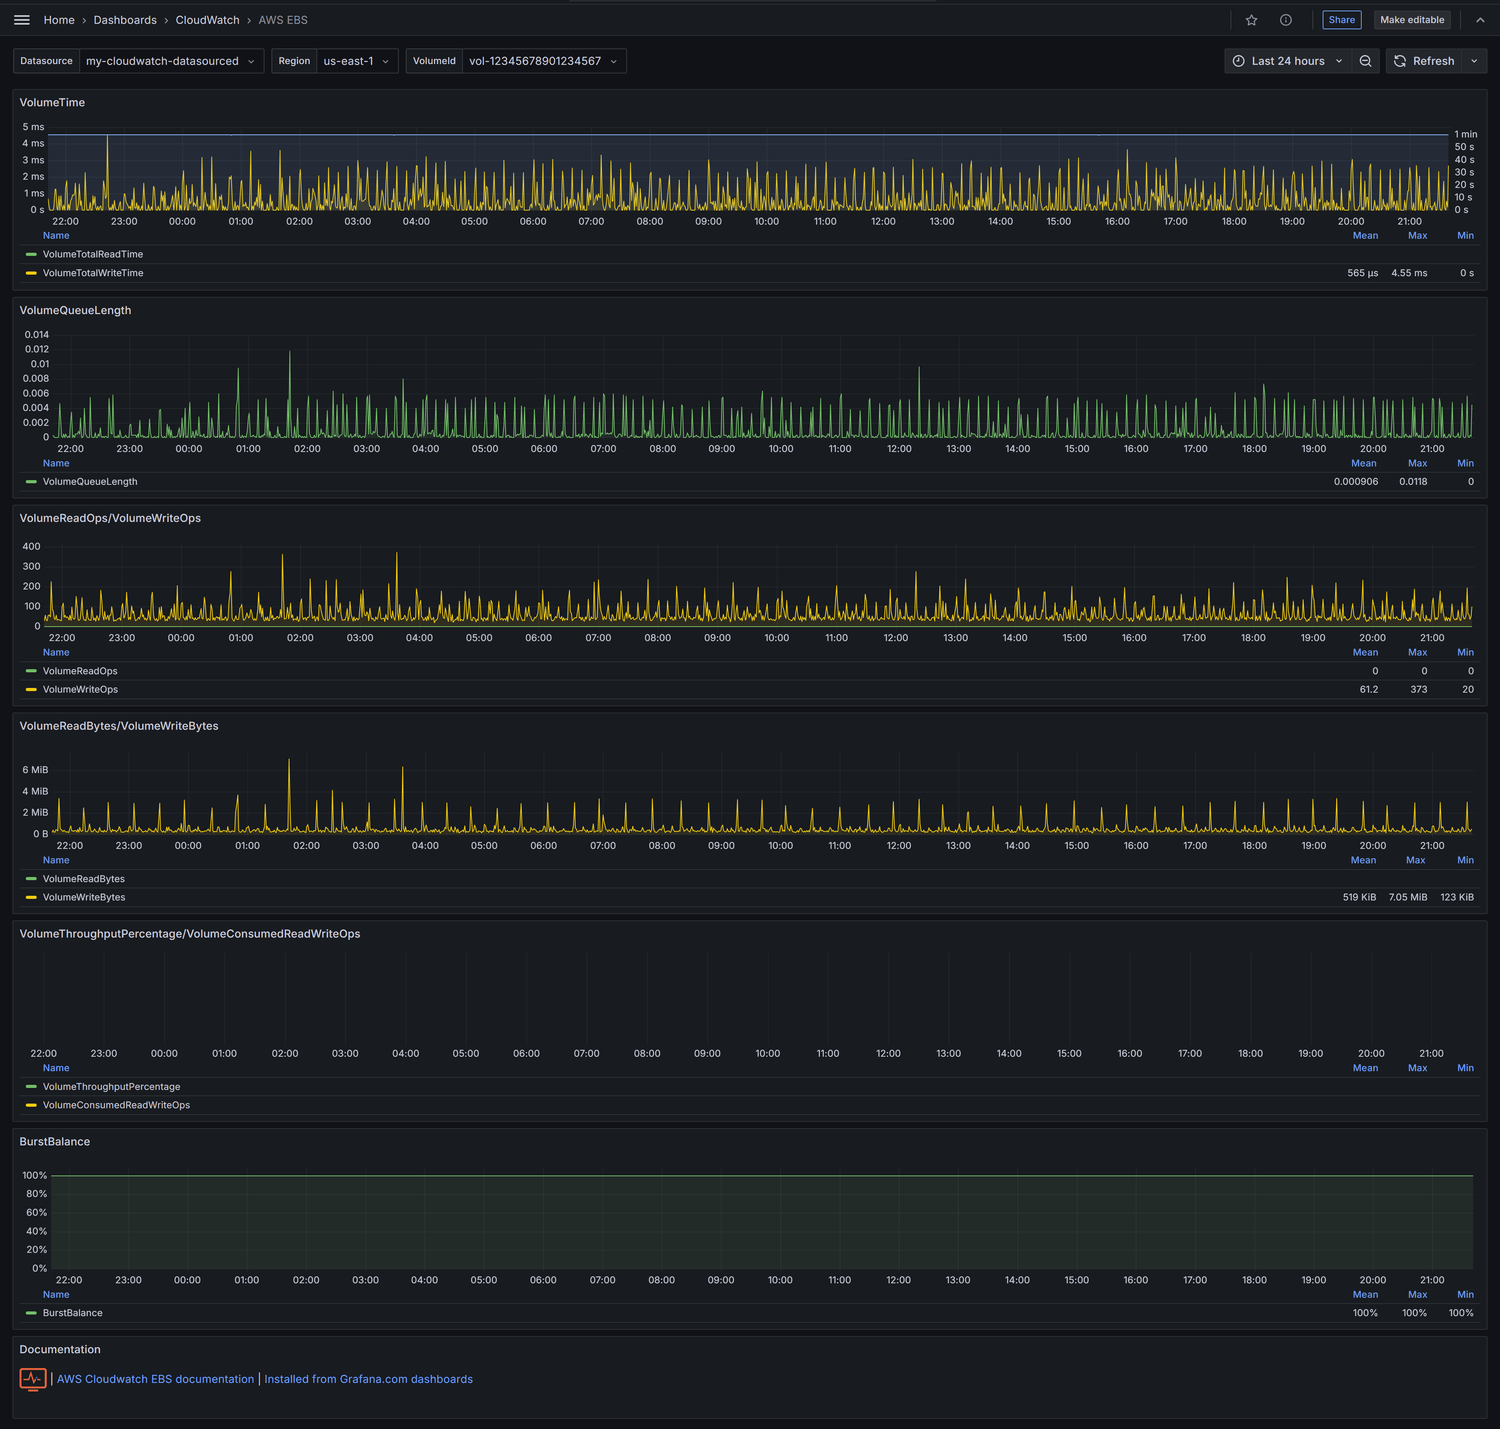
AWS EBS

AWS EBS

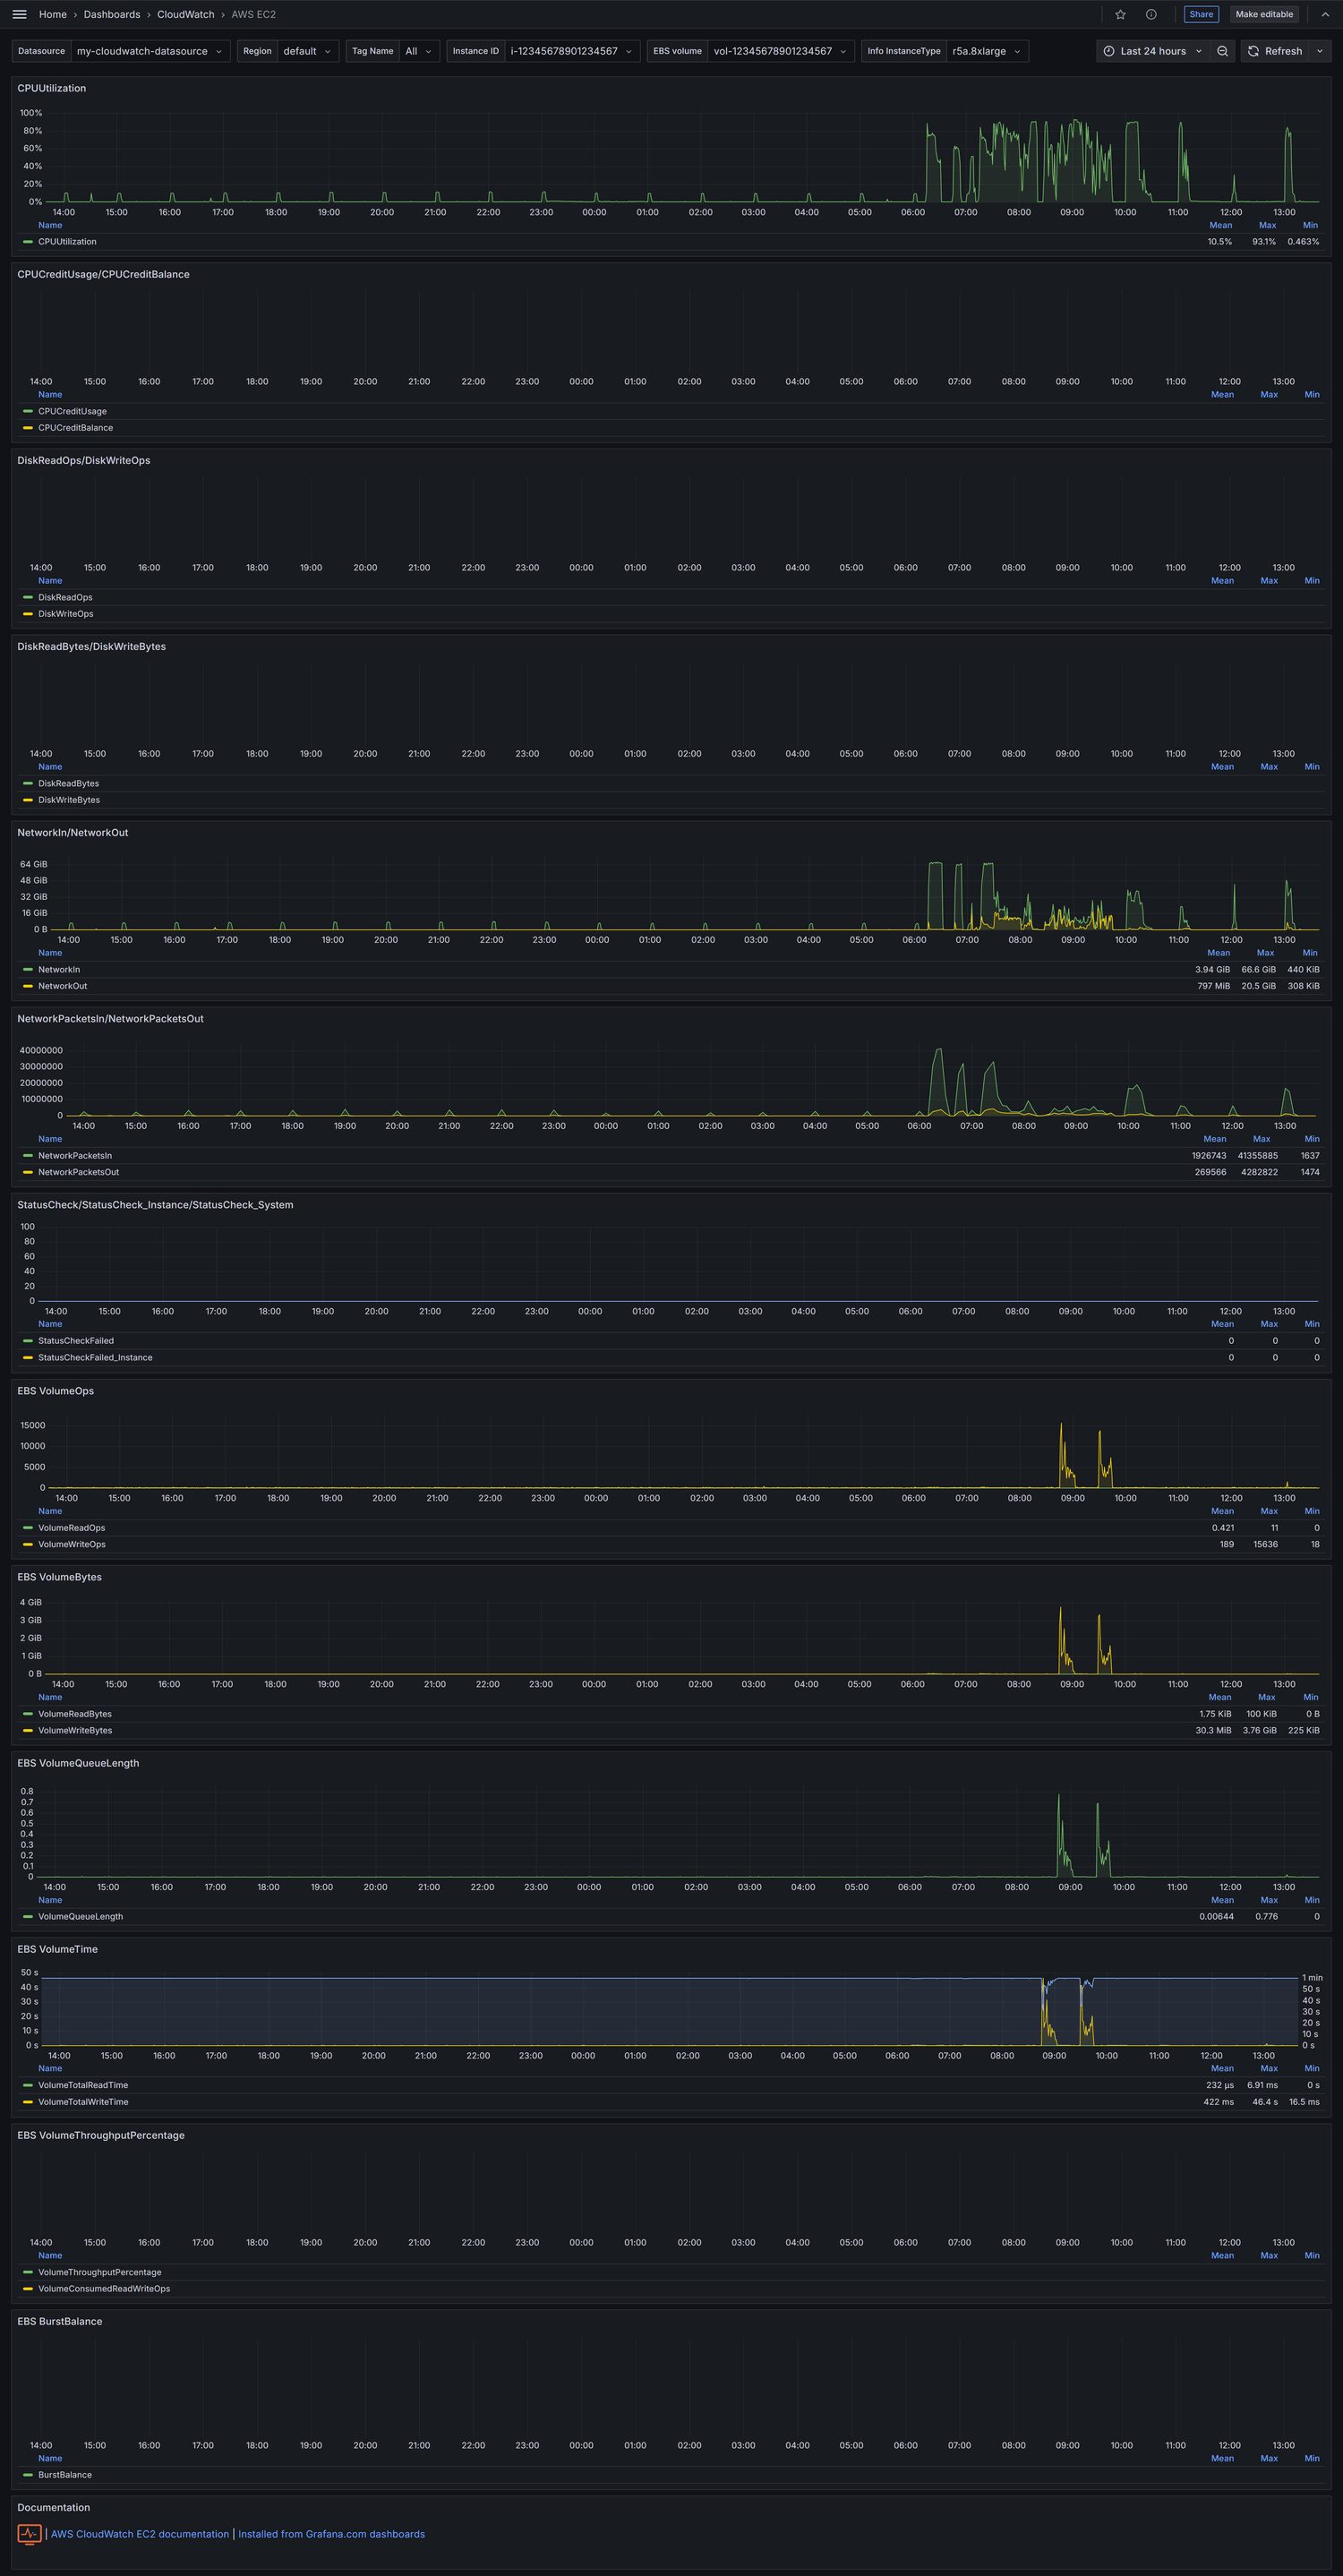
AWS EC2

AWS EC2

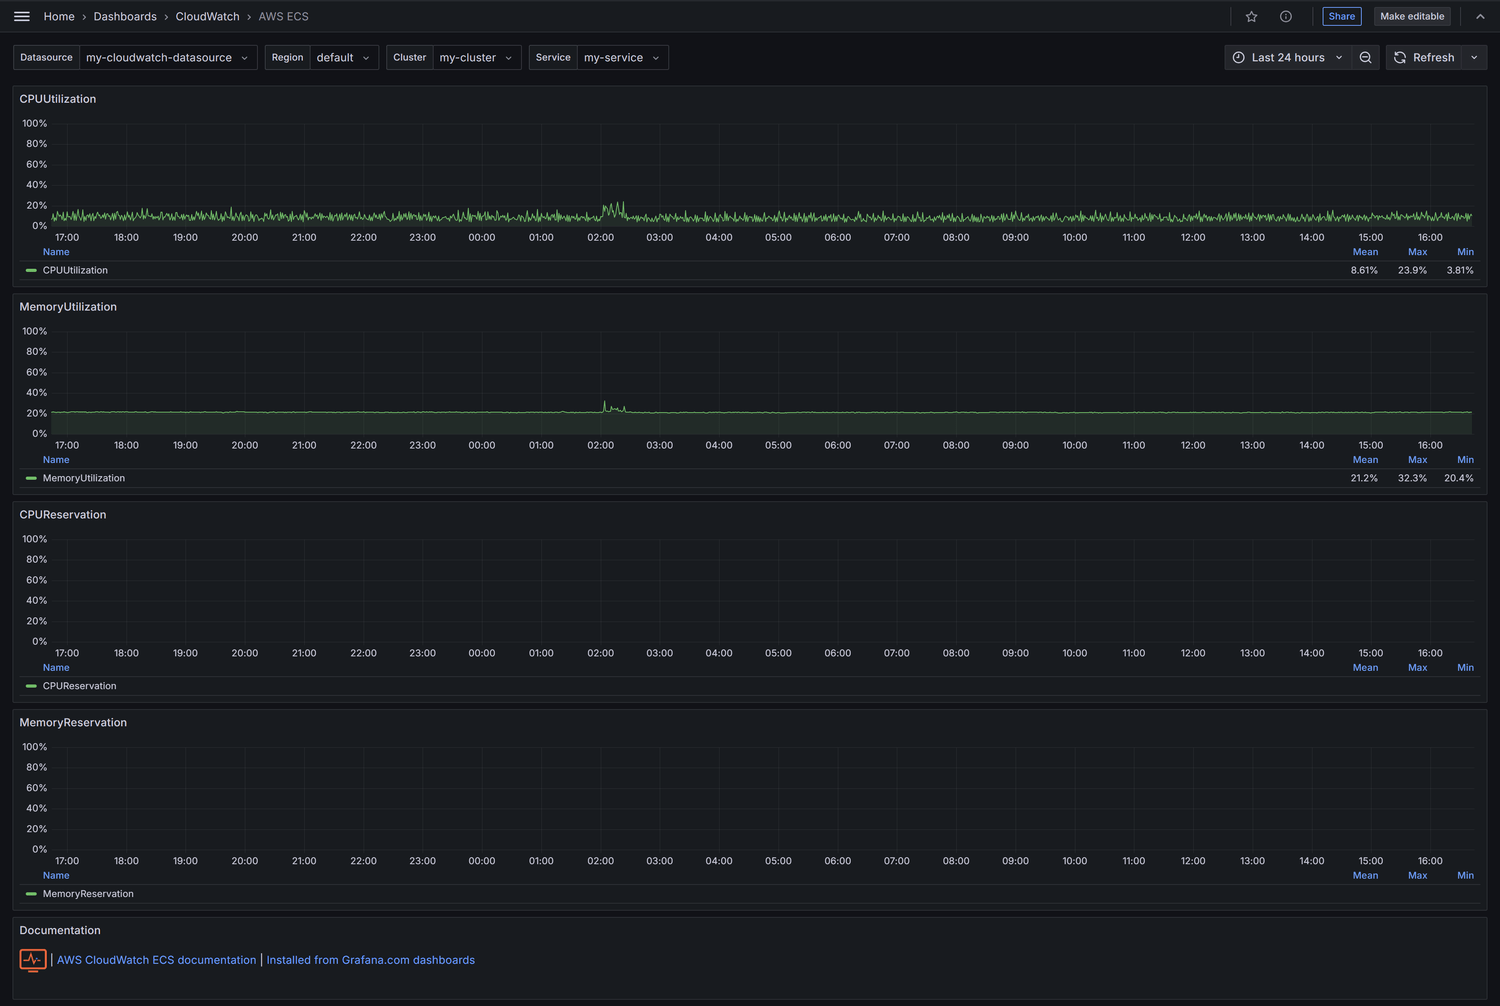
AWS ECS

AWS ECS

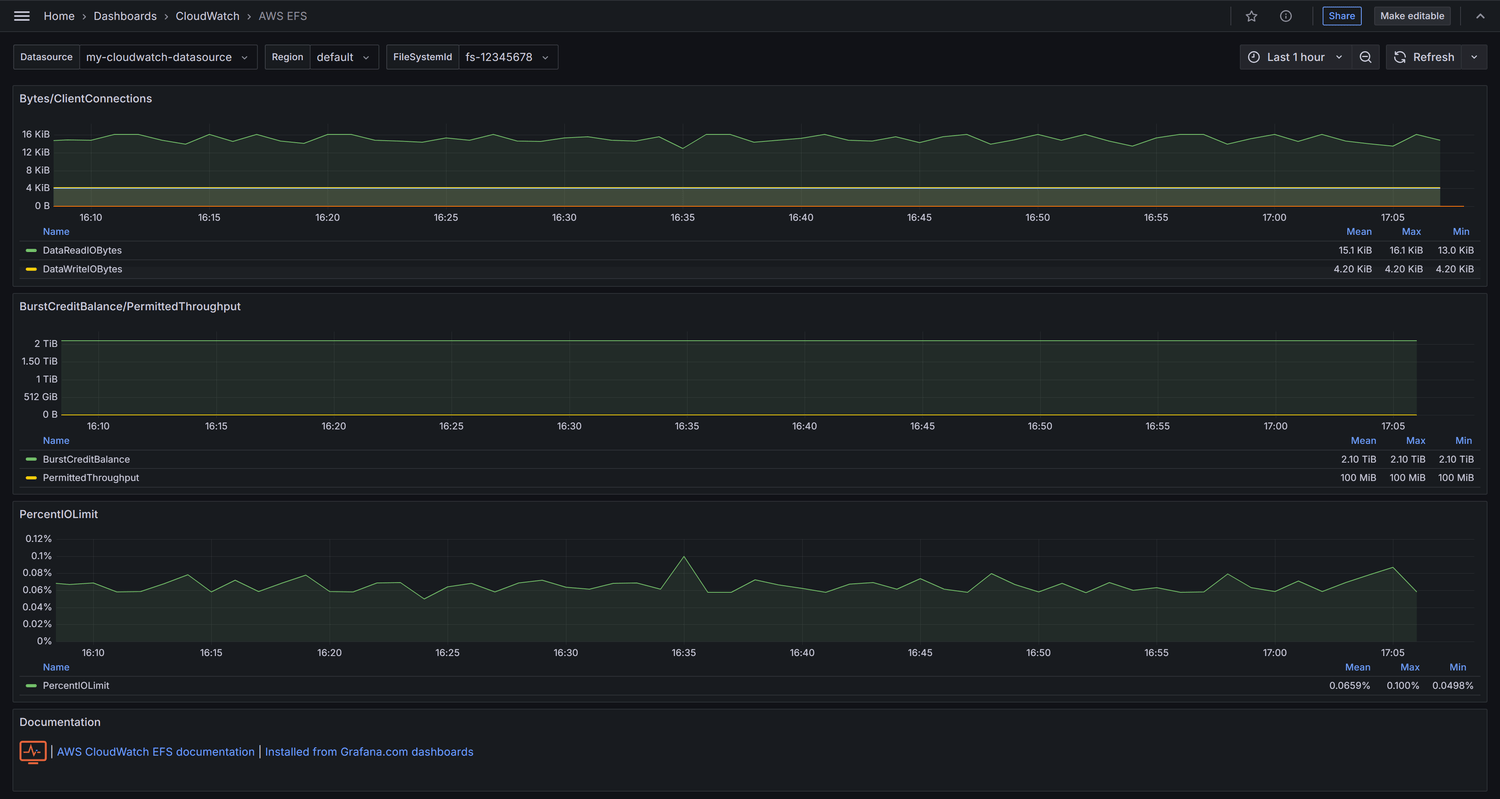
AWS EFS

AWS EFS

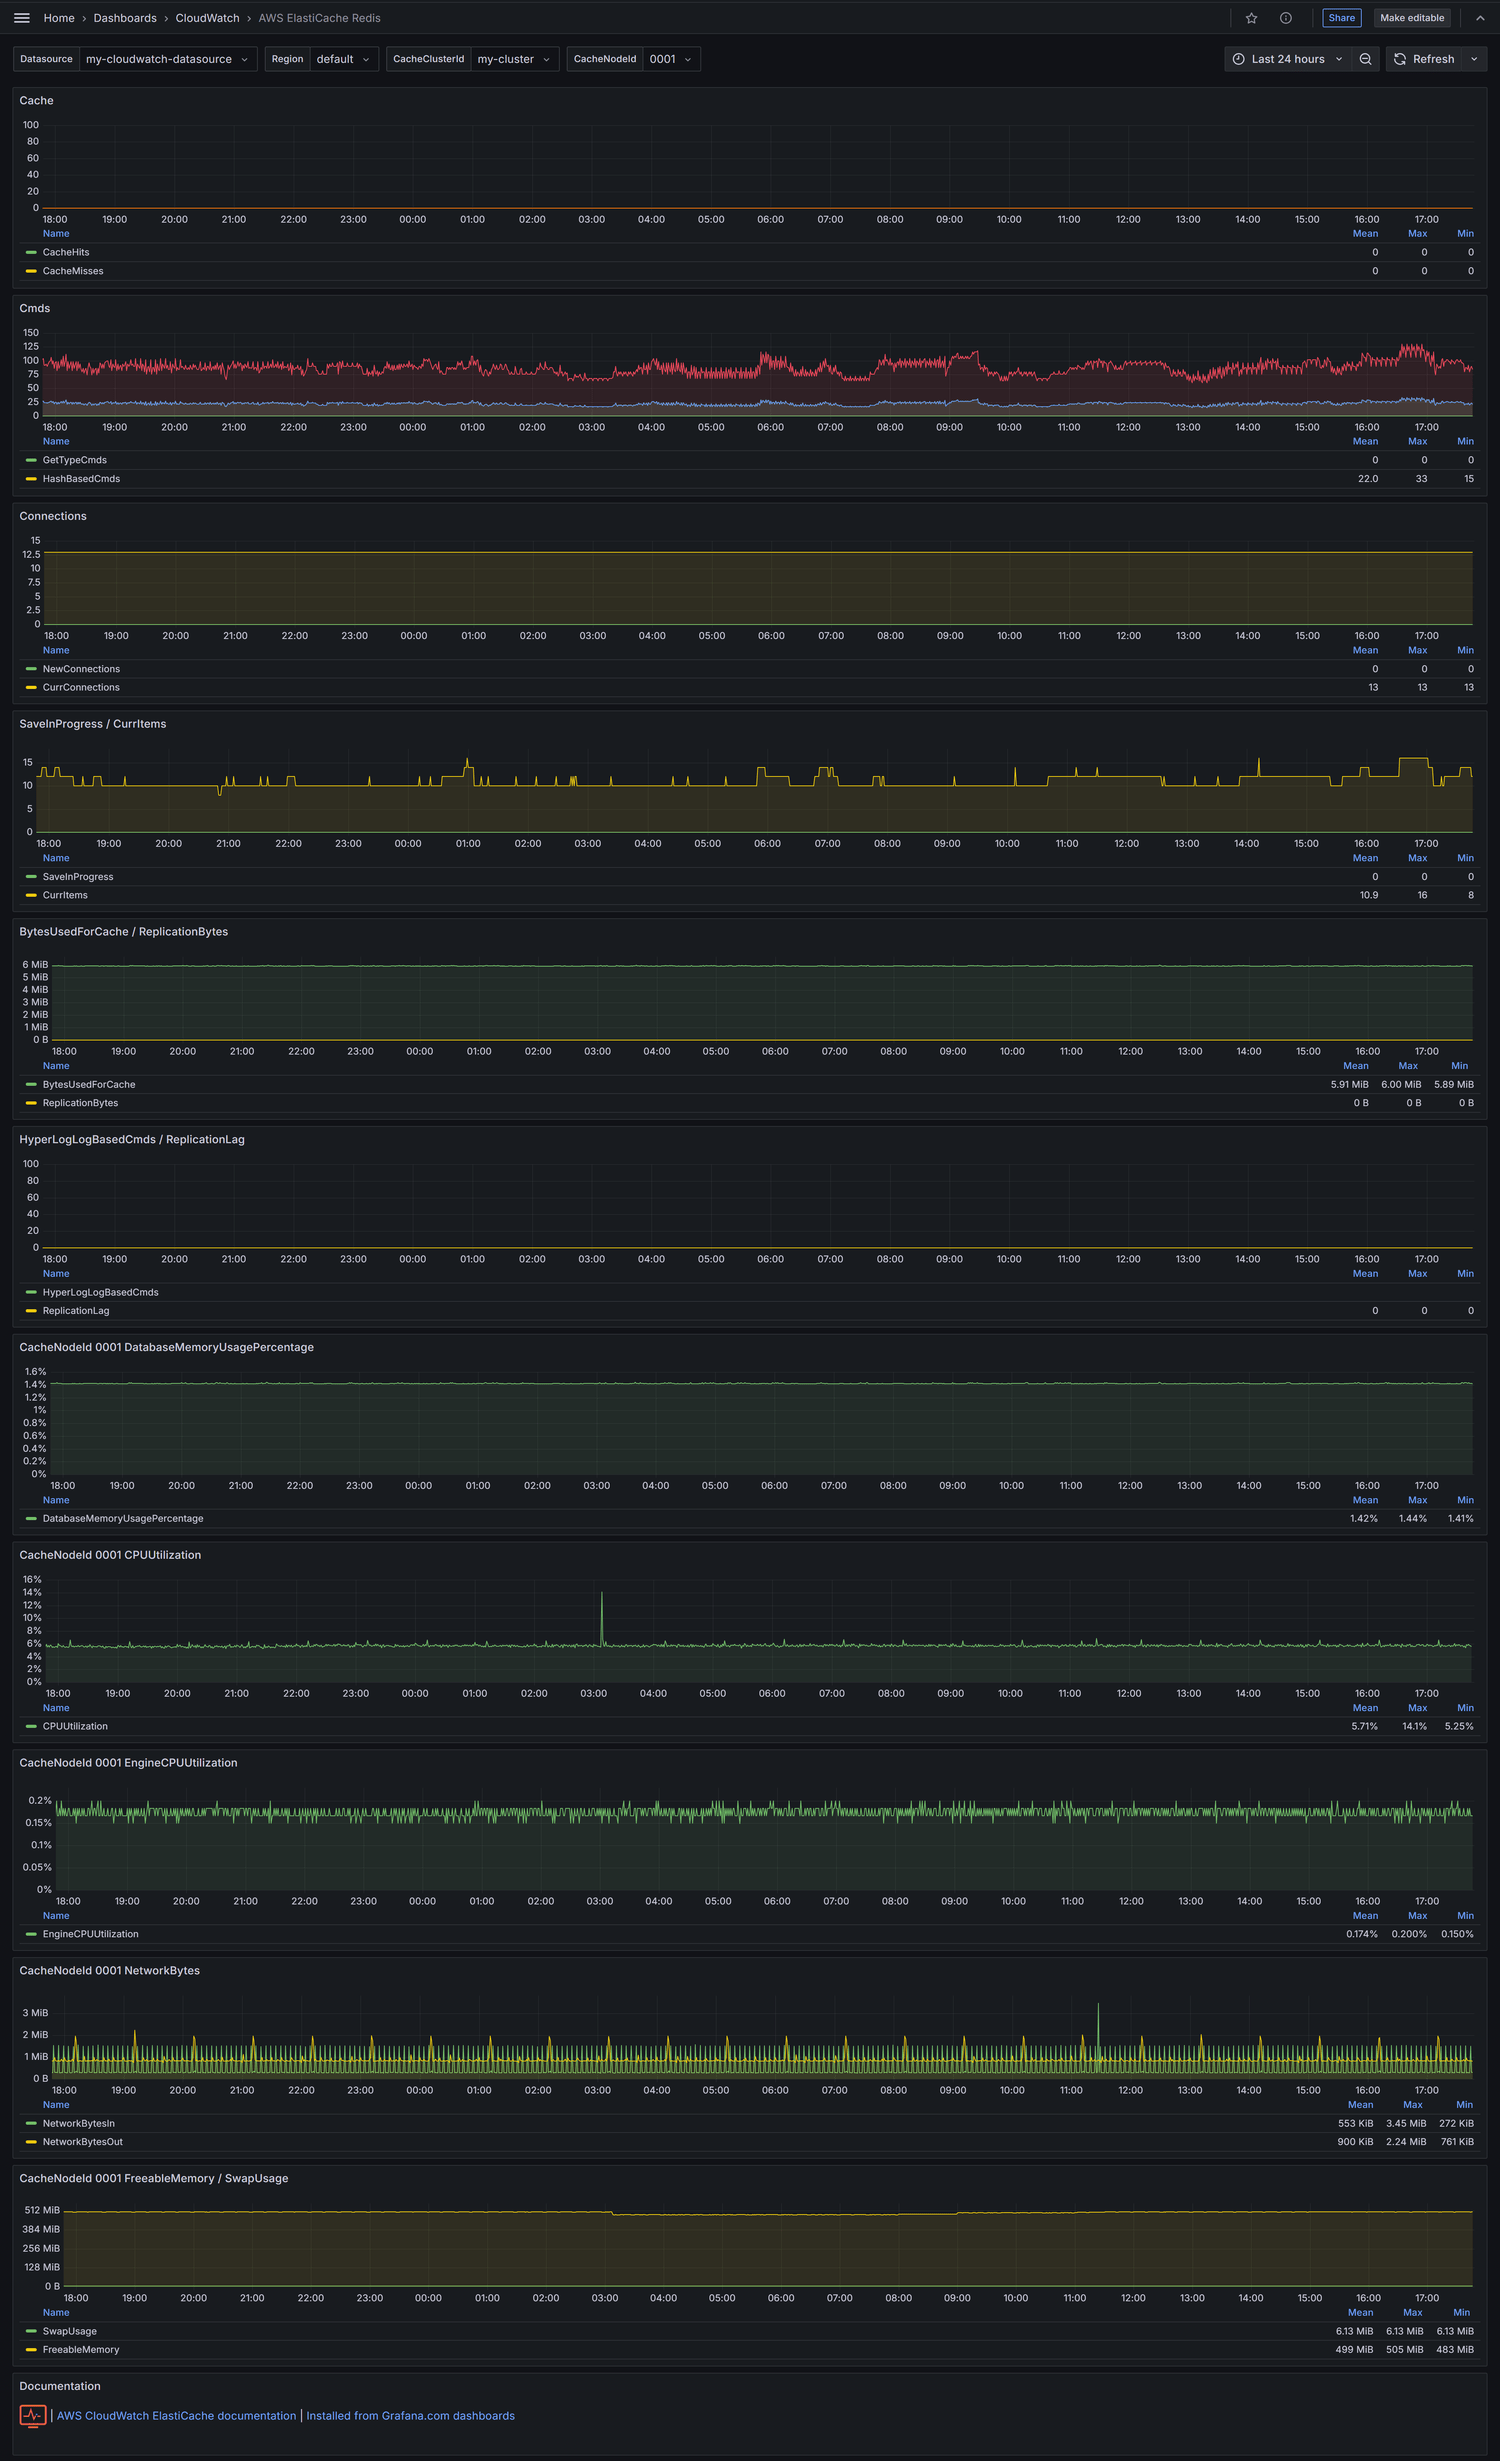
AWS ElastiCache Redis

AWS ElastiCache Redis

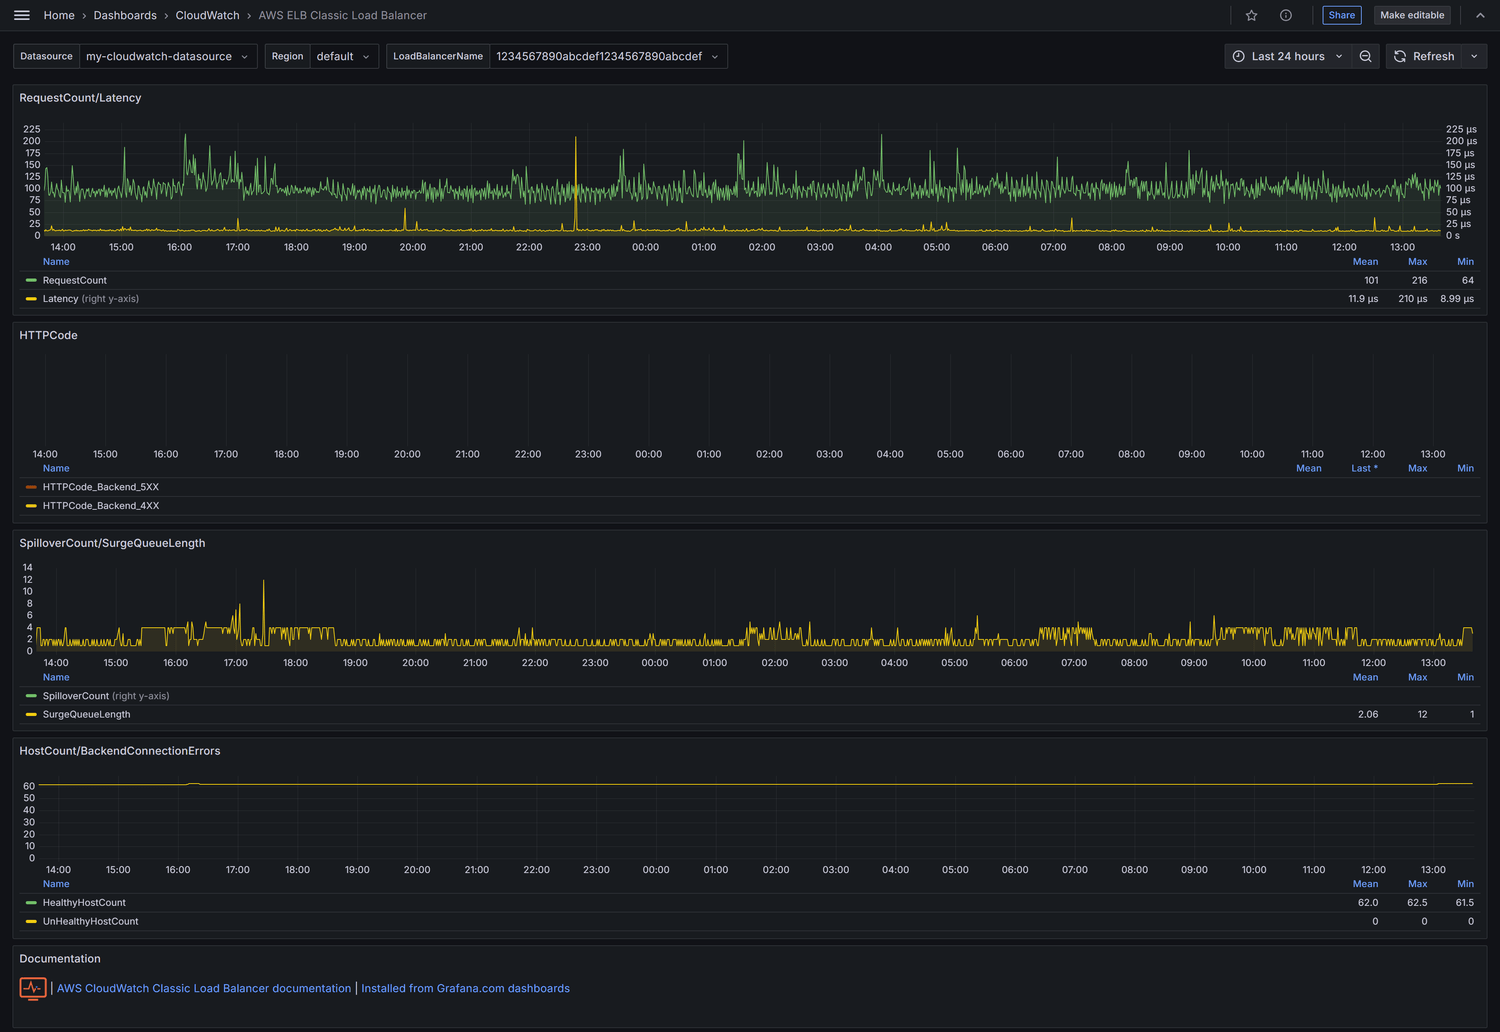
AWS ELB Classic Load Balancer

AWS ELB Classic Load Balancer

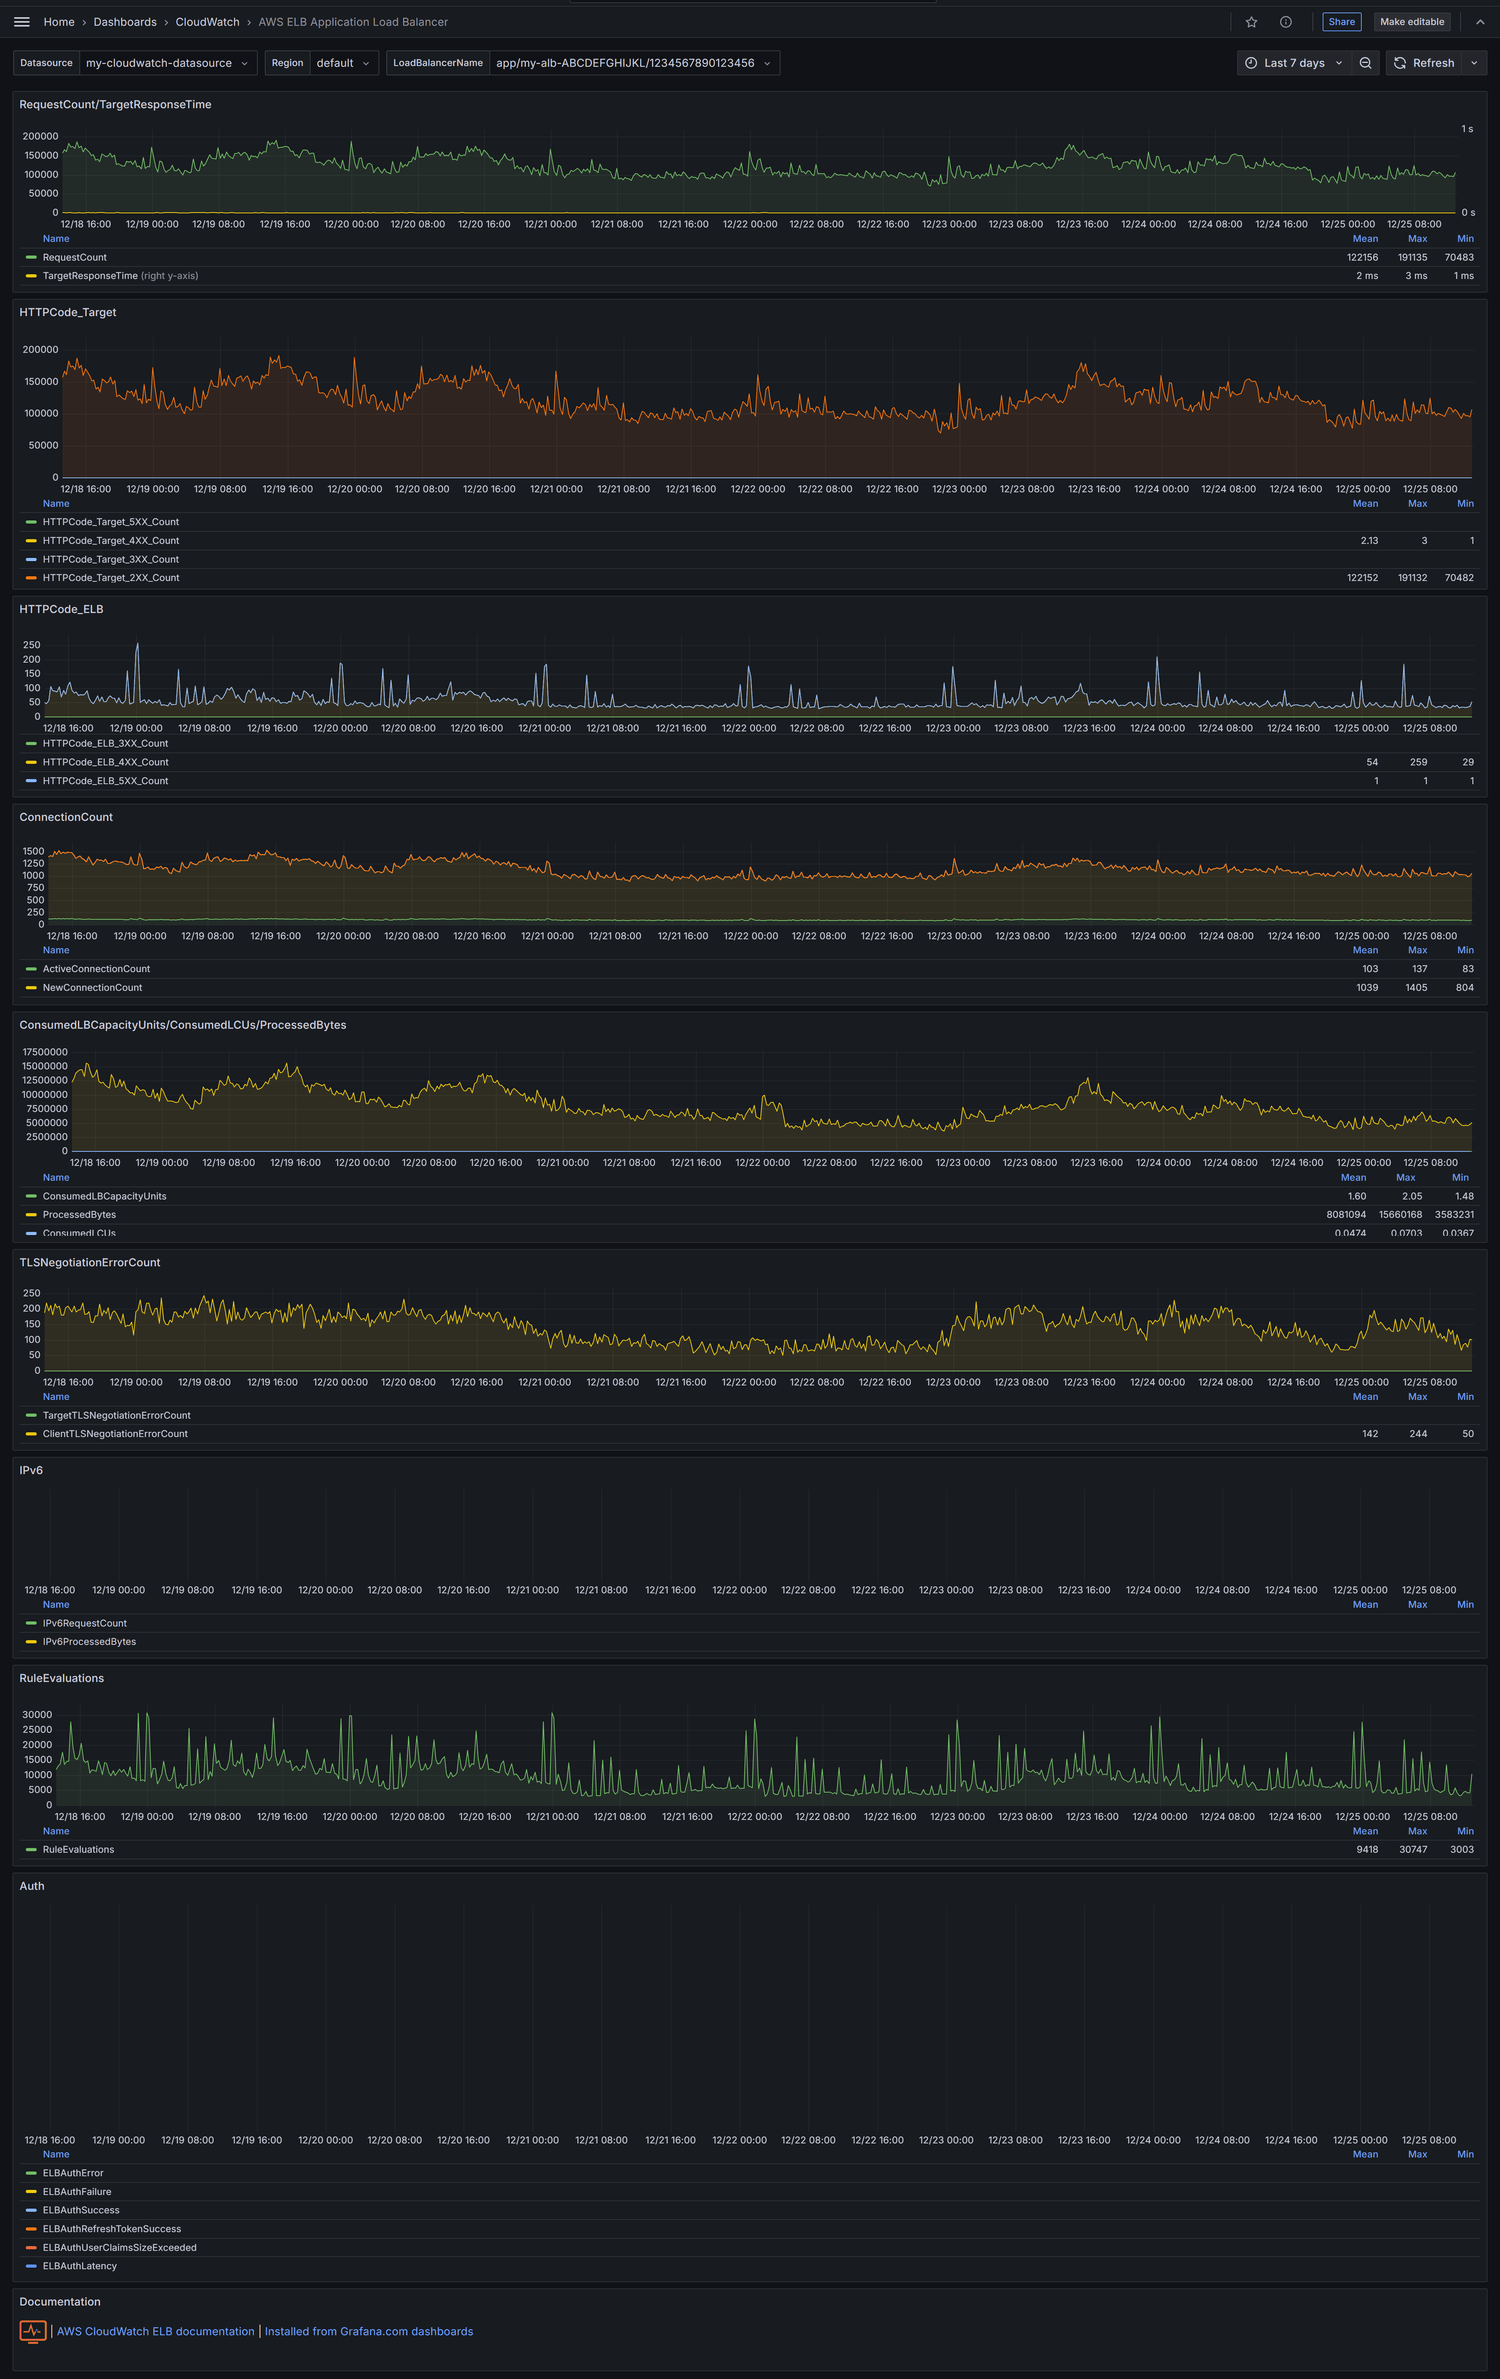
AWS ELB Application Load Balancer

AWS ELB Application Load Balancer

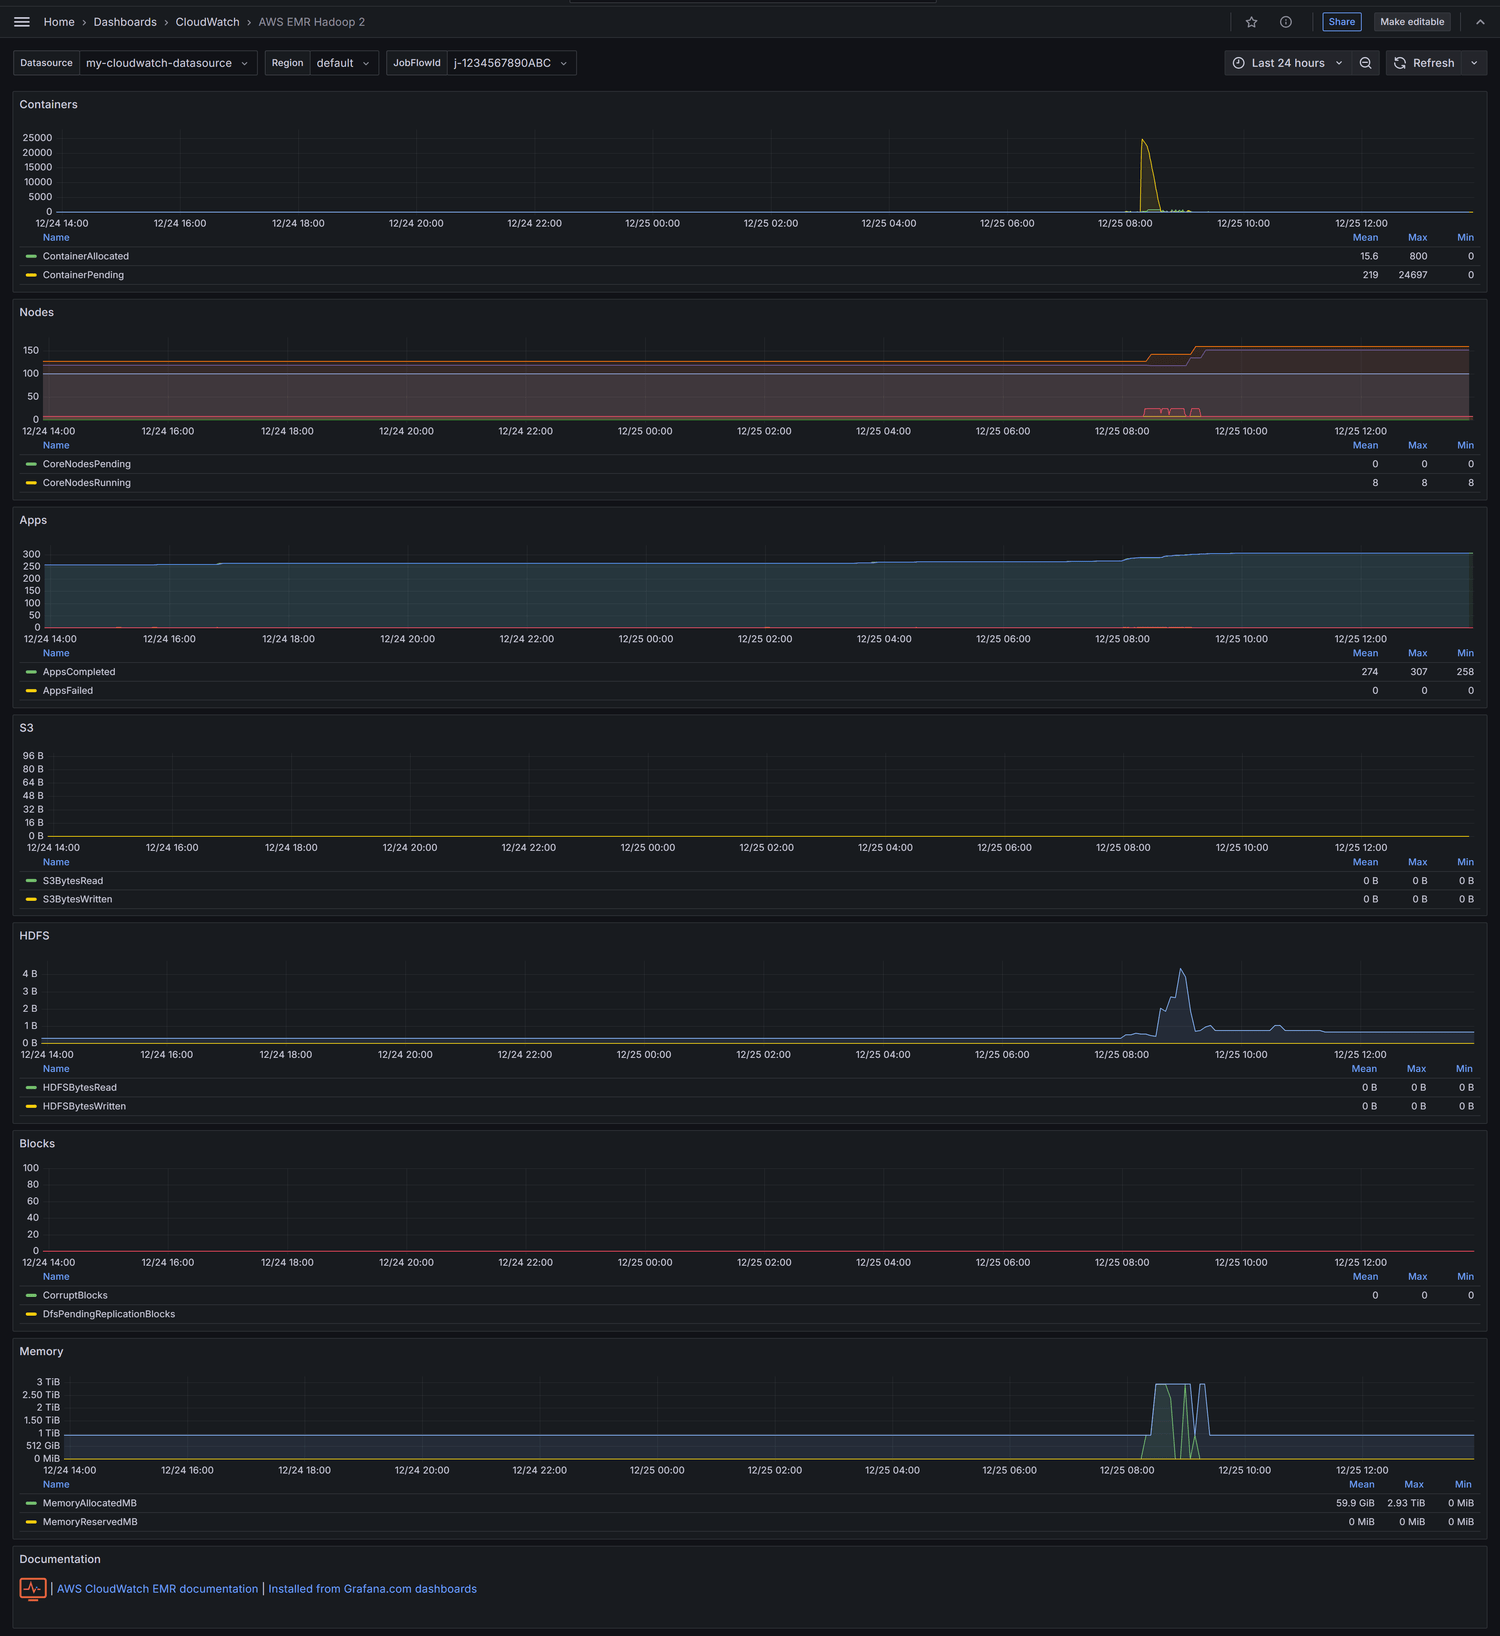
AWS EMR Hadoop 2

AWS EMR Hadoop 2

AWS Events

AWS Events

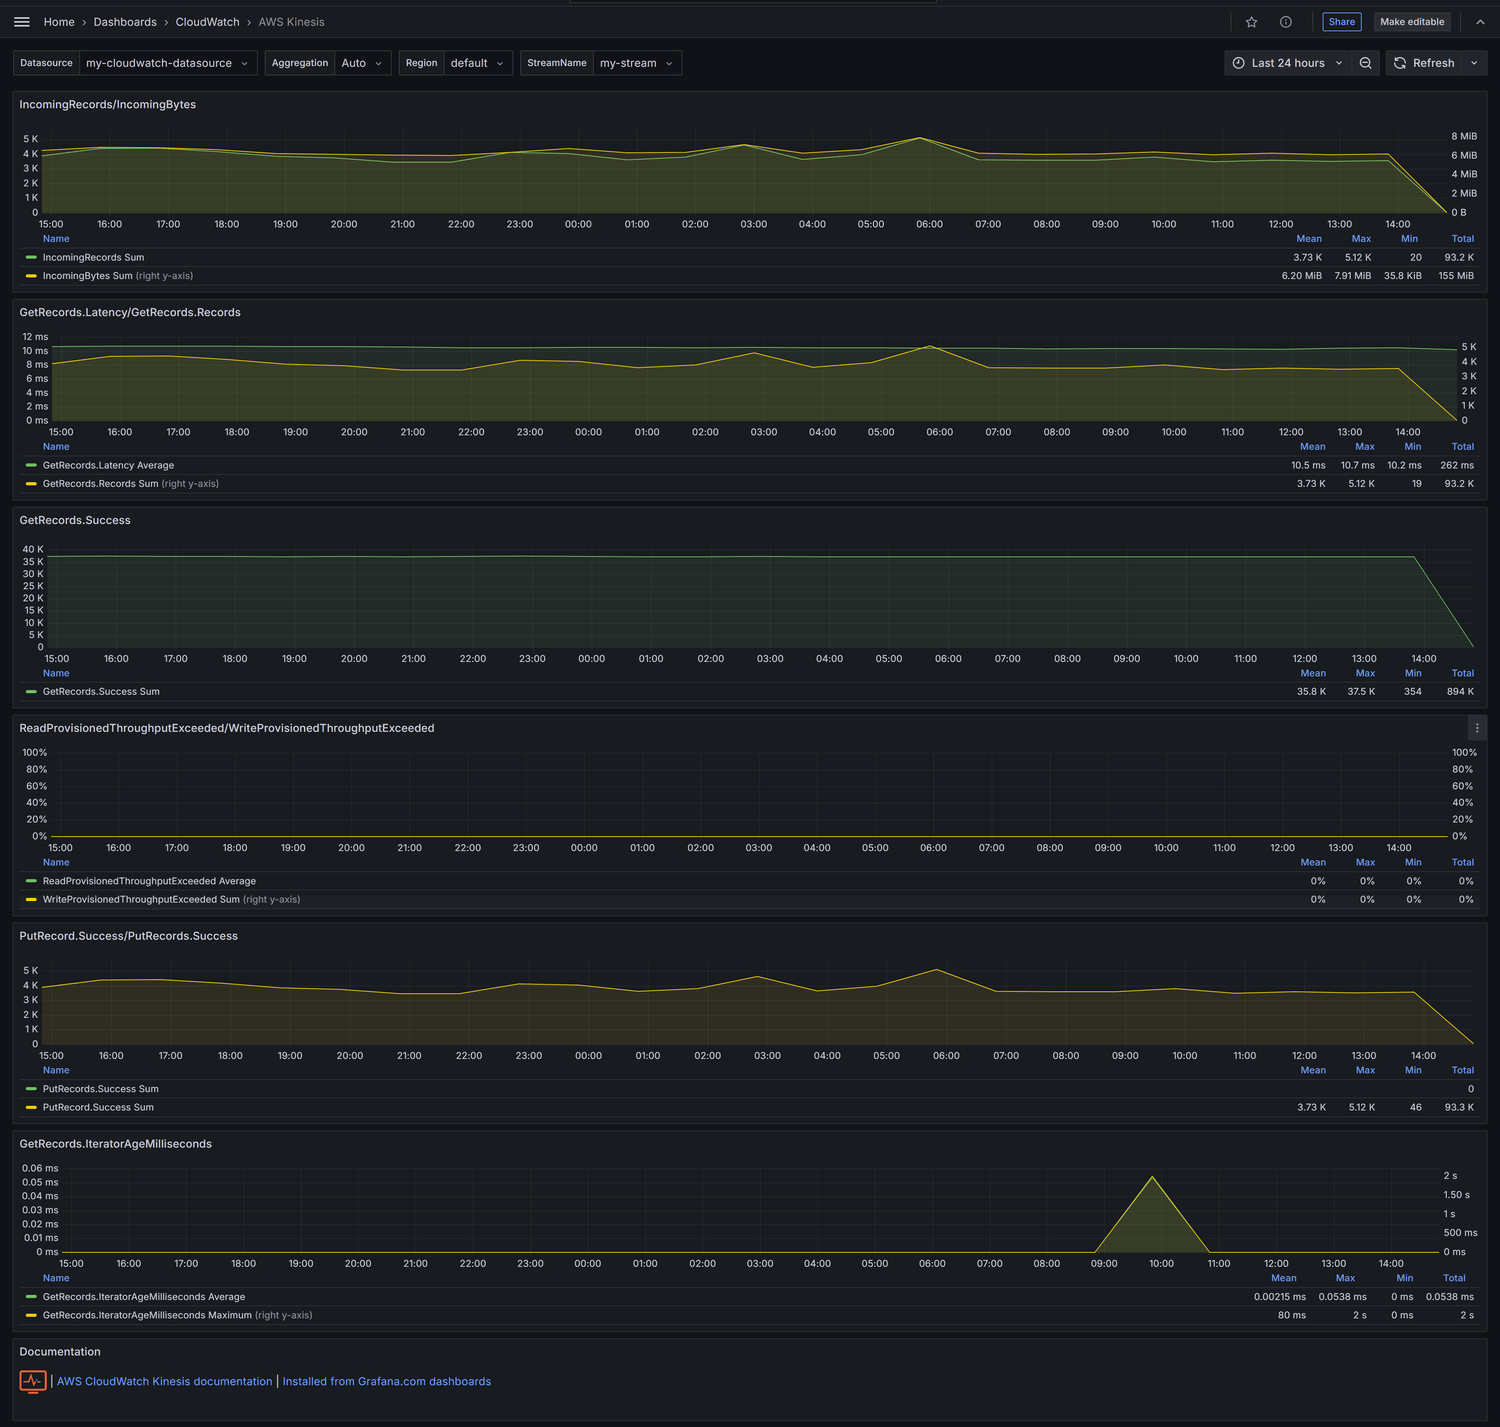
AWS Kinesis

AWS Kinesis

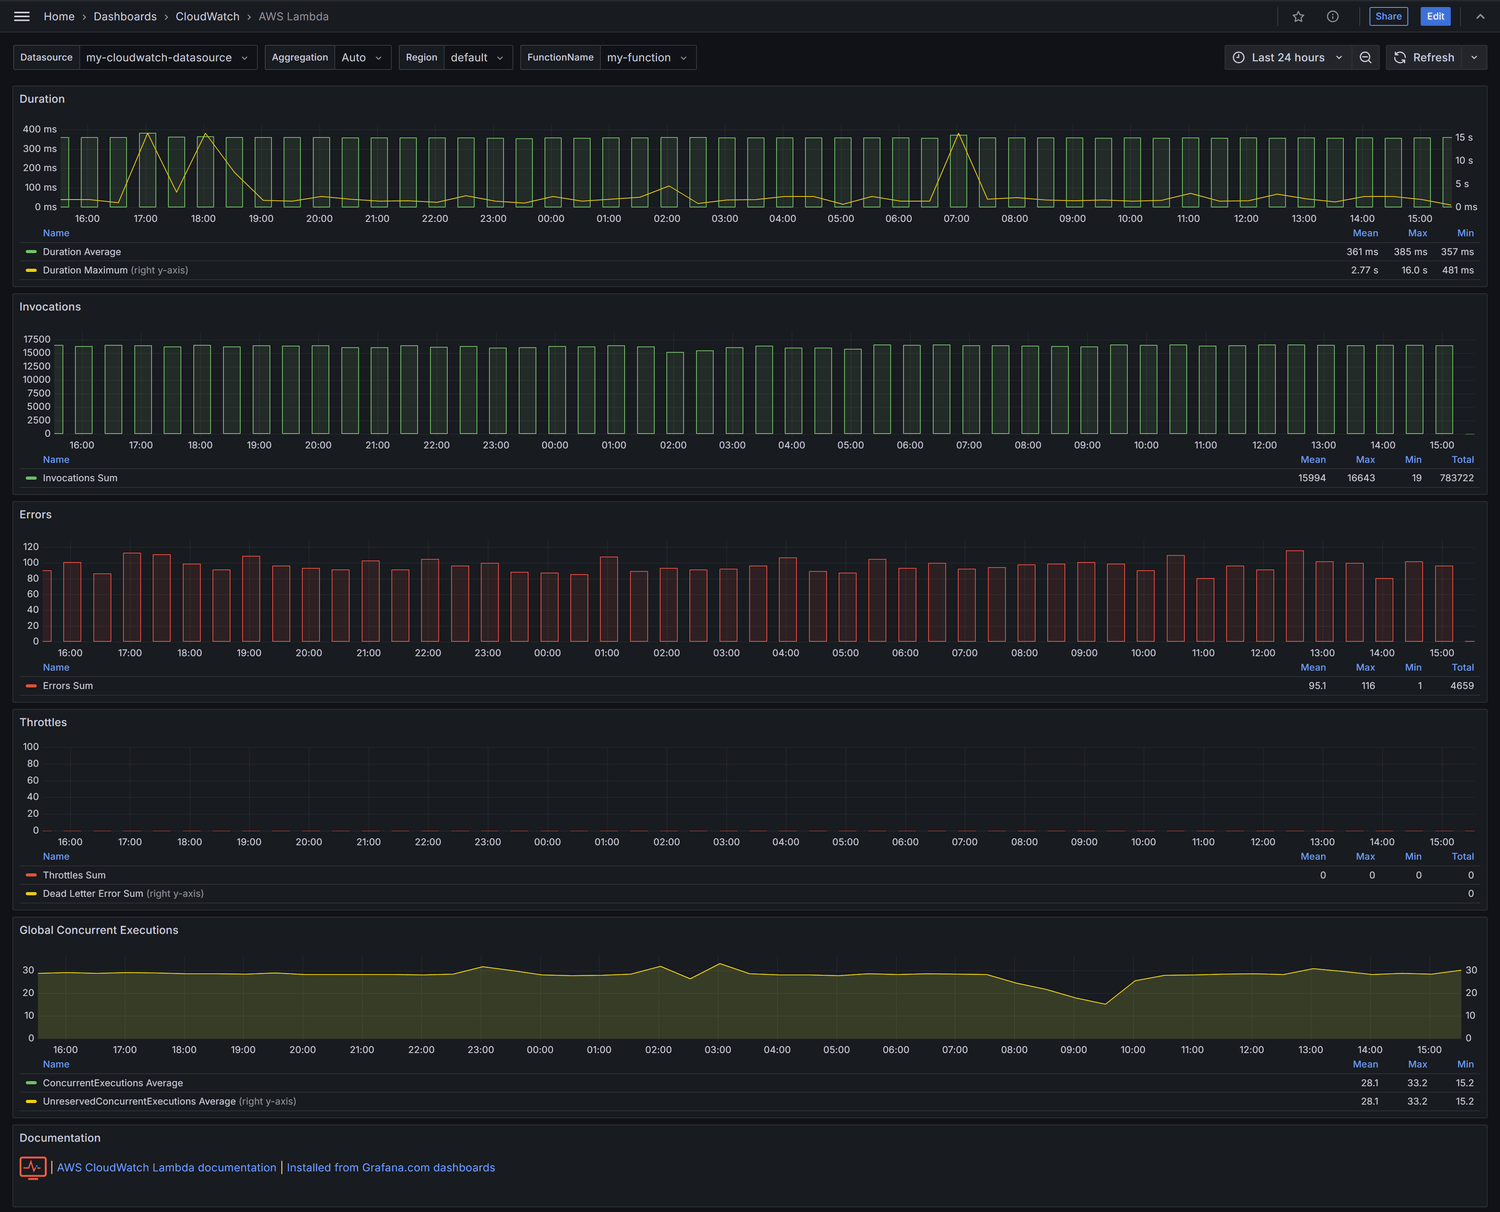
AWS Lambda

AWS Lambda

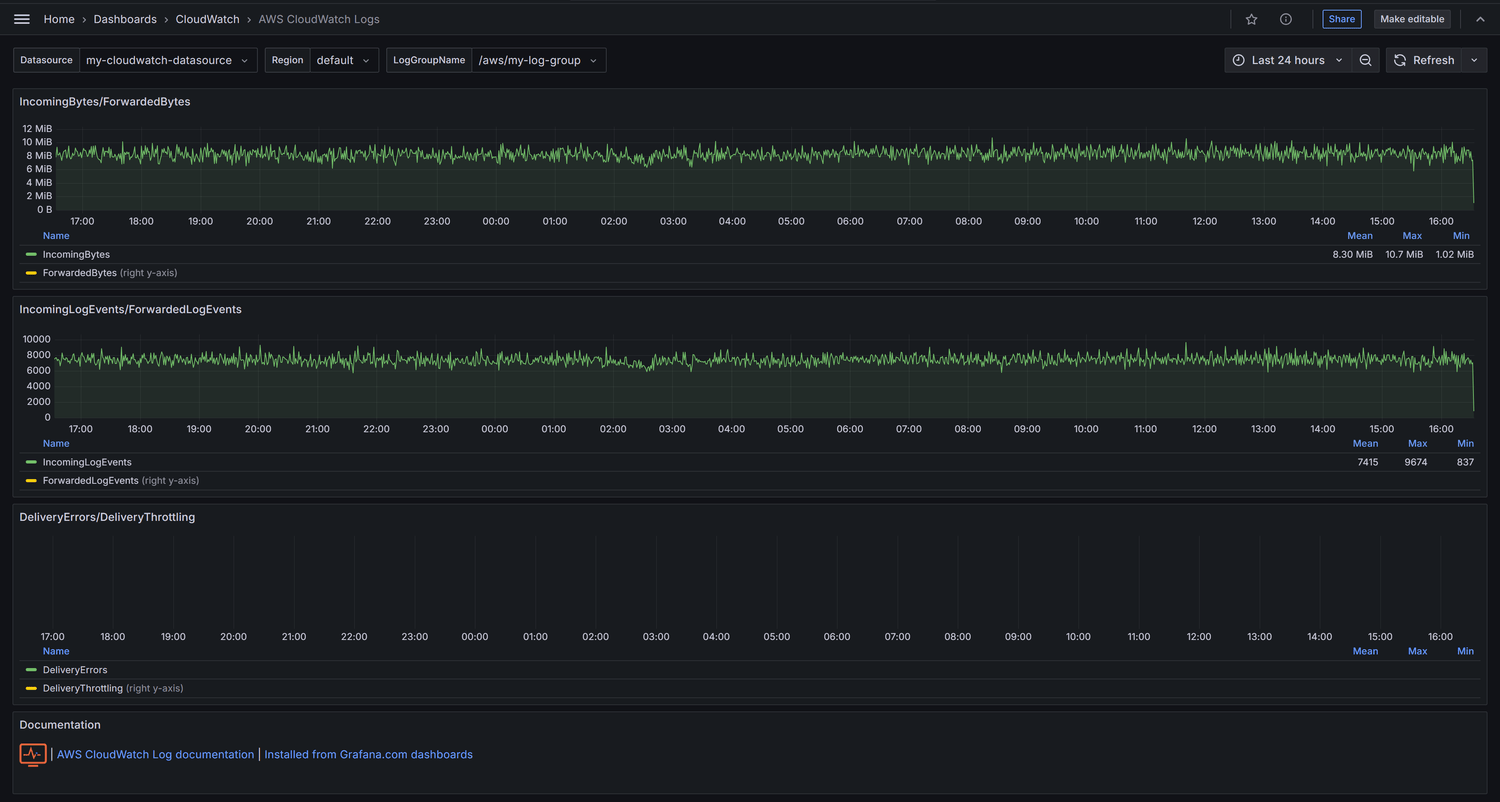
AWS Logs

AWS Logs

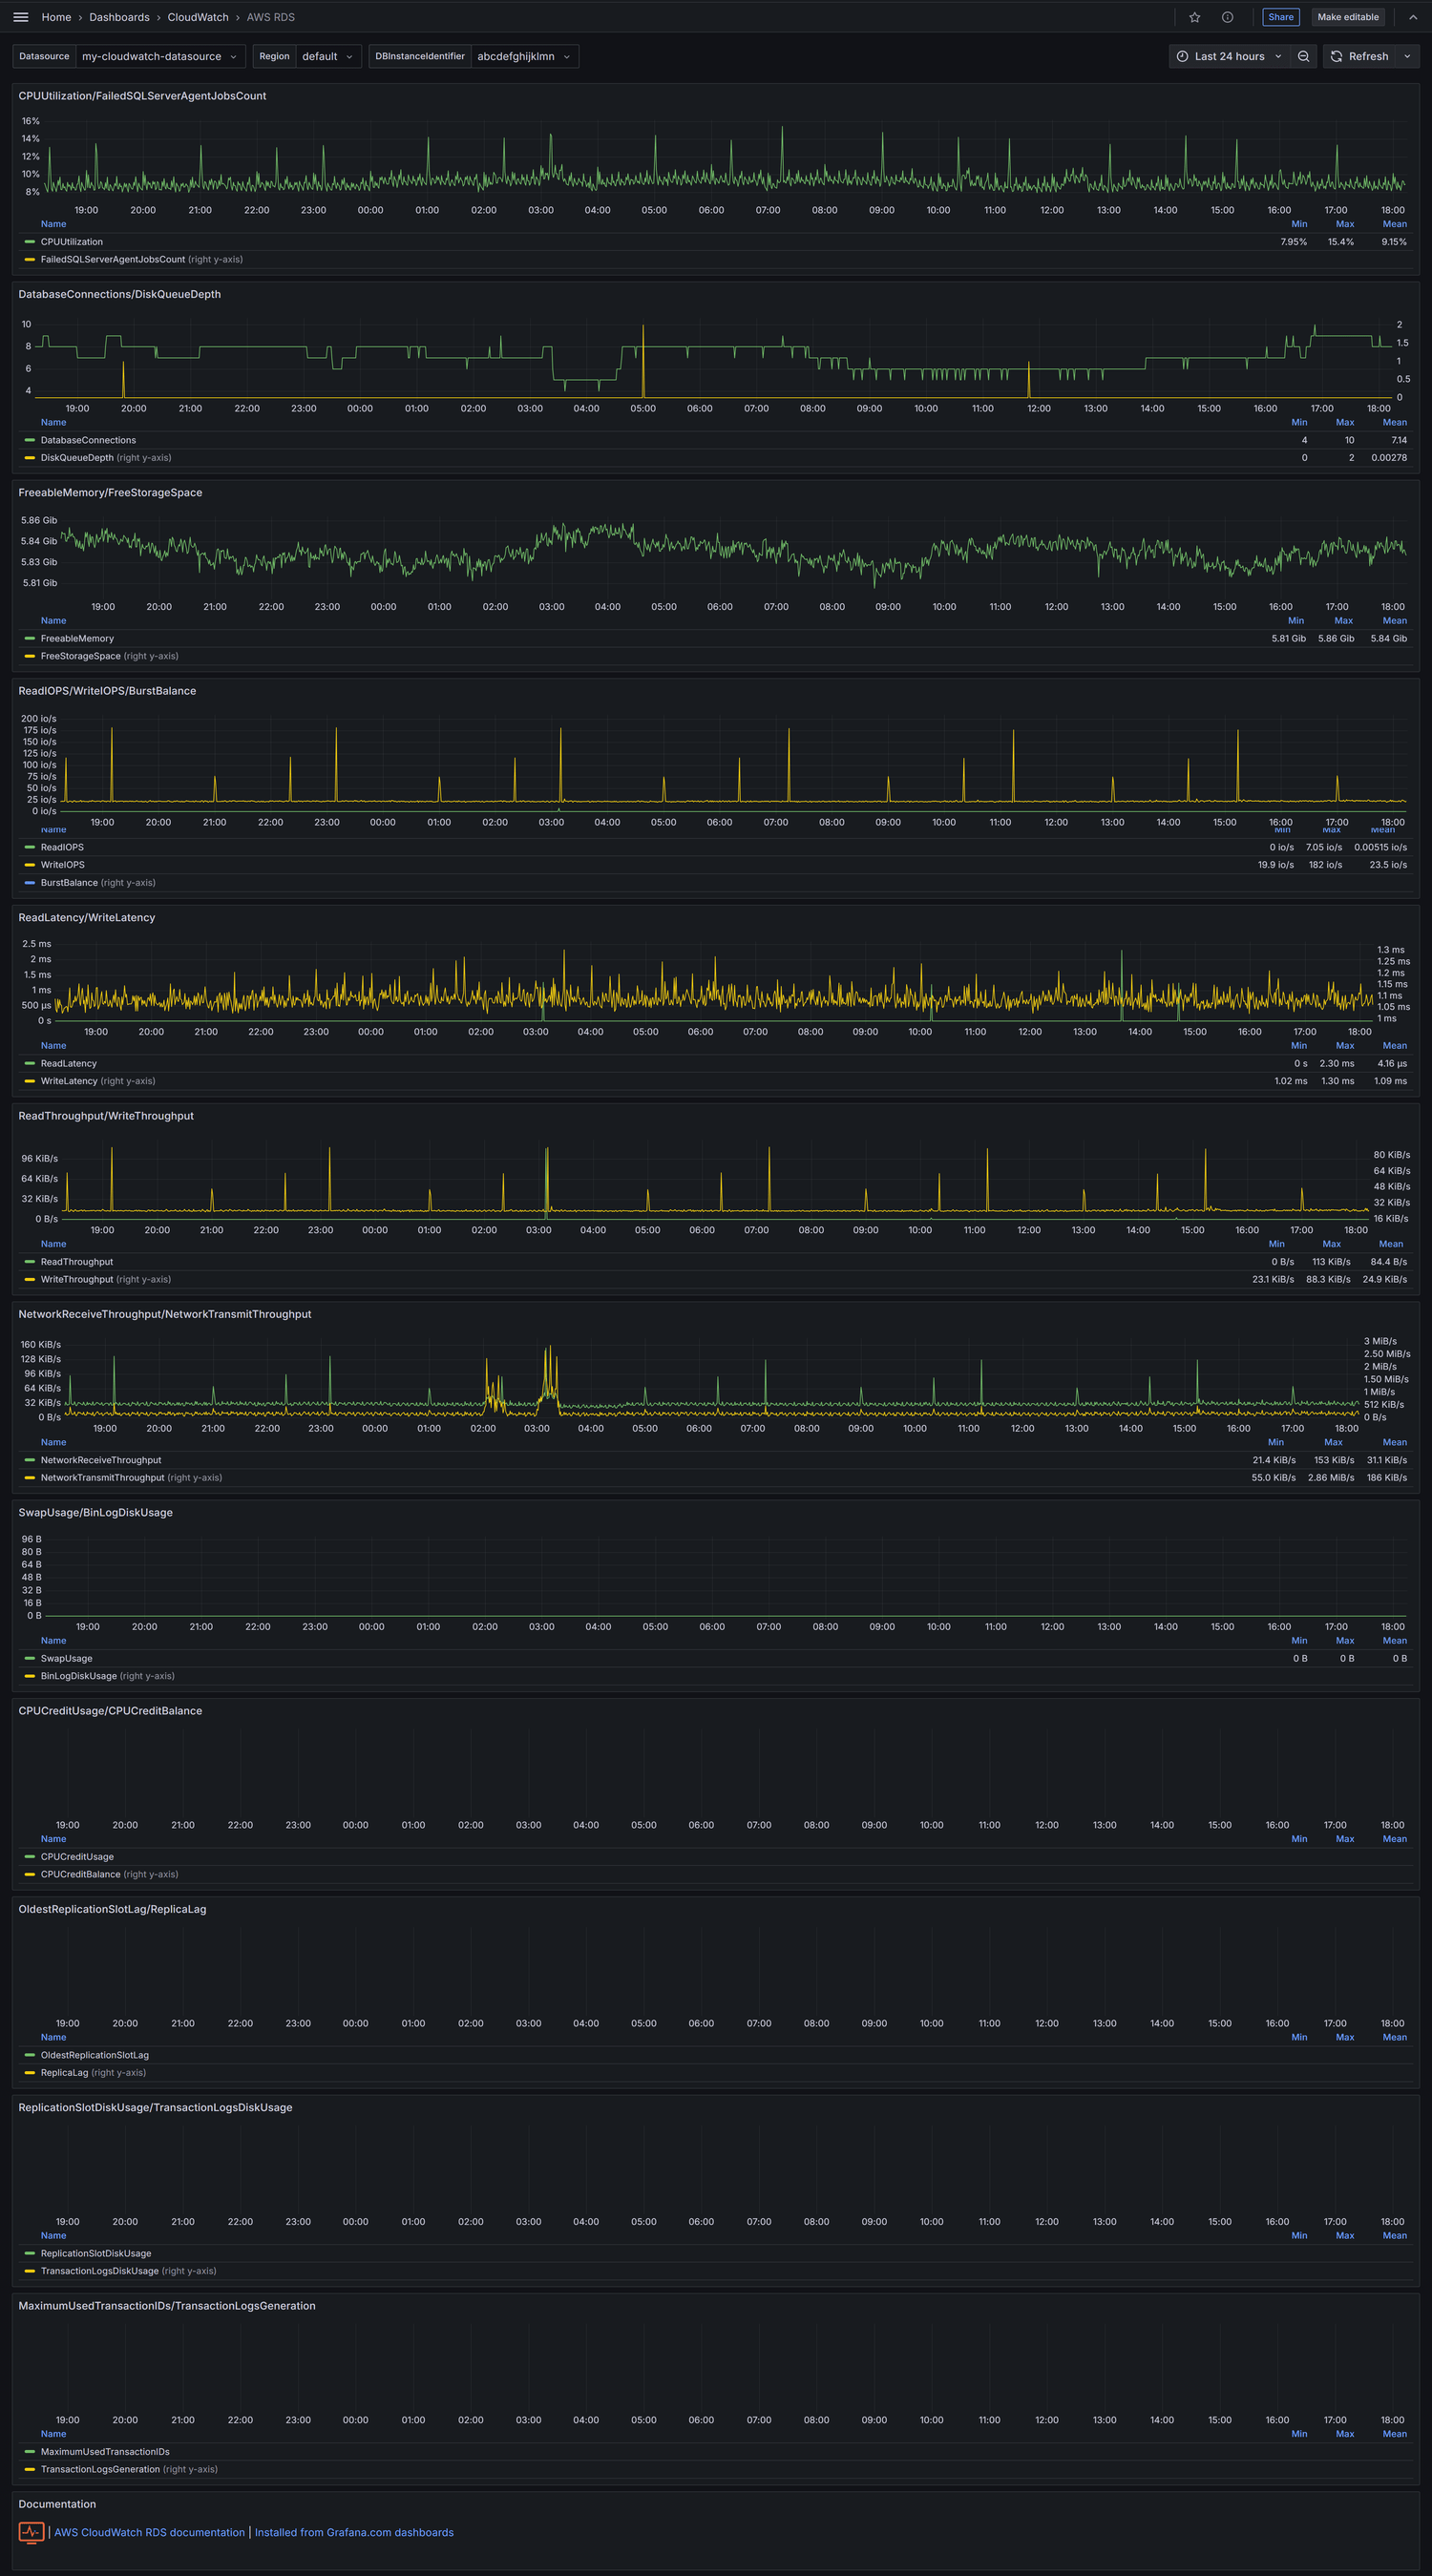
AWS RDS

AWS RDS

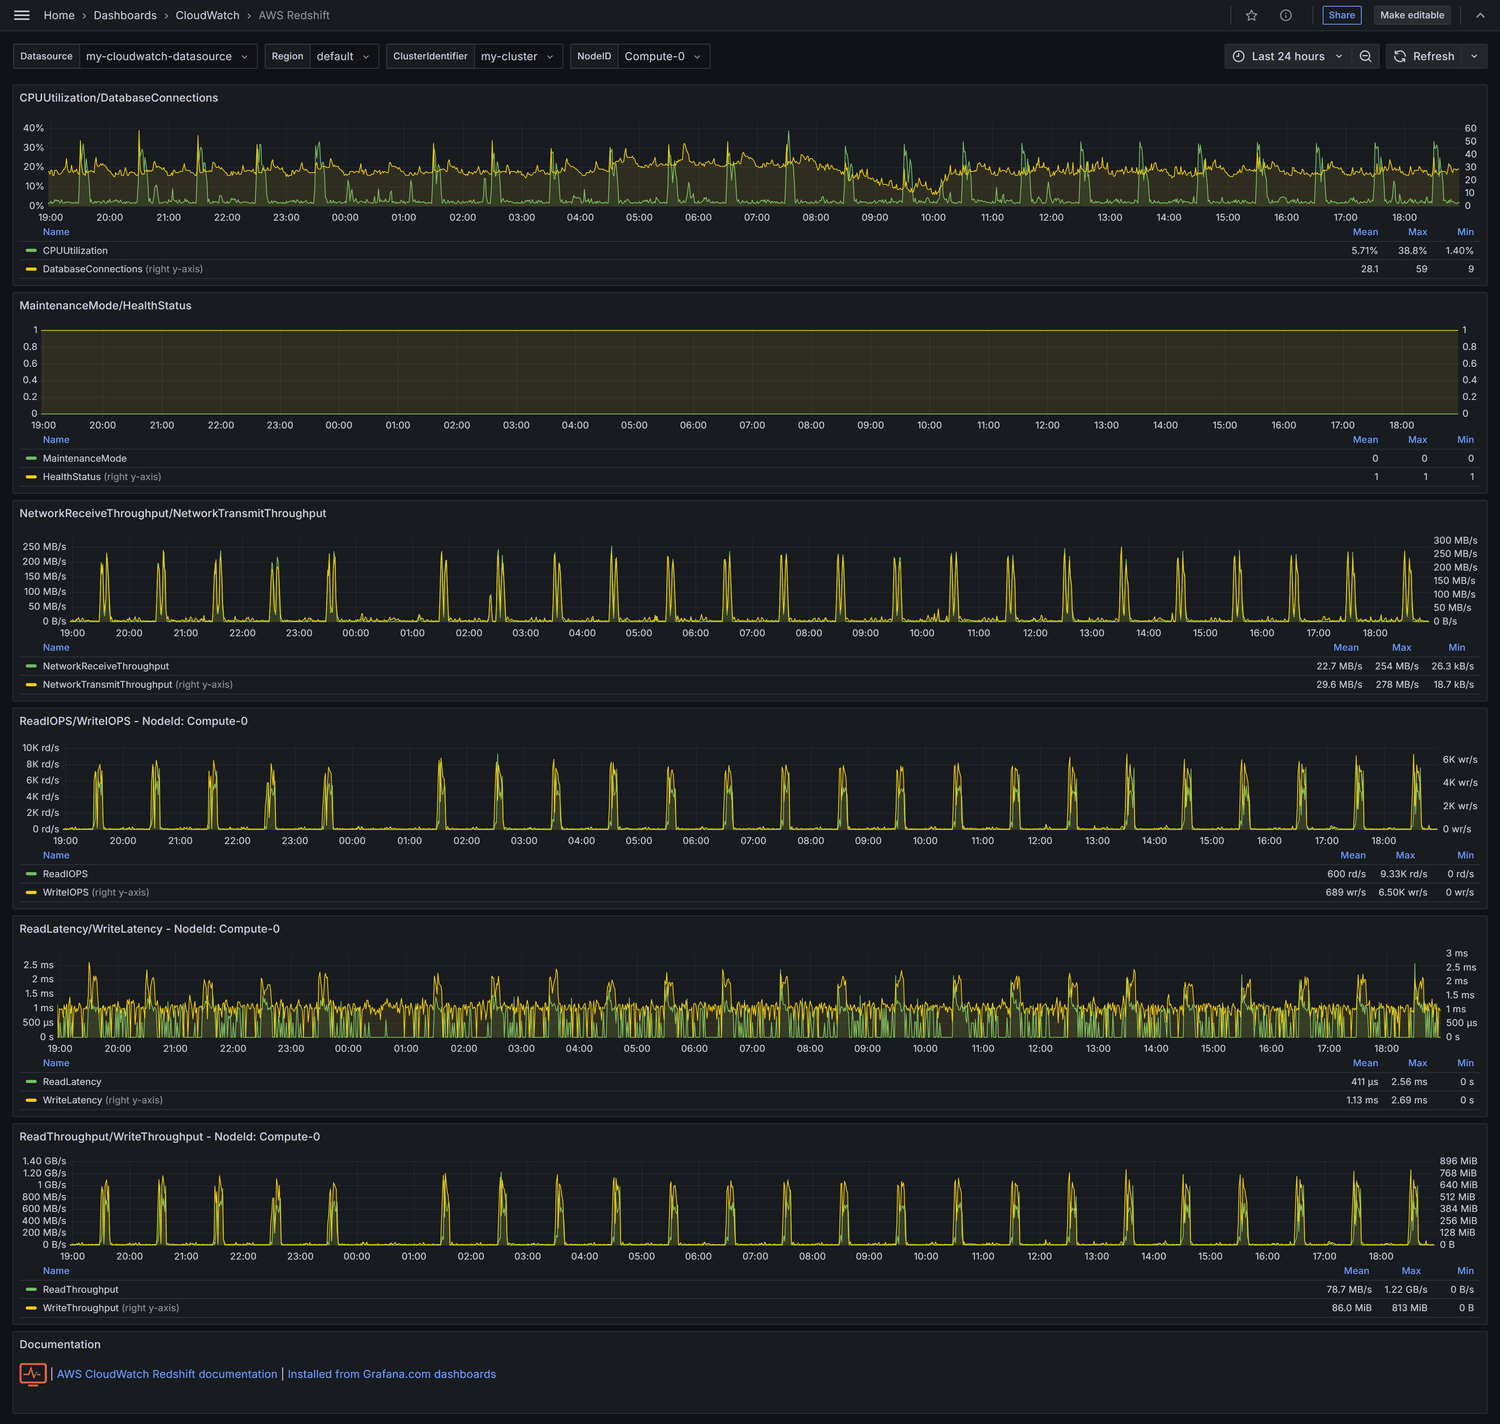
AWS Redshift

AWS Redshift

AWS Route 53

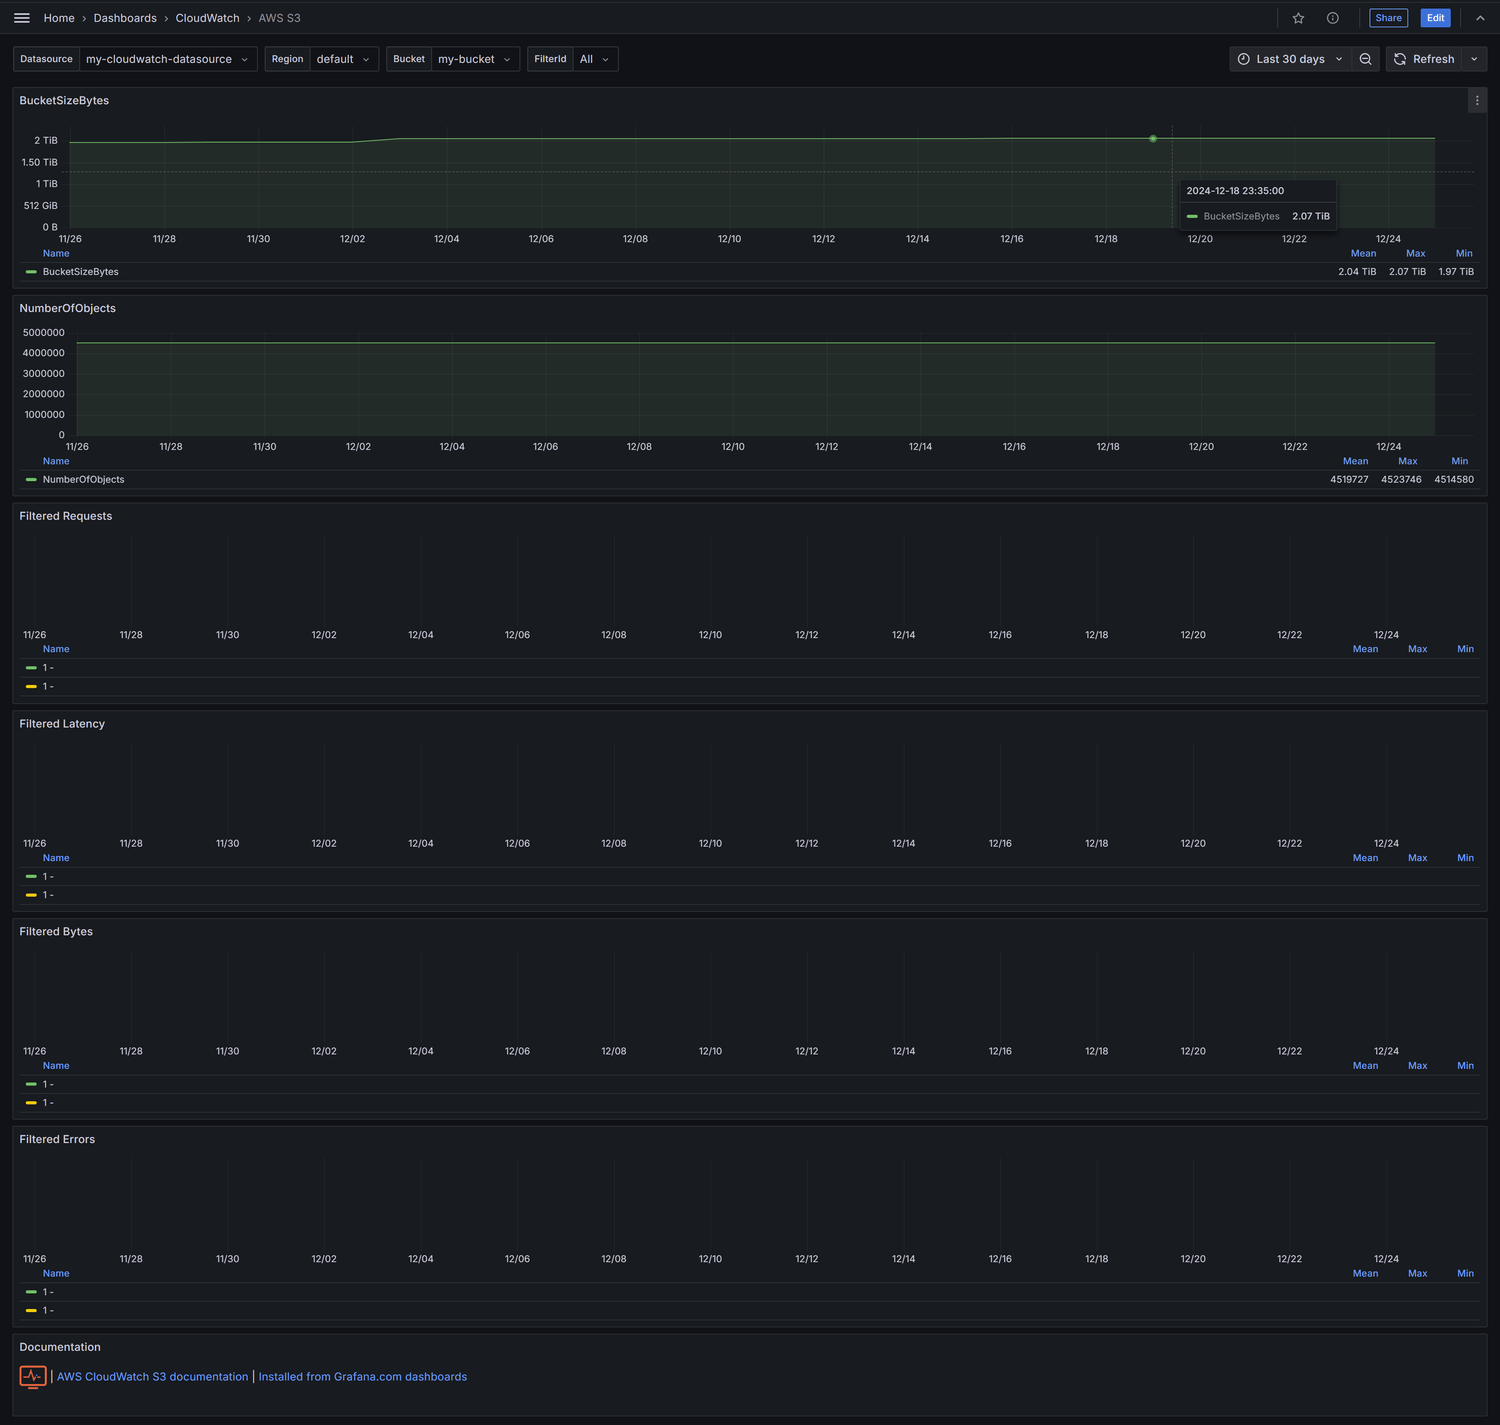
AWS S3

AWS S3

AWS SES

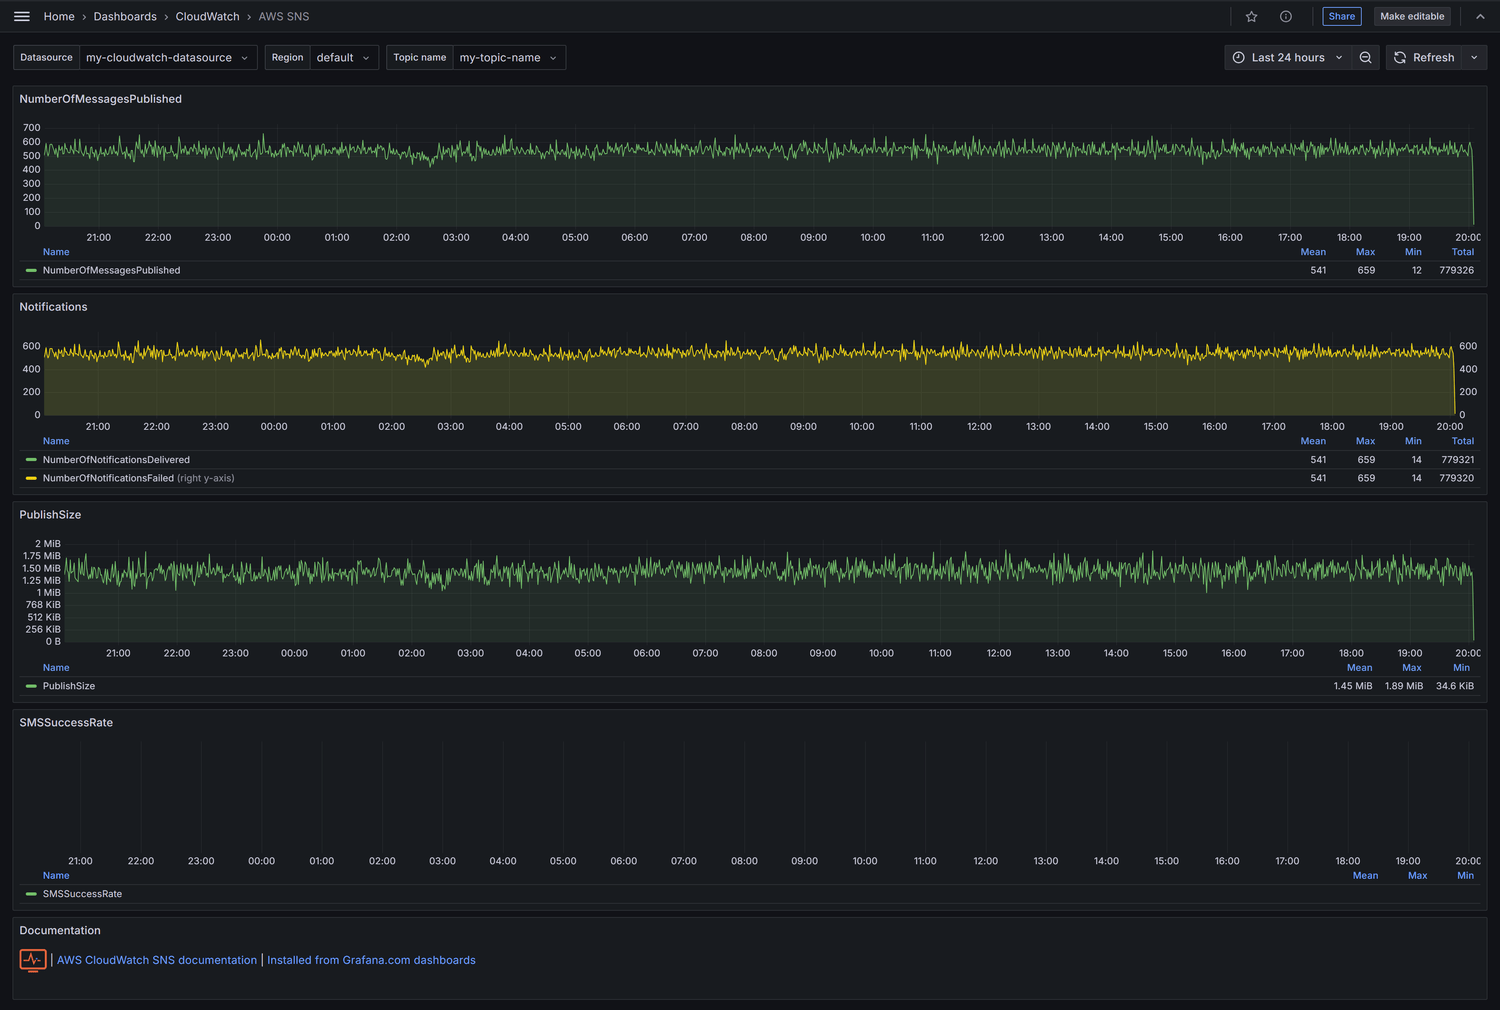
AWS SNS

AWS SNS

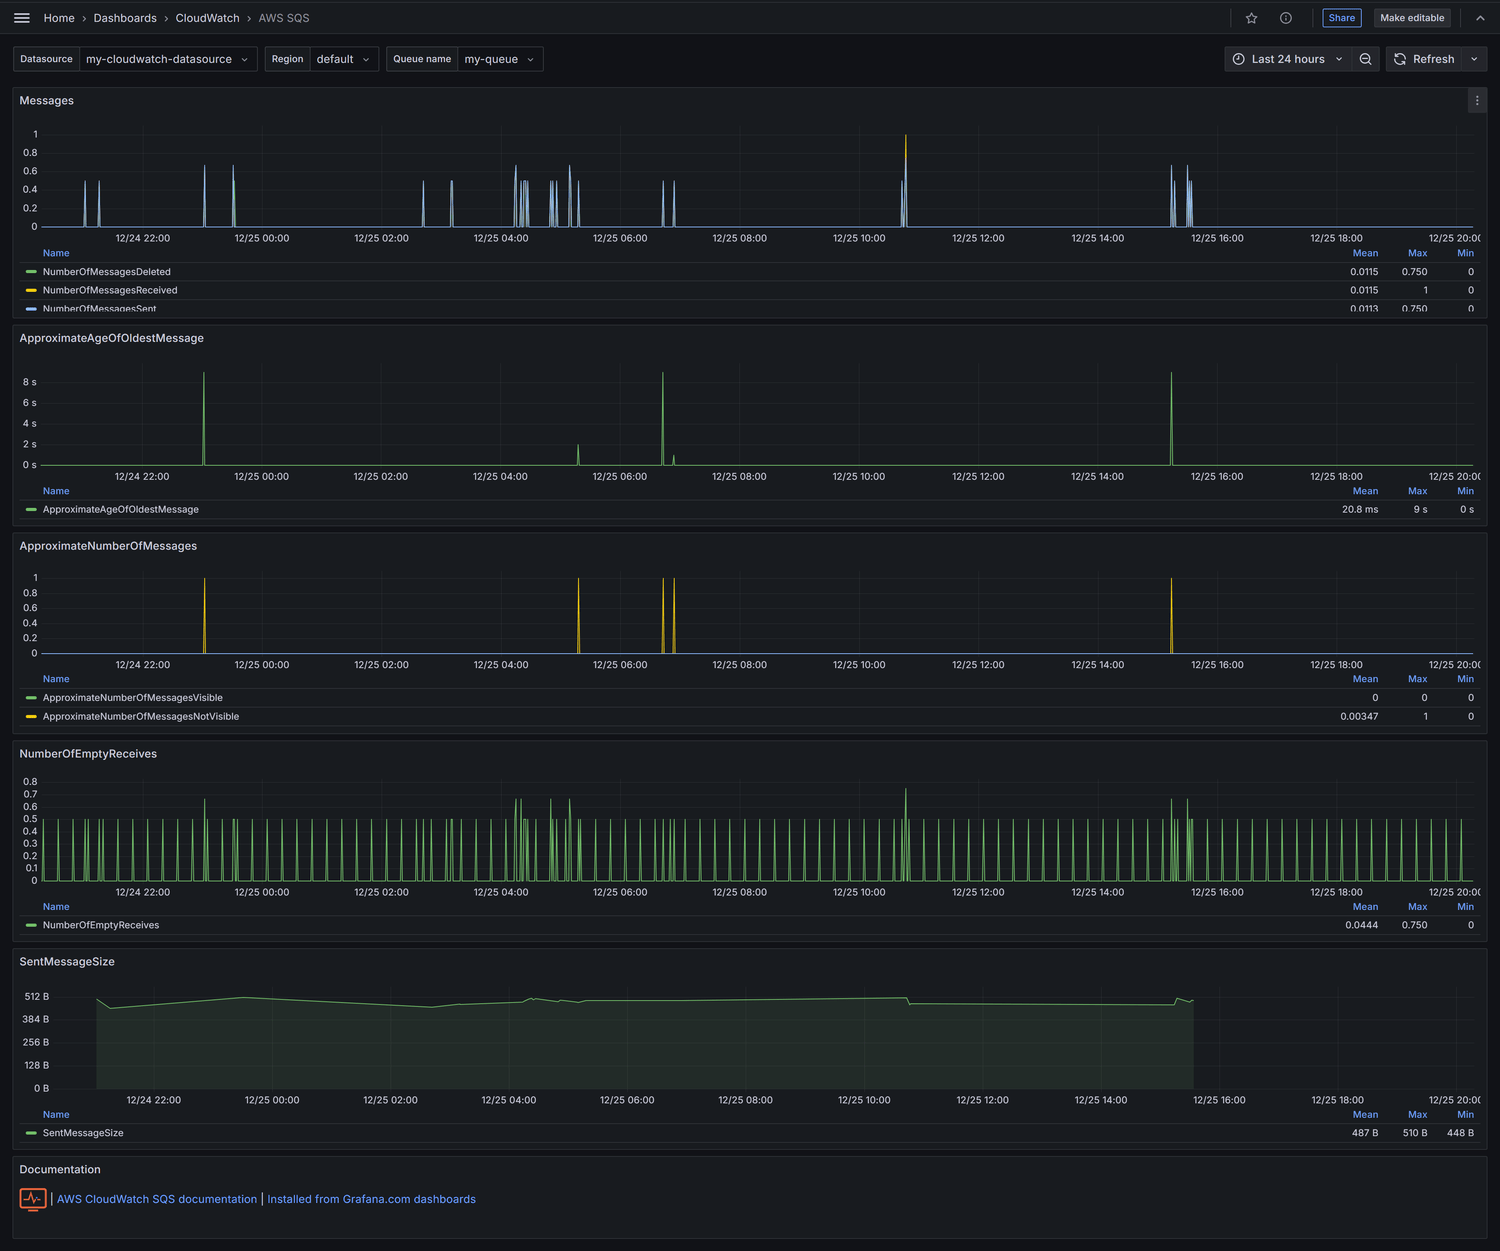
AWS SQS

AWS SQS

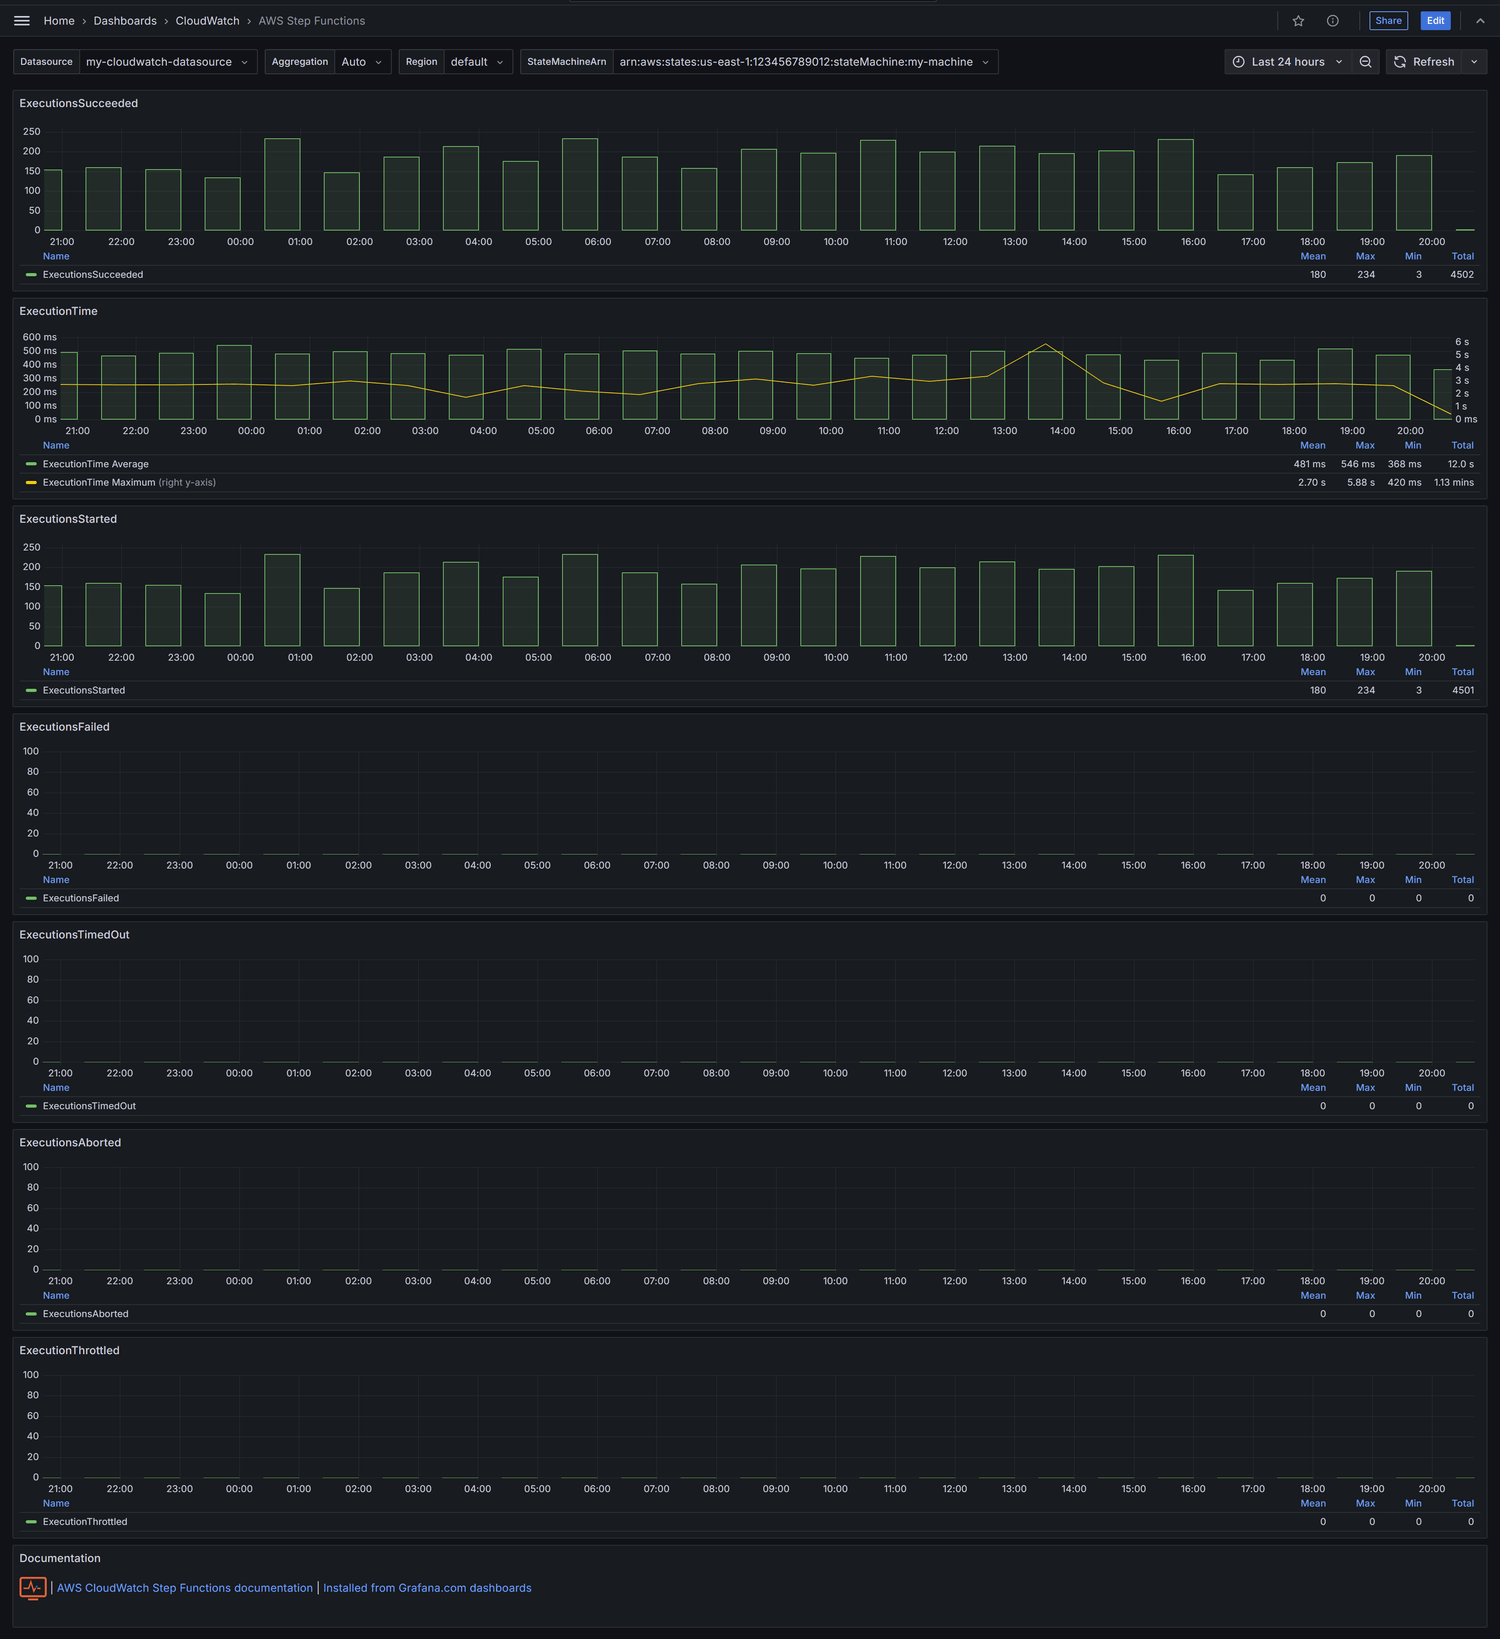
AWS Step Functions

AWS SNS

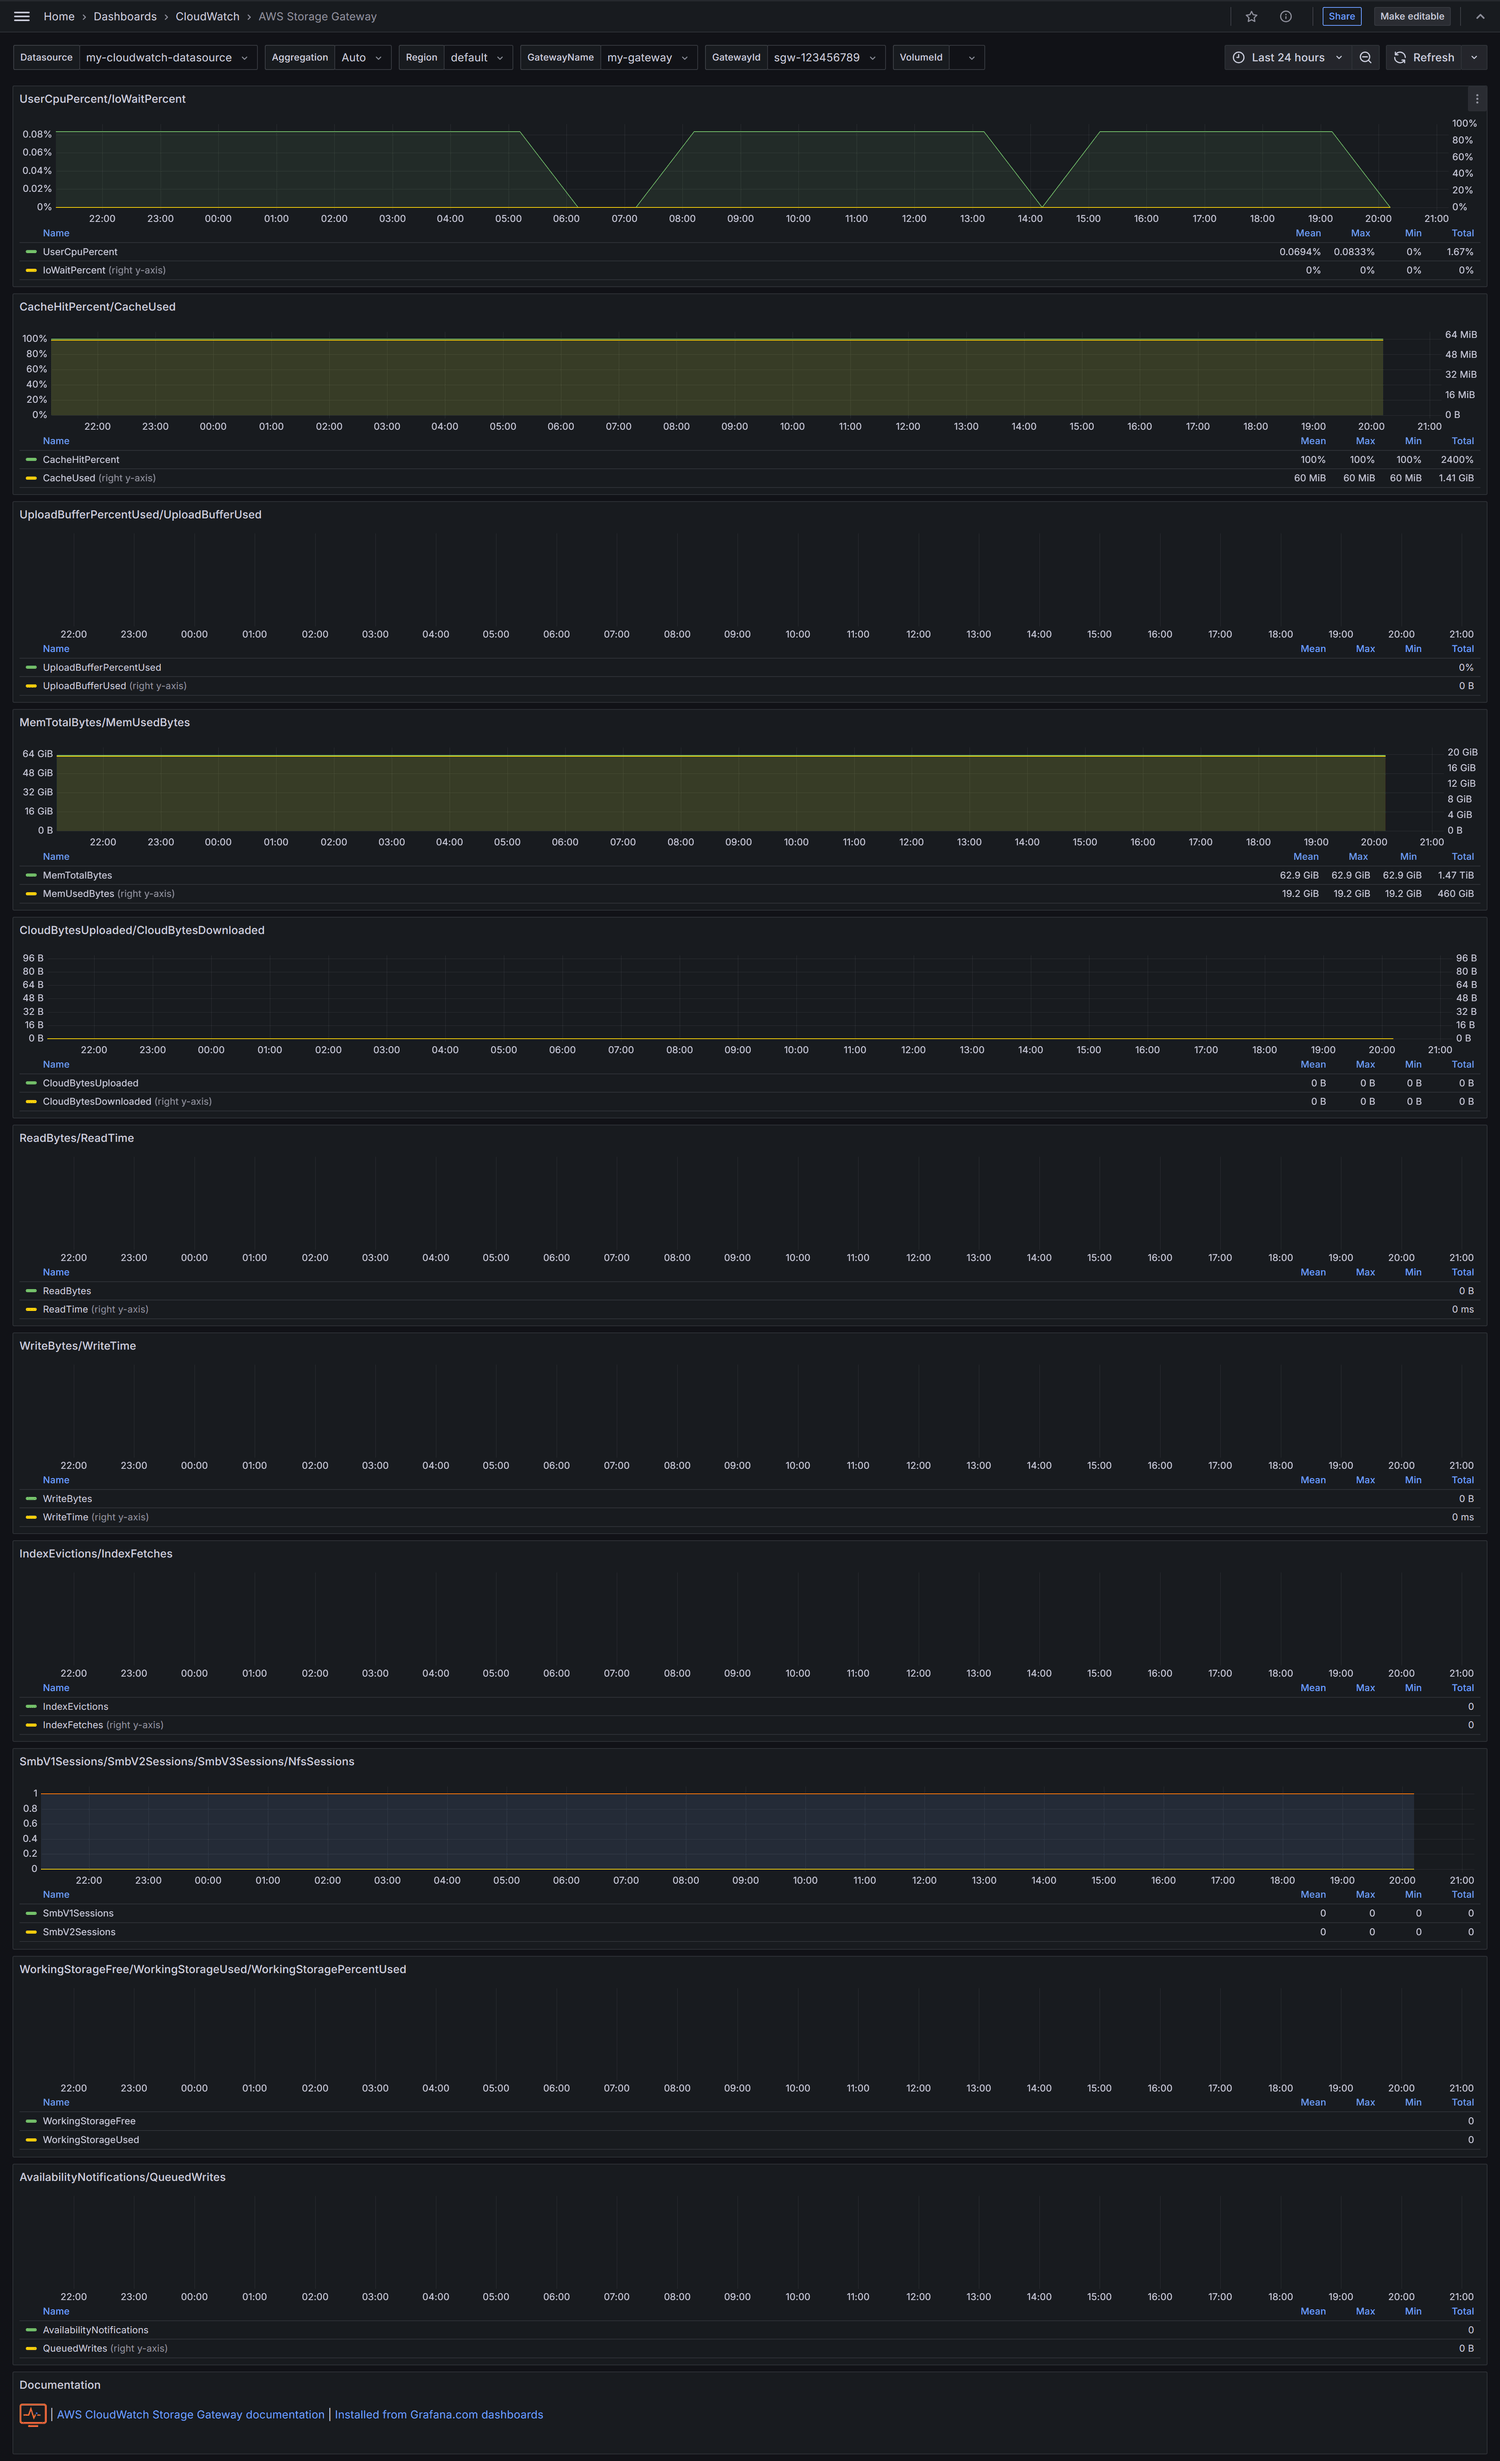
AWS Storage Gateway

AWS Storage Gateway

AWS VPN

Author

Devops Monitoring Expert, who loves monitoring systems and cutting/bleeding edge technologies: Docker, Kubernetes, ECS, AWS, Google GCP, Terraform, Lambda, Zabbix, Grafana, Elasticsearch, Kibana, Prometheus, Sysdig,...

Summary:

Professional devops / monitoring / consulting services:

Monitoring Artist

Note that the project description data, including the texts, logos, images, and/or trademarks, for each open source project belongs to its rightful owner. If you wish to add or remove any projects, please contact us at [email protected].