All Projects → aws-samples → Reinvent2018 Dev303 Code

aws-samples / Reinvent2018 Dev303 Code

Licence: other
Code accompanying AWS re:Invent workshop DEV 303 showcasing how to get deep application insights using Amazon EKS with AWS X-Ray and Amazon CloudWatch.

Programming Languages

python
139335 projects - #7 most used programming language

Projects that are alternatives of or similar to Reinvent2018 Dev303 Code

Prometheusalert
Prometheus Alert是开源的运维告警中心消息转发系统,支持主流的监控系统Prometheus,Zabbix,日志系统Graylog和数据可视化系统Grafana发出的预警消息,支持钉钉,微信,华为云短信,腾讯云短信,腾讯云电话,阿里云短信,阿里云电话等
Stars: ✭ 822 (+1394.55%)
Mutual labels:  prometheus, grafana
Unifiedmetrics
Fully-featured metrics collection agent for Minecraft servers. Supports Prometheus and InfluxDB. Dashboard included out-of-box.
Stars: ✭ 29 (-47.27%)
Mutual labels:  prometheus, grafana
Ebpf exporter
Prometheus exporter for custom eBPF metrics
Stars: ✭ 829 (+1407.27%)
Mutual labels:  prometheus, tracing
Opencensus Java
A stats collection and distributed tracing framework
Stars: ✭ 640 (+1063.64%)
Mutual labels:  prometheus, tracing
Giropops Monitoring
Full stack tools for monitoring containers and other stuff. ;)
Stars: ✭ 1,019 (+1752.73%)
Mutual labels:  prometheus, grafana
Spring Petclinic Microservices
Distributed version of Spring Petclinic built with Spring Cloud
Stars: ✭ 814 (+1380%)
Mutual labels:  prometheus, grafana
Hana sql exporter
SAP Hana SQL Exporter for Prometheus
Stars: ✭ 18 (-67.27%)
Mutual labels:  prometheus, grafana
Prometheus Kubernetes
Monitoring Kubernetes clusters on AWS, GCP and Azure using Prometheus Operator and Grafana
Stars: ✭ 526 (+856.36%)
Mutual labels:  prometheus, grafana
Promcord
📊 Analyze your entire discord guild in grafana using prometheus. Message, User, Game and Voice statistics...
Stars: ✭ 39 (-29.09%)
Mutual labels:  prometheus, grafana
Iota Prom Exporter
Iota Exporter for Prometheus Metrics
Stars: ✭ 33 (-40%)
Mutual labels:  prometheus, grafana
Grafterm
Metrics dashboards on terminal (a grafana inspired terminal version)
Stars: ✭ 613 (+1014.55%)
Mutual labels:  prometheus, grafana
Devops Exercises
Linux, Jenkins, AWS, SRE, Prometheus, Docker, Python, Ansible, Git, Kubernetes, Terraform, OpenStack, SQL, NoSQL, Azure, GCP, DNS, Elastic, Network, Virtualization. DevOps Interview Questions
Stars: ✭ 20,905 (+37909.09%)
Mutual labels:  aws, prometheus
Kube Eagle
A prometheus exporter created to provide a better overview of your resource allocation and utilization in a Kubernetes cluster.
Stars: ✭ 599 (+989.09%)
Mutual labels:  prometheus, grafana
Prometheus
Kubernetes Setup for Prometheus and Grafana
Stars: ✭ 824 (+1398.18%)
Mutual labels:  prometheus, grafana
Swagger Stats
API Observability. Trace API calls and Monitor API performance, health and usage statistics in Node.js Microservices.
Stars: ✭ 559 (+916.36%)
Mutual labels:  prometheus, grafana
Aws Xray Ts Decorator
Instrument your Typescript code with AWS X-Ray using elegant decorators
Stars: ✭ 17 (-69.09%)
Mutual labels:  aws, tracing
Wizzy
Manage & automate Grafana with easy wizzy
Stars: ✭ 461 (+738.18%)
Mutual labels:  prometheus, grafana
Docker monitoring logging alerting
Docker host and container monitoring, logging and alerting out of the box using cAdvisor, Prometheus, Grafana for monitoring, Elasticsearch, Kibana and Logstash for logging and elastalert and Alertmanager for alerting.
Stars: ✭ 479 (+770.91%)
Mutual labels:  prometheus, grafana
Catalyst
Typescript NodeJS Microservices Boilerplate with Generator CLI - Moleculer, GraphQL, REST, OAuth2, Jaeger, Grafana, Prometheus, Ory Hydra, Ory Keto w/ Access Control middleware, Moleculer-DB GraphQL mixin, Pug, Redis, sibling client repo (login, persistance layer, react-native-web, ios, android)
Stars: ✭ 30 (-45.45%)
Mutual labels:  prometheus, grafana
Grafana Prometheus Node Js Example
Step-by-step tutorial on creating beautiful dashboards for your Node JS application
Stars: ✭ 47 (-14.55%)
Mutual labels:  prometheus, grafana

Instrumenting Kubernetes for Observability using AWS X-Ray and Amazon CloudWatch

The goal of this workshop is to demonstrate how to build and monitor modern applications with AWS Elastic Kubernetes Services (EKS), Amazon CloudWatch Logs and AWS X-Ray.

This workshop consists of 3 labs and will walk through the following:

  1. Lab 1
    1. Prepare your environment
    2. Create an AWS EKS cluster with eksctl
    3. Deploy eCommerce microservices demo application
  2. Lab 2
    1. Deploy a log aggregation stack
    2. Deploy metrics collection and visualization
  3. Lab 3
    1. Deploy AWS X-Ray and enable tracing within the sample applications

Note

This workshops is an advanced workshop (Level 300) and requires a deep understanding of AWS capabilities as well as know-how in software development, containers, and Kubernetes.

Application Architecture

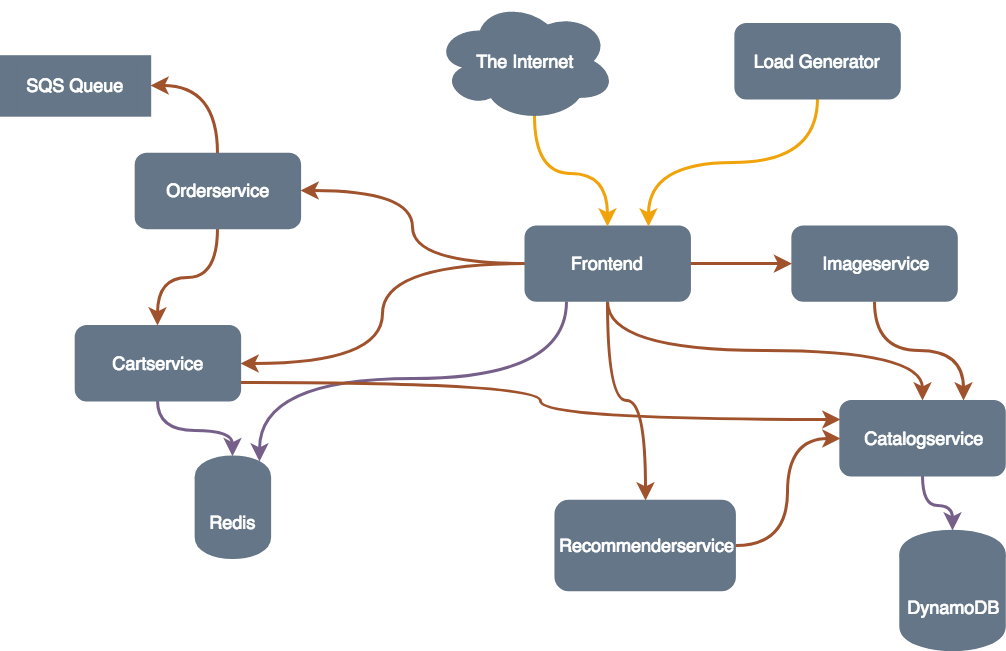
The architecture of the application we will be deploying looks like this:

alt Architecture

The services are either build in Node.js and the Express framework or Python with the Flask framework. As data store DynamoDB is used. To store the cart and the session data a self-hosted Redis is used. The orders are put into an SQS queue, where a worker process could pick them up for order-processing.

Labs

Prerequisites

Prerequisites

Lab 1 - Deploying microservices to Amazon EKS

Deploying microservices on EKS

Lab 2 - Observability for Amazon EKS

Observability for EKS

Lab 3 - Distributed Tracing with AWS X-Ray

Adding distributed tracing

Cleaning up

Cleanup instructions

Troubleshooting

Cloud9 not connecting

Make sure the Cloud9 EC2 instances is running. Check that it has a public IP attached, otherwise the Browser-Component will not be able to connect.

If you can not get Cloud9 to work use a regular EC2 Linux instance to run the commands.

EKS cluster authentication failure

Make sure that you did not create the cluster with the AWS account root user. You have to use an IAM user when creating the EKS cluster.

Doublecheck that your kubectl version is at least version 1.10.0, otherwise the integration with the IAM authenticator is not yet available causing authentication to fail.

Make sure that aws-iam-authenticator is installed and executable, so kubectl can call it when authenticating against the EKS cluster.

Load Balancer URL not accessible

When creating new services in Kubernetes it may take a while until the Elastic Load Balancer is created and becomes available. Also, propagation within DNS may take some additional time. If you can not access a newly created service please just wait a little while and then reload in your browser.

All load balancers are also visible in the EC2 Console -> Loadbalancers, check here for additional details.

Traces not visible

Make sure the X-Ray daemon is running successfully. Check the log output of the daemons to see if the permissions to send traces to AWS X-Ray have been set up correctly.

Long cluster spin up time

Creating the EKS cluster and node group should take around 10-15 minutes. If it takes longer eksctl will run into a timeout. Delete the cluster and simply try again.

Check ELB IAM role

In AWS accounts that have never created a load balancer before, it’s possible that the service role for ELB might not exist yet.

We can check for the role, and create it if it’s missing.

aws iam get-role --role-name "AWSServiceRoleForElasticLoadBalancing" || aws iam create-service-linked-role --aws-service-name "elasticloadbalancing.amazonaws.com"

Configure Storage Class

When using the latest version of eksctl a StorageClass will be automatically created.

Check if a StorageClass exists for your cluster with the command

kubectl get storageclasses

If you do not have a StorageClass installed the deployment of Prometheus and Grafana will fail.

Execute the command

kubectl create -f - <<EOF
{
  "kind": "StorageClass",
  "apiVersion": "storage.k8s.io/v1",
  "metadata": {
    "name": "prometheus",
    "namespace": "prometheus"
  },
  "provisioner": "kubernetes.io/aws-ebs",
  "parameters": {
    "type": "gp2"
  },
  "reclaimPolicy": "Retain",
  "mountOptions": [
    "debug"
  ]  
}
EOF

This will create a StorageClass in your Amazon EKS cluster.

Changelog

  • **04/15/2020 Merge xray branch into master to ease deployment and maintainability.

References & Acknowledgements

  1. Amazon EKS Workshop
  2. Sockshop - Weaveworks
  3. Google Microservices Demo

License Summary

This sample code is made available under a modified MIT license. See the LICENSE file.

Note that the project description data, including the texts, logos, images, and/or trademarks, for each open source project belongs to its rightful owner. If you wish to add or remove any projects, please contact us at [email protected].