neuralfraud / Grafana Prtg
A PRTG Datasource plugin for Grafana
Stars: ✭ 145
Programming Languages
javascript
184084 projects - #8 most used programming language
Labels
Projects that are alternatives of or similar to Grafana Prtg
Grafana Influx Dashboard
Grafana InfluxDB scripted dashboard
Stars: ✭ 130 (-10.34%)
Mutual labels: grafana
Pepper Metrics
pepper metrics is a tool, it can helps you collect runtime performance use RED method, and then output as log / timeseries data, by default it use prometheus as datasource, grafana as UI
Stars: ✭ 119 (-17.93%)
Mutual labels: grafana
Stagemonitor
an open source solution to application performance monitoring for java server applications
Stars: ✭ 1,664 (+1047.59%)
Mutual labels: grafana
Go Notify
An email automation solution, written in Golang.
Stars: ✭ 143 (-1.38%)
Mutual labels: grafana
Gpu monitor
Monitor your GPUs whether they are on a single computer or in a cluster
Stars: ✭ 133 (-8.28%)
Mutual labels: grafana
Globalnoc Networkmap Panel
A network map panel for Grafana
Stars: ✭ 121 (-16.55%)
Mutual labels: grafana
Pi Hole Influx
A python daemon to send Pi-Hole stats for Grafana to InfluxDB
Stars: ✭ 126 (-13.1%)
Mutual labels: grafana
Grafana Rrd Server
A HTTP server that helps Grafana read RRD files via Grafana Simple JSON Datasource plugin
Stars: ✭ 117 (-19.31%)
Mutual labels: grafana
Docker Influxdb Grafana
A Docker container which runs InfluxDB and Grafana ready for persisting data
Stars: ✭ 130 (-10.34%)
Mutual labels: grafana
Keyhole
Survey Your Mongo Land - MongoDB Performance Analytics
Stars: ✭ 142 (-2.07%)
Mutual labels: grafana
Swarmprom
Docker Swarm instrumentation with Prometheus, Grafana, cAdvisor, Node Exporter and Alert Manager
Stars: ✭ 1,739 (+1099.31%)
Mutual labels: grafana
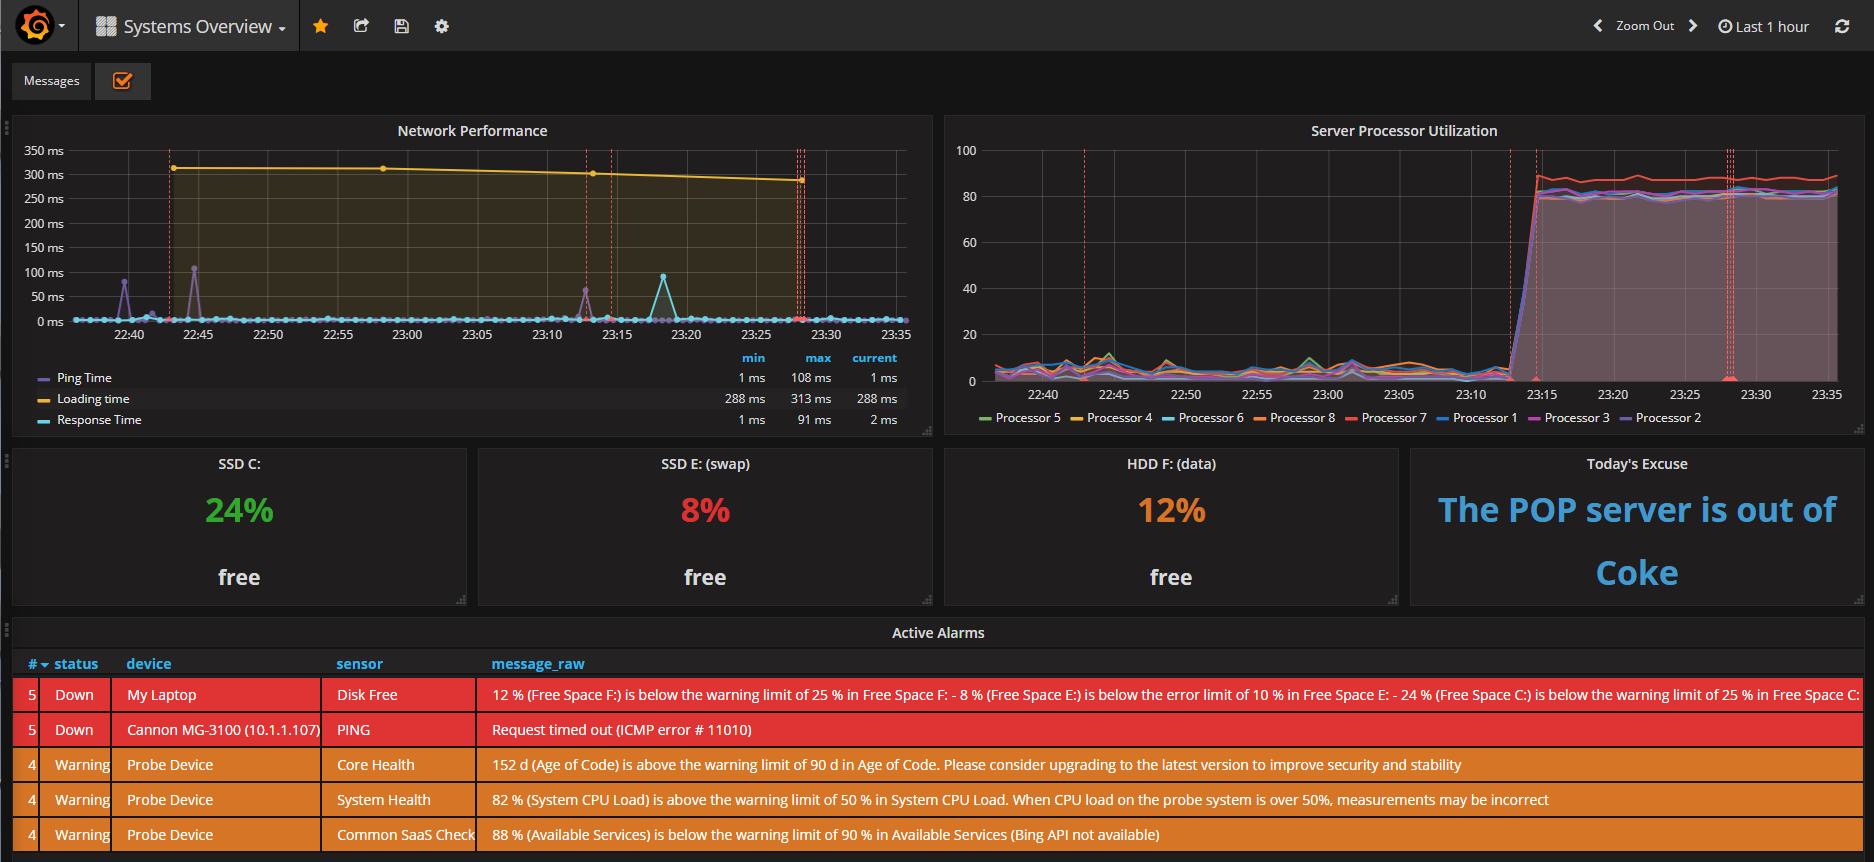
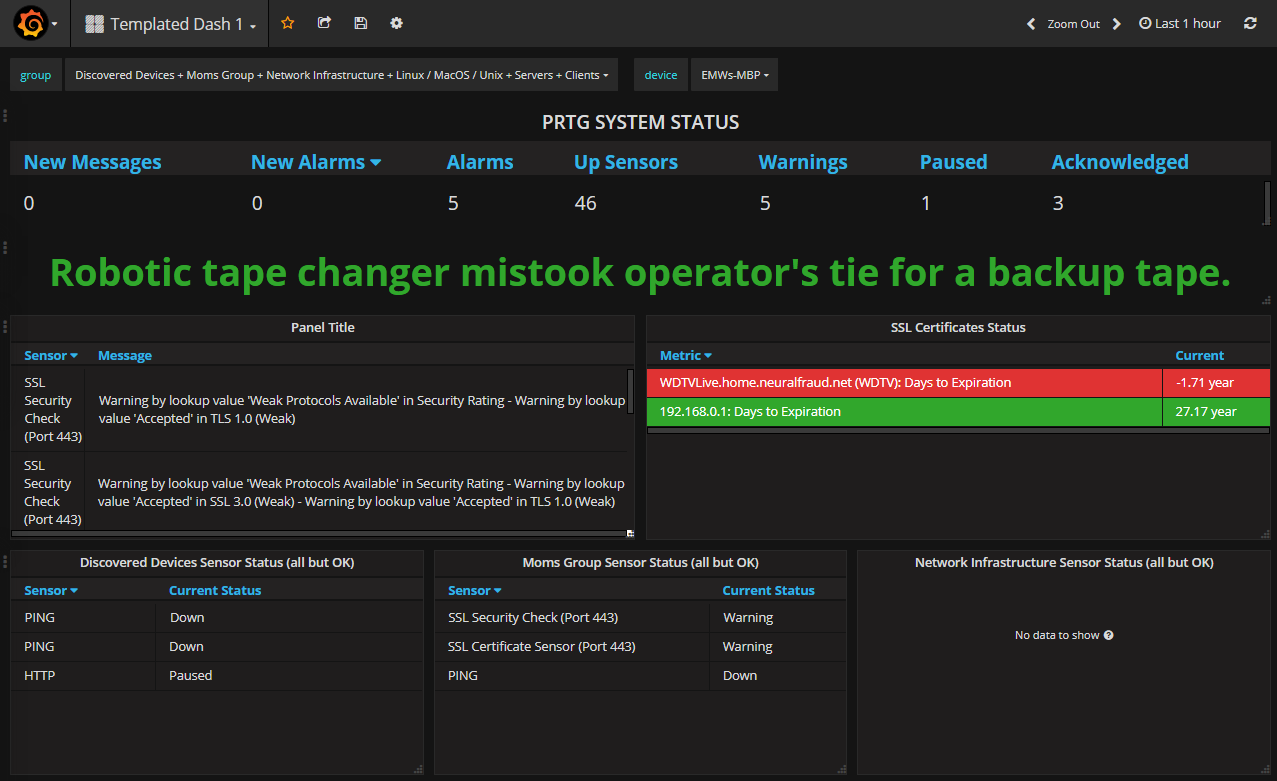
PRTG Datasource for Grafana
![]()
![]()
![]()
![]()
Vizualize your PRTG data with rich, powerful Grafana dashboards!
Features
- Select multiple metrics in a single query using regular expressions
- Select from an array of PRTG metadata properties, including Status, Message, Active, Tags, Priortiy, and more.
- Query raw JSON direct from the PRTG API and render using the Table panel
- Show sensor status messages on graphs with Annotations
Getting Started
Clone this repo or download the zip directly into your Grafana "data/plugins" directory and check out The Grafana-PRTG Wiki to get started.
THANK YOU FOR USING THIS PLUGIN!
For more information, see The Grafana-PRTG Wiki
Note that the project description data, including the texts, logos, images, and/or trademarks,
for each open source project belongs to its rightful owner.
If you wish to add or remove any projects, please contact us at [email protected].